|
Landscape dynamics of Uttara Kannada district |
|
Energy and Wetlands Research Group, Centre for Ecological Sciences [CES],
Indian Institute of Science, Bangalore – 560012, India.
*Corresponding author: cestvr@ces.iisc.ernet.in
Method
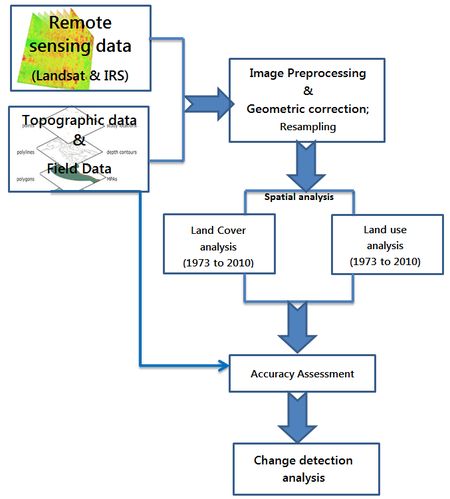
The RS data used in the study are Landsat MSS (1973), TM (1989, 1999), IRS LISS-IV MX (2010), and Google Earth (http://earth.google.com). Figure 2 details the procedure followed in the study. The temporal remote sensing data of Landsat, IRS satellites were acquired and geometrically corrected for the UTM coordinate system of zone 43 using GCPs (ground control points). Survey of India (SOI) topo-sheets of 1:50000 and 1:250000 scales were used to generate base layers – district and taluk boundaries, water bodies, drainage network, etc. Field data were collected with a handheld Garmin GPS. Since the landscape is dominated by forest, training data is collected for different forest types and land use categories. The Landsat data has been resampled to maintain common resolution across all sensors. The normalised vegetation index (NDVI) is computed at temporal scale to assess the status of vegetation in the district. Among all techniques of land cover mapping NDVI is most widely accepted and applied (Weismiller et al., 1977, Nelson, 1983). NDVI is calculated by using visible Red (0.0.63 – 0.69 μm) and NIR (0.76 – 0.90 μm) bands of Landsat TM which reflected by vegetation. Healthy vegetation absorbs most of the visible light that hits it, and reflects a large portion of the near-infrared light. Sparse vegetation reflects more visible light and less near-infrared light. NDVI for a given pixel always result in a number that ranges from minus one (-1) to plus one (+1). NDVI was calculated using Eq. (1)
NDVI = (NIR-R) / (NIR+R) … (1)
The land use analysis was done using supervised classification scheme with selected training sites. Supervised classifier – Gaussian maximum likelihood algorithm is used to classify the temporal data. This method preserves the basic land cover characteristics through statistical classification techniques using a number of well-distributed training pixels. GRASS (Geographical Analysis Support System) a free and open source software having robust support of processing both vector, raster files has been used for this analysis, accessible and downloadable at http://wgbis.ces.iisc.ernet.in/grass/index.php. Spectral classification inaccuracies are measured by a set of reference pixels. Based on the reference pixels, confusion matrix, kappa (κ) statistics and producer's and user's accuracies were computed. Accuracy assessment and kappa statistics are included in table 3. These accuracies relate solely to the performance of spectral classification. The study is carried out at macro and micro scales, i.e. by considering the whole landscape as a single unit and zone based analysis. The spatial analysis was done according to the zones in order to access the detailed land use land cover pattern.
Figure 2: Method followed in the study
|
|
Citation : Bharath Setturu and Ramachandra. T.V, 2012. Landscape dynamics of Uttara Kannada district., Proceedings of the LAKE 2012: National Conference on Conservation and Management of Wetland Ecosystems, 06th - 09th November 2012, School of Environmental Sciences, Mahatma Gandhi University, Kottayam, Kerala, pp. 1-13.
|