 |
Interventions in the Management of Urban Solid Waste
|
 |
1 Energy and Wetlands Research Group, Centre for Ecological Sciences [CES], 2 Centre for Sustainable Technologies (astra),
3 Centre for infrastructure, Sustainable Transportation and Urban Planning [CiSTUP],
Indian Institute of Science, Bangalore – 560012, India.
*Corresponding author: cestvr@ces.iisc.ac.in
|
|
Results
Waste quantity and composition with change in collection :
The quantity of waste reaching to collection site has been significantly increased. Before DtD the total waste collected at CS 1 was 58.34 kg/day – an average of 0.033 kg/capita/day. Whereas after DtD collection 226.84 kg/day was collected at the same collection site, corresponding to 0.128 kg/capita/day – a increase of 0.095 kg/capita/day. This highlights the improvements in waste collection through DtD collection mechanism due to minimized littering on roadsides and drains. Before DtD collection (community bins) waste was having 75.51% organic, 7.48% plastic, 5.78% paper, 3.40% cloth, 1.36% metal, 4.76% glass and 1.70% other. Compared to this, waste composition after DtD collection was 81.64% organic, 11.58% plastic, 4.96% paper, 0.83% cloth, 0.23% metal, 0.36% glass, 0.16% leather and 0.25% other (Table 1).
Table 1: Waste characterization at collection sites
|
|
|
Average (kg) |
|
Average (%) |
CS 1
(Residential area) |
CS 2 |
CS 3 |
| Type of waste |
IISc campus* |
IISc campus after DtD |
Before DtD |
After DtD |
|
|
| Organic |
73.0 |
79.59 |
2.22 |
185.57 |
43.77 |
46.84 |
| Plastic |
9.5 |
12.7 |
0.22 |
26.32 |
11.25 |
6.43 |
| Paper |
18.0 |
6.2 |
0.17 |
11.28 |
7.07 |
3.00 |
| Cloth |
|
2.6 |
0.10 |
1.88 |
2.05 |
5.10 |
| Metal |
|
0.2 |
0.04 |
0.53 |
0.24 |
0.00 |
| Glass |
|
0.5 |
0.14 |
0.82 |
0.00 |
1.00 |
| Leather |
0.1 |
0.00 |
0.35 |
0.00 |
0.00 |
| Other |
|
0.2 |
0.05 |
0.56 |
0.00 |
0.04 |
| Note: DtD = Door-to-Door; *Sathiskumar et al., 2001 |
Total waste quantity and composition of campus after implementation of Door-to-Door collection :
Total waste collected through DtD collection was 347.46 kg/day, which was varying throughout seven days. Variation range was from 239.92 kg/day to 523.72 kg/day at different collection sites (Fig 2). There were three collection sites located in three parts of campus (Fig 1). CS 1 (near to faculty quarters) has contributed 65% and CS 2 and CS 3 has contributed 18% and 17%, respectively.
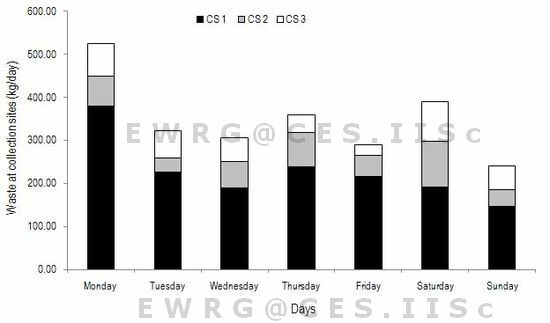
Fig. 2. Day wise waste collected in the campus after implementation of Door-to-Door collection
CS 1 covers all waste collected from block A, B, C, D, E and Duplex staff and faculty Quarters. Total number of apartments was 444 and per capita generation was 0.128 kg/day with an assumption of 4 members in each family. CS 2 covers all waste collected from 195 apartments located in block Thunga, Cauvery, Kapila and Ramanujan and new staff quarters and staff quarters. It has per capita generation of 0.08 kg/day. CS 3 covers SSQ (B block), SSQ (C block), HMT road (A and B block), YPR (A and B block) and Aryabhatta block and their per capita generation is 0.106 kg/day. Per capita generation was high at CS 1, which leads to high percentage contribution of total waste collected at collection sites. Statistical analysis reveal of significant variation in compositions at CS 1 compared to other two collection sites. Organic, plastic and paper are three large contributing waste components in all three sites. The statistical analyses indicate of significant difference between three collection sites for organic (F:30.02, p,0.005), plastic (F:19, p<0.005) and paper (26.23, p<0.005).
|
Citation : Ramachandra. T.V., Shwetmala and Chanakya H.N., 2012. Interventions in the Management of Urban Solid Waste., International Journal of Environmental Sciences, Vol 1 (3), Pages 259–267.
|