Study area :
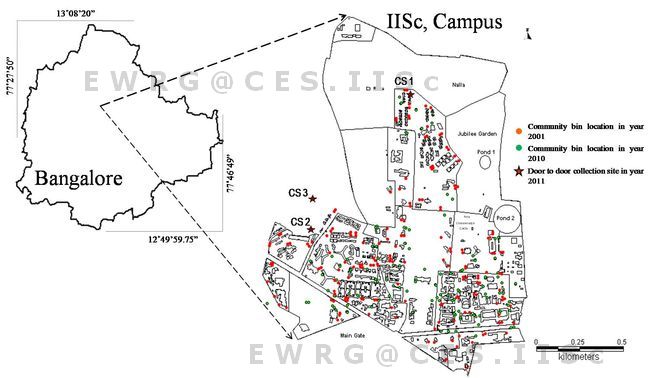
The study has been carried out in the IISc (Indian Institute of Science) campus located at northern part of Bangalore City (Fig 1). Campus boundary limits are enclosed within 13.01 to 13.02° latitude and 77.55 to 77.57° longitude. It covers an area of 180 hectares. The campus waste management has evolved from the community bin collection to DtD collection (implemented in 2011) with segregation of garbage at source level. It was possible to analyze the composition of the waste in different bins before and after the implementation of collection system. It was also advantageous to evaluate impacts associated with collection practices to analyze the merits of DtD collection compared to the earlier community bin collection.

Fig. 1. Spatial distribution of bins
Selection of bins :
Visual surveys of bins were undertaken for one week covering all bins in the campus and compared with the earlier study (Sathiskumar et al., 2001) to understand the changes, if any. The purpose was to determine the area where bins receive more quantity of organic fermentable waste. Bins situated near departments, hostel, cafeteria/mess and residential area was selected and 142 bins were surveyed to see their waste composition as well as to find bins which are frequently used for organic waste. Among these 142 bins, about 12 large size hut bins are present. Among these large size hut bins, 4 bins which used to receive large fraction of organic waste (from residential colonies) are now being used as transfer station with the introduction of DtD collection. Quantification of wastes in these large size community bins was done in April 2010 and repeated after the implementation of DtD collection.
Survey of waste quantification and characterization :
The next step was to determine the total quantity and the composition of the waste in the selected bins were organic content was more than other bins. Four bins were selected for detail further study. Waste was quantified and segregated into different components before and after the implementation of DtD collection. A comparative study was used to assess the success of the DtD collection system.
Quantification and characterization of waste before implementation of Door-to-Door collection at CS 1 :
Quantification of daily waste generation was carried out in April, 2010, when the campus was having only community bin collection system. Four community bins in the residential colony were sampled (CS 1). Samples were selected based on one week visual monitoring of that area. These four sampling points were representative because large number of residents throws their waste in these community bins. These four bins were continuously monitored for three days. In order to determine the weight of the solid waste generated daily within the campus, all four community bins were completely emptied. Plastic sheets of size 1.1 m×1.1 m were spread in the bins, to enable easy collection of daily wastes. Wastes were collected twice daily (morning and evening) and segregated manually into different categories- organic, plastic, paper, cloth, metal, glass, leather and other and each component were weighted separately (Kumar and Goel, 2009). Weighing scales were re-calibrated and cross calibrated regularly. These bins were thus monitored for three days and category wise average weight of waste is computed.
Quantification and characterization of household wastes after implementation of Door-to-Door collection :
Quantification of daily waste generation was also carried out during March-April, 2011, after the implementation of DtD collection. DtD collection and waste management in the campus was outsourced to a private company. Waste monitoring was done for seven days at three collection sites - Collection Site 1 (CS 1), Collection Site 2 (CS 2) and Collection Site 3 (CS 3) as shown in Fig 1. In order to determine the weight of the solid waste generated within the campus, the waste collected in each pre-weighed container (trolley wise) were weighed. Later these wastes were segregated into organic, plastic, paper, cloth, metal, glass, leather and other categories. First day the quantity of different wastes which goes in container was weighed separately. With this information the average daily waste generation was estimated based on number of filled containers with different waste categories. At regular interval, weighing values were cross calibrated with weighing scale. The average weight of each category of waste was documented for continuously seven days. The weight percentage for each category was computed based on the quantity (kg) of each category. This helped to assess the changes in the waste composition. One way ANOVA confirm of significant differences in the collection systems at p<0.05. All statistical analysis was performed with PAST software (Hammer et al., 2001). Relative merits in waste management system through DtD collection and community bin (at site 1) were analyzed to understand the benefits of interventions in waste collections.


