|
Material and Methods
A digital elevation model (DEM) was created for Bangalore city using ASTER image of 30m resolution to analyze water catchment areas and drainage basins within the boundary of the city. There are three water catchments and drainage paths in the city namely Vrishabhavathi, Hebbal, Koramangala and Challaghatta valley systems (Fig 3).
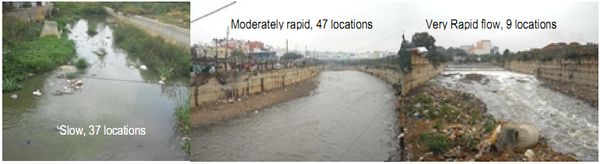
Figure 1: Details of channel flow.
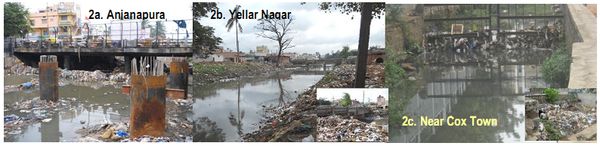
Figure 2: Details of the three study sites subject to urban flooding. Photo insets indicate the choked area while stagnant water in larger photo shows blockage of regular flow.
Table 1: Details about three major flooding area
| Sr. No. |
Area |
Type of flow |
Duration of flood (hrs) |
Average flood height (m) |
Waste details |
| 1 |
Near Anjanapura temple (Bapuji Nagar, Byatarayanapura and Kavika layout) |
Mixed pockets of slow & fast |
3 |
0.9 |
Plastic, paper and construction waste (Fig 2a) |
| 2 |
Near National Games Village (Anepalya, Dr. Ambedkar Nagar and Yellar Nagar) |
Slow |
3.5 |
0.9 |
Plastic, paper and organic waste (Fig. 2b) |
| 3 |
Near Cox town (Assaye Road and Kenchappa Road) |
Slow |
2.5 |
0.8 |
Plastic and cloth (Fig. 2c) |
There are four methods to check the drainage performance; resident survey, direct observations during floods, chalk gauges and electronic sensors (Kolsky and Butler, 2002). Electronic sensors are costly and require protection from vandalism where as Chalk gauges are low cost and require frequent visits to site. In this study we adopted direct observations post flooding along with verification by interviews with selected residents of the area. Water marks and wet patches after flooding were used as indicators of the levels to which water had risen. The duration of the flooding was determined as an average from interviews with residents. The residual blockages and materials causing blockages were firstly observed visually and detailed photographs were taken. From the visual estimate of the blocking material as well as from the photographs the composition of the blocking material was estimated (Sathiskumar et al., 2005).
Field survey was conducted for three months in 2011. It was divided into two phases. Survey was initiated based on local information, news of flooding in newspapers and other available literature that recorded past events of flood prone areas. The first survey was conducted in rainy season (in the month of Jun-July) to determine the exact locations, the points most vulnerable and typical causes that could be measured. This helped arriving at a suitable methodology to monitor and record such events including causal factors. Among the identified vulnerable sites, three segments representing around 50% of major drainage flooding locations were monitored. About 1-4km upstream of these locations were also observed to understand the sources, extent and types of USW disposal into the water channels. A total of 97 points around the path of the drain were observed along with a hand held global position system (GPS, Garmin 60/72). All drainage locations recorded were classified into three categories of flow, namely, slow flowing (<0.5m/sec), moderately fast flowing (0.5-2m/sec) and very rapidly flowing (>2m/sec) regions of the drain. These are put out in Table 1 and Figure 1. Drainage channels were monitored starting from their origin in the upper reaches within the city up to locations where they merge to form very large flow type of drainages /sewers carrying more than 100 MLD of sewage. These smaller drains /sewers finally drain in to the Vrishabhavathi stream (valley) to the South-West direction (400 MLD), to the north east into the Hebbal valley (north east direction) and third into the Koramangala and Challaghatta valley (400 MLD) in the South-East direction.
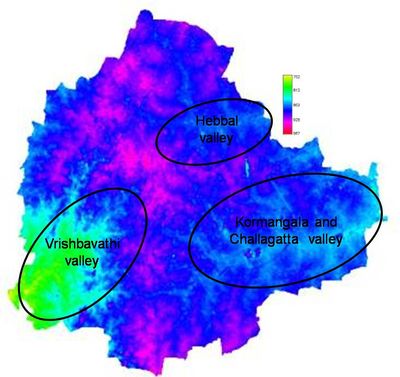
Fig 3: Digital elevation model (DEM) with drainage valley area of the city
Direct observations during floods gave a detailed understanding of the extent, type and frequency of urban flood pockets. Flooding indicators were easy to delineate from non flooding area. Chain link and masonry fences around the drains provided various signatures of past flooding and thereby the levels to which the water had risen during these flood events. As mentioned earlier, chain link and barbed wire fences and stone masonry walls in the flood zone trap various objects from the floating USW in the flood event that is discernible immediately after the flood event. Similarly wet patches or USW objects hanging around the trees, bushes or other plants close to drainage as well as extensive scattering of drifted USW indicated that such large quantities of USW could be the causal agents of flooding in that specific area. From this survey, three flooding areas were selected based on the level of flooding and waste accretion. In all these locations drainages were either narrow or partially blocked with solid waste.
The second survey was conducted in the selected flooding region of the city. The selected areas were Anjanapura temple, National Games Village and Cox Town. These have been identified flood prone areas of Bangalore (Gupta and Nair, 2011). In these localities watermarks of the flood were very clear on the walls of houses or commercial places. We conducted interviews with at least three local residents in each location to find out the flood level within houses, frequency of flood and duration of flood. The flooding frequency, extent, depth and duration were recorded in interviews and from the abovementioned water marks (Kolsky and butler, 2002). We also measured the depth of water flowing in all the three locations to know the general water depth in drainage. GPS were used to find the elevation of drainage channels. All the GPS points were taken at less than 1 meter distance from channel to avoid the associated errors.
|
