 |
Hotspots of solar potential in India
T V Ramachandra1,2,3,* Rishabh Jain1 Gautham Krishnadas1
|
1 Energy & Wetlands Research Group, Center for Ecological Sciences [CES],
2 Centre for Sustainable Technologies (astra),
3 Centre for infrastructure, Sustainable Transportation and Urban Planning [CiSTUP],
Indian Institute of Science, Bangalore, Karnataka, 560 012, India
RESULTS
Figures 4a-4c gives the monthly average Global insolation variations with isohels. During the January (winter) month, major parts of the Southern Peninsula receive above 4.5 kWh/m2/day reaching a maximum of 5.5 kWh/m2/day in the Western Coast plains and Ghat regions, while the Western Himalayas in Northern India receives minimum of 2.5 kWh/m2/day. During February, a major expanse of the Indian landscape receives above 5 kWh/m2/day while the Western (Himachal Pradesh, Uttarakhand, Jammu Kashmir) and Eastern (Assam, Arunachal Pradesh, Nagaland) Himalayas continue receiving insolation in the range of 3-4 kWh/m2/day. During April-May as the summer heat sets in, more than 90% of the country is seen to receive insolation above 5 kWh/m2/day with a maximum recorded 7.5 kWh/m2/day in the Western dry and Trans-Gangetic plains. During this period, the Eastern Himalayan region receives a minimum 4.7 kWh/m2/day global insolation. With the onset of the summer monsoon throughout the country in June, there is a remarkable lowering of Global insolation towards the Southern (except for Tamil Nadu) and North Eastern ranges. The least recorded value in this period is 3.9 kWh/m2/day. This trend continues till September as the summer monsoon recedes. The Northern part of the country remain minimally affected by this monsoon and is observed to receive higher values in the range of 5-7 kWh/m2/day. The Northeastern monsoon originating from Central Asia in October brings the Global insolation below 4 kWh/m2/day in the Lower-Gangetic plains, East Coast plains as well as the Northern most tip of the country. The Himalayan foothills, plains, Central Plateau and Western dry zones receive above 4.7 kWh/m2/day as the Himalayas act as a barrier to this winter monsoon and allows only dry winds to the Indian mainland. With the arrival of winter by October end, the Northern to Western regions in India receive below 4.5 kWh/m2/day for about three months. These observed seasonal variations of Global insolation throughout the country conforms with the earlier investigations [2] based on 18 surface solar radiation stations.
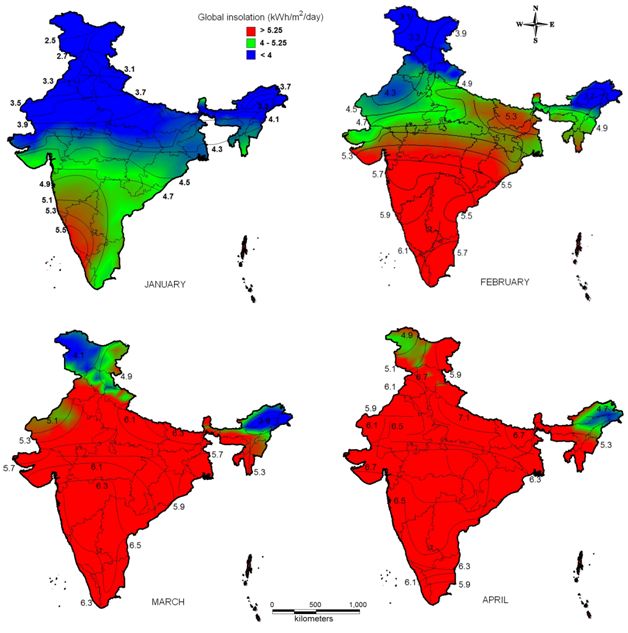
Figure 4 a: Monthly average Global insolation maps of India detailed with isohels (January to April)
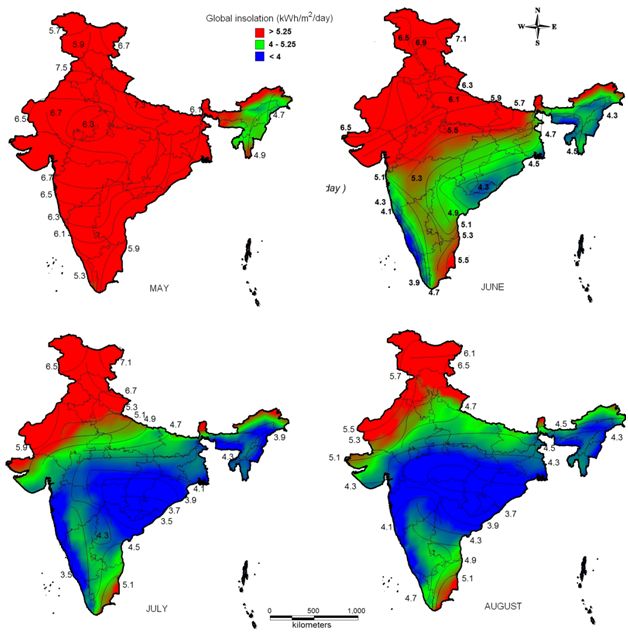
Figure 4 b: Monthly average Global insolation maps of India detailed with isohels (May to August)
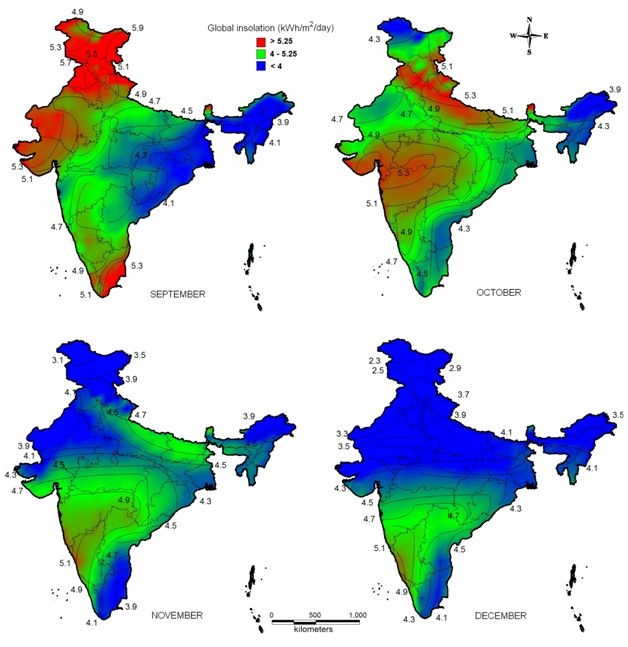
Figure 4 c: Monthly average Global insolation maps of India detailed with isohels (September to December)
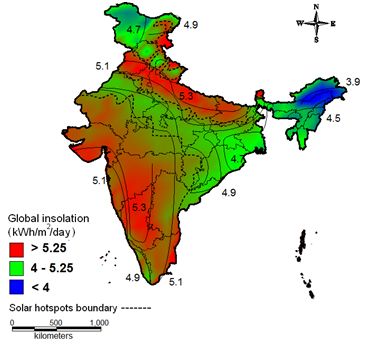
Figure 5: Annual average Global insolation map of India showing the isohels and solar hotspots
Figure 5 illustrates that the Gangetic plains (Trans, Middle and Upper) Plateau (Central, Western and Southern) region, Western dry region, Gujarat Plains and hill region as well as the West Coast plains and Ghat region receive annual Global insolation above 5 kWh/m2/day. These zones include major federal states of Karnataka, Gujarat, Andhra Pradesh, Maharashtra, Madhya Pradesh, Rajasthan, Tamil Nadu, Haryana, Punjab, Kerala, Bihar, Uttar Pradesh and Chattisgarh. The Eastern part of Ladakh region (Jammu & Kashmir) and minor parts of Himachal Pradesh, Uttarakand and Sikkim which are located in the Himalayan belt also receive similar average Global insolation annually. These regions with viable potential constitute solar hotspots covering nearly 1.89 million km2 (~58%) of India (Figure 5) with the favourable prospects for solar based renewable energy technologies. The Eastern Himalayan states of Arunachal Pradesh, Nagaland and Assam receive annual average global insolation below 4 kWh/m2/day.
Techno-Economic Feasibility of Solar energy
The true potential of the identified solar hotspots is realized only with the proper dissemination of technologies for large scale power generation. This section focuses on the techno-economic aspects of solar power technologies like SPV and CSP apart from the social and organizational aspects.
SPV based power generation: Electricity generated by SPV cells is proportional to the area exposed and the intensity of global insolation received. Its conversion efficiency is defined by η = Po / Pi where Po is the maximum power output and Pi is the power input at Standard Test Conditions (STC) of 1000 W/m2 global insolation, 25ºC module temperature and 1.5 air-mass (AM). SPV technology has immensely improved in efficiency in the past few decades. The first generation mono and poly crystalline Silicon (mc-Si and pc-Si) wafers with 15-22% and 12-15% cell efficiencies respectively continue to dominate the world SPV production. Nearly 98% of SPV cell production in India is Si based and caters to the domestic as well as export needs [7]. The thin film Amorphous Silicon (a-Si) and mc-Si (η = 6-10%), Cadmium Telluride (CdTe) (η = 7-10%), Copper-Indium-Diselenide (CIS) and Copper-Indium-Gallium-Diselenide (CIGS) (η = 10-13%) are being commercialized on experimental basis the world over. The dye-sensitized, organic, multi-junction, concentrator and rectenna based technologies promising very high efficiencies are in their nascent stages of development [29]. The International Energy Agency has set a target of 23% commercial SPV module efficiency by 2020 with 12 months payback time for 1500 kWh/kWp and 30 years operational time. The commercial efficiency of 16% assumed earlier has already been achieved by 2008 [30].
Component selection and system design plays a pivotal role in the SPV based power generation. SPV system sizing based on Global insolation, seasonal variability, elevation angle, temperature and other aspects like battery capacity for meeting the load is now simplified through optimization tools like HOMER [23]. The SPV cell performance specified at STC is never realized on field conditions [31]. The actual output of a SPV system will slowly rise to maximum at noon and decrease back to zero at night. For a mc-Si SPV cell, the change in efficiency with temperature is found to be ±0.5 % oC-1 [32]. For long term power generation, this inverse variation of efficiency with temperature is more or less compensated by diurnal and seasons changes. However an evident dip in cell efficiency will be observed for arid regions like Rajasthan where temperature sores up to 45oC and more. Water cooling so as to lower the SPV cell temperature is observed to increase electricity generation by 9-12% [33]. A typical Si based solar panel may vary from 0.5 - 2 m2 in size with an approximate weight of 15-20 kg/m2. A SPV based system without battery backup on-site may actually only be able to provide 67.5% of the maximum power output on a clear sky. This is attributed to factors like time of the day, internal heating, dust, module mismatch, wiring and DC-AC conversion losses affecting the overall system performance. If a battery is added to the system the output may further reduce by 6-10%. According to the orientation of the panel a correction factor may creep in with values ranging from 0.80 to 1.00 [34]. Components like inverters, batteries, mountings and other electrical appliances usually escalate the price of the SPV system. The overall system prices in 2009 were seen to be nearly Rs 500/Watt for off-grid and Rs 250/Watt for grid-connected SPPs which has certainly gone down with the market demand [35]. It is observed that integrating SPV module, charge controller, inverter, wiring, support structure and foundation as a preassembled unit reduces cost, failures and installation effort [23]. These modules could be commercialized for effective village electrification in India.
CSP based power generation: Unlike low-temperature solar thermal devices like water heaters, room heaters, agro-dryers, cookers etc, CSP technology preferentially utilizes the Direct component of global insolation which could be forwarded on to a receiver using lenses or mirrors (stationary or sun tracking). The receiver being of smaller area decreases heat loss and hence increases the output efficiency [31]. The heat transfer fluid (pressurized steam, gases, synthetic oil, molten salt etc) inside the receiver flows to a heat engine where the heat energy is partially converted to electricity. There are four common CSP technologies namely parabolic trough, power tower, parabolic dish and compound linear Fresnel reflectors which are detailed in Table 3. The temperature of the receiver may have a range of 250°C to 1500°C depending on the concentration ratio (Collector to Receiver area) which can vary from 30 to 10000 according to the design. Parabolic trough design dominates more than 90% of the CSP market in the world. Dish type system has the highest optical efficiency but is preferred for standalone applications due to the cost factor. Compound Linear Fresnel design has lower installation and maintenance cost and covers lesser land area [36]. Commercial parabolic trough CSP plants show system efficiencies to the range of 10-14% [37]. The integrated solar combustion cycle system (ISCCS) combining parabolic trough and gas turbine is a promising modification to the existing technology. Water is generally used for steam cycle, mirror washing and cooling tower. It could be compensated by dry cooling systems but at an increased generation cost of 10% [21]. A benefit of CSP over SPV technology is the heat storage option which is relatively easier and cost effective than electricity storage. The sensible, latent and thermo-chemical heat storage techniques are being developed and demonstrated. This thermal storage helps in providing balancing power during dark hours and also acts as a substitute for fossil fuels. It is also promising for co-generation. CSP plants are considered to have a minimum life of 20 years. The parabolic trough CSP generation cost ranges from Rs 5-7/kWh as of today which is higher than coal based thermal power generation. Experiences in different countries indicate that cost reduction will be realized only with increase in volume, plant scale-up and technological advancement [38]. The Chinese renewable energy policy aims at bringing the CSP generation cost to Rs 2-3/kWh by 2025 through intensive R&D measures [22]. Nearly 50% of the investments in CSP based power plants goes for locally available steel, mirrors, concrete, and labour providing socio-economic stability and local support [39]. Undeniably, CSP adapts well to the Indian socioeconomic conditions but needs vigorous R&D up-scaling.
Table 3: Different types of CSP technologies and their features
| Design | Capacity (MW) | Operating temperature (oC) | Insolation enhancement (%) | Land (ha/MW) | Water (m3/MWh) |
| Parabolic trough | 10-200 | 300-400 | 30-40 | 4 | 2.9–3.5 |
| Power tower | 10 – 150 | 500-1500 | 60-70 | 8.4 | 2.9–3.5 |
| Parabolic dish | 0.01-0.04 | 750 | 60-70 | 1.6 | Nil |
| Compound linear Fresnel | 1-200 | 250-300 | 30-40 | 0.18 | 2.8 |
Prospects of solar power in India
India receives annual sunshine of 2600 to 3200 hours [2]. Table 4 shows the power input (Global insolation), maximum rated and actual on-site output (67.5 % of the rated as observed earlier) values at two different efficiencies (16% and 20%) for a system without battery backup considering the minimum ~7 hours of daily sunshine (or 2600 hours of annual). Regions receiving Global insolation of 5 kWh/m2/day and above can generate at least 77 W/m2 (actual on-site output) at 16% efficiency. Hence, even 0.1% of the land area of the identified solar hotspots (1897.55 km2) could deliver nearly 146 GW of SPV based electricity (379 billion units (kWh) considering 2600 sunshine hours annually). This power generation capacity would enhance considerably with the improvement in efficiency of SPV technology.
Table 4: Maximum and actual on-site power output of a typical Si based SPV cell at 16 % and 20% efficiencies assuming 7 hours daily sunshine
| Power input Pi | Maximum power output Po | Actual on-site power output | |||
| kWh/m2/day | W/m2 | η=16% | η=20% | η=16% | η=20% |
| 2.5 | 357 | 57 | 71 | 39 | 48 |
| 3 | 429 | 69 | 86 | 46 | 58 |
| 3.5 | 500 | 80 | 100 | 54 | 68 |
| 4 | 571 | 91 | 114 | 62 | 77 |
| 4.5 | 643 | 103 | 129 | 69 | 87 |
| 5 | 714 | 114 | 143 | 77 | 96 |
| 5.25 | 750 | 120 | 150 | 81 | 101 |
| 5.5 | 786 | 126 | 157 | 85 | 106 |
| 5.75 | 821 | 131 | 164 | 89 | 111 |
| 6 | 857 | 137 | 171 | 93 | 116 |
| 6.5 | 929 | 149 | 186 | 100 | 125 |
| 7 | 1000 | 160 | 200 | 108 | 135 |
Direct insolation with a minimum threshold value of 1800 kWh/m²/year or ~5 kWh/ m2/day is best recommended for CSP in order to achieve Levelised Electricity Costs (LEC). A minimal inclined (slope 0-3%) non-agricultural and biologically sparse land area of 4 ha/ MW (considering the typical parabolic trough) is consequential for CSP based power generation. The proximity to transmission line corridor and availability of water would be favorable factors [21]. CSP technologies perform better in semi arid and arid regions. Surface solar radiation studies in the Trans-Gangetic, Western dry, Plateau and Gujarat plains and hill regions of India show that Direct insolation is higher in intensity to the Global insolation during the summer, post-monsoonal and winter months due to clear sky conditions and variations in elevation angle. During the monsoon months of June, July and August, the Direct component is nearly half of the total Global insolation received [2]. Hence the potential solar hotspots identified in the study receiving excellent Global insolation obtain sufficient Direct insolation as well and support CSP based power generation. However, the solar hotspots in the cold Himalayan belt including Eastern Ladakh and minor parts of Himachal Pradesh, Uttarakhand and Sikkim may not favor CSP technology. Estimates reveal that about 4.89 million ha of barren and unculturable land is available in Gujarat and Rajasthan (Table 5). Even a small fraction of this waste land (0.1% or 4890 ha) could support nearly 1222 MW capacity parabolic trough CSP plants. Comparative studies have shown the financial viability of CSP technologies in Indian conditions especially in the semi arid and arid regions [36] and hence these regions are identified as solar hotspots.
India has a vast potential for solar power generation since about 58% of the total land area (1.89 million km2) receives annual average Global insolation above 5 kWh/m2/day. Being a densely populated country with residential, agricultural and industrial priorities, availability of land for SPPs is of serious concern in some parts and needs further investigation using spatio-temporal data. Recent land use statistics (Table 5) highlights the availability of barren or unculturable land in many states like Rajasthan, Gujarat, Andhra Pradesh, Maharashtra, Karnataka, Tamil Nadu, Uttar Pradesh, Madhya Pradesh and Bihar [47]. It is observed that the per capita electricity consumption is recorded to be the highest in Western India (1029.52 kWh/year) followed by Southern and Northern regions [7]. Most of the identified solar hotspots are also in these regions, and hence solar power generation could reduce transmission losses due to its decentralized distributed nature.
According to NTPC Vidyut Vyapar Nigam (NVVN) Limited, the national nodal agency for allotting solar power projects, 620 MWp of solar power projects (470 MWp CSP & 150 MWp SPV) are selected for the first phase of NSM which ends by May 2013. CSP based plants are proposed for Rajasthan (400 MWp), Andhra Pradesh (50 MWp) and Gujarat (20 MWp), while SPV projects are based in Rajasthan (105 MWp), Andhra Pradesh (15 MWp), Karnataka (10 MWp), Maharashtra (5 MWp), Uttar Pradesh (5 MWp), Orissa (5 MWp) and Tamil Nadu (5 MWp) [40]. Various States like Gujarat, Uttaranchal, Uttar Pradesh and Jharkhand have promised to increase their percentage share of solar based electricity to 1% by financial year 2011-2012. Karnataka has already approved 129 MWp solar based grid connected power generation of which 6 MWp have been commissioned by November 30th, 2010 [41] . Rajasthan having the highest share of solar power projects in the country launched a Solar Energy Policy in 2010, which aims for 10000- 12000 MWp of solar power generation by 2022 coinciding with the third phase of the NSM [42]. Andhra Pradesh has sanctioned nearly 11 MWp of standalone off grid SPPs in the state expected to be commissioned by mid 2011 [43]. Uttar Pradesh has approved 32.5 MW SPV based power projects in the state [44] while the state of Jammu Kashmir also launched a solar energy policy. India’s progress in solar power generation after the launch of NSM is definitely encouraging. Considering the immense potential of solar resources in the country, the generation capacity could surpass the highest targets set by the NSM under proper mechanisms.
Apart from the power generation potential of SPPs, their environmental attribute could be quantified with the introduction of Renewable Energy Certificates (RECs). The solar power purchase obligation envisaged by the NSM, requires states to buy 0.25 % solar based power in its first phase which will be scaled up to 3% by 2022 [9] . This opens up new vistas for the Clean Development Mechanism (CDM) by interstate sale and purchase of solar specific RECs. The average emission from the regional power grid according to the 2008-09 baseline database of the Central Electricity Authority (CEA) is 860 gCO2/kWh [45]. Studies show that Si SPV based power generation emits 35-40 gCO2/kWh equivalent during its life cycle, which is phenomenally lower than the fossil fuel based plants [46]. The assumed Si SPV based output of 379 billion units generated from 0.1% land area of the identified solar hotspots, can offset more than 300 mt CO2 per year. CSP can also offset high amounts of emission by replacing the fossil fuel based conventional power plants. In the international level, this adds to India’s efforts in mitigating global warming.
Table 5: Area of barren or unculturable land in representative states of identified solar hotspots in India
| State/Union Territory | Total area | Barren or unculturable land | |
| (1000 ha) | (1000 ha) | % | |
| Andhra Pradesh | 27505 | 2056 | 7 |
| Bihar | 9360 | 432 | 5 |
| Chhattisgarh | 13790 | 308 | 2 |
| Goa | 361 | 0 | 0 |
| Gujarat | 18866 | 2595 | 14 |
| Haryana | 4371 | 103 | 2 |
| Himachal Pradesh | 4548 | 656 | 14 |
| Jammu Kashmir | 3781 | 288 | 8 |
| Karnataka | 19050 | 788 | 4 |
| Kerala | 3886 | 25 | 1 |
| Madhya Pradesh | 30756 | 1351 | 4 |
| Maharashtra | 30758 | 1718 | 6 |
| Punjab | 5033 | 24 | 0 |
| Rajasthan | 34270 | 2295 | 7 |
| Sikkim | 723 | 107 | 15 |
| Tamil Nadu | 13027 | 492 | 4 |
| Uttarakhand | 5673 | 224 | 4 |
| Uttar Pradesh | 24170 | 507 | 2 |
| West Bengal | 8684 | 21 | 0 |
| Chandigarh | 7 | 0 | 0 |
| Delhi | 147 | 16 | 11 |
Organizational aspects of solar power generation in India
Dissemination of SPV and CSP technologies for power generation needs detailed understanding of the organizational structure and market conditions. Capital grant is a major policy instrument of the Indian government with respect to the off-grid renewable energy projects. Rural village electrification envisages decentralized and distributed systems with thrust on renewable energy sources providing capital subsidies. There is a Central Financial Assistance (CFA) of Rs.70-90/Watt (depending on battery backup) or 30% of the project cost whichever is lower for small scale SPV applications. The government has promised a subsidy of up to Rs. 100/Watt (to a maximum of 40% of the cost of system) for non-profit making bodies for installations of 25-100 kW capacity [7]. The Indian government’s policy measure for grid-connected systems encourages competition and efficiency through Generation Based Incentives (GBI). The incentive for SPV is Rs 12/kWh and CSP is Rs 10/kWh for a total of 50 MWp projects on first come first serve basis. An individual power developer can avail generation based incentive for a minimum of 1 MWp at a single location and maximum of 5MWp for a maximum of 10 years [48]. State level policies also offer incentives for solar power production upto 25 years or life of the plant whichever is earlier.
Fiscal and financial incentives like tax holiday, tax free dividend, abolition of excise duty to investors encourage further investment. Institutional support has been observed to be a major factor for sustaining new technologies while strengthening of R&D and opening up of a local free market need priority rather than subsidy based incentives [23]. Major developing economies like China have realized the importance of R&D so as to bring grid parity for solar based power generation [22]. Since demand for skilled resource persons for promotion, installation and maintenance of solar power systems are on the rise, India needs to strengthen its training institutions with world class infrastructure.
| * Address for Correspondence: | |
|
Dr. T.V. Ramachandra Energy & Wetlands Research Group, Centre for Ecological Sciences, Indian Institute of Science, Bangalore – 560 012, INDIA. Tel : 91-80-23600985 / 22932506 / 22933099, Fax : 91-80-23601428 / 23600085 / 23600683 [CES-TVR] E-mail : cestvr@ces.iisc.ac.in, energy@ces.iisc.ac.in, Web : http://wgbis.ces.iisc.ac.in/energy |
|
| l | l | l | l | l | l | l | l | l |