 |
Hotspots of solar potential in India
T V Ramachandra1,2,3,* Rishabh Jain1 Gautham Krishnadas1
|
 |
1 Energy & Wetlands Research Group, Center for Ecological Sciences [CES],
2 Centre for Sustainable Technologies (astra),
3 Centre for infrastructure, Sustainable Transportation and Urban Planning [CiSTUP],
Indian Institute of Science, Bangalore, Karnataka, 560 012, India
INTRODUCTION
Life on earth is heliocentric as most of its energy is derived from the sun. Imminent climatic changes and the demand for clean energy sources have induced significant global interest in solar energy. It has been observed that, solar as viable alternative for power generation among the available clean energy sources has the highest global warming mitigation potential [1].
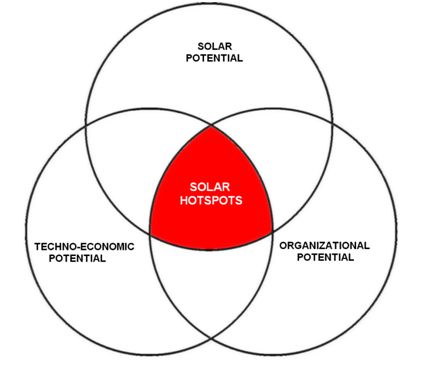
Solar energy incident on the earth’s surface, also called as insolation primarily depends on parameters like geographic location, earth-sun movements, tilt of the earth’s rotational axis and atmospheric attenuation due to suspended particles. The intensity of insolation quantifies the solar resource potential or availability of a region [2]. Solar energy based applications like Solar Photovoltaic (SPV) and Concentrated Solar Power (CSP) systems are limited to utilizing solar radiation wavelengths between 0.29-5.5 μm since a major part of the spectrum gets attenuated in other wavelengths due to either absorption or scattering in the atmosphere en route the earth’s surface. The sporadic nature of insolation due to its dependence on daily, seasonal, annual and topographic variations insists efficient design of SPV and CSP based solar power generation, conversion, storage and distribution [3]. At the confluence of solar resource potential and technologies like SPV and CSP, certain techno-economic and organizational barriers come into play and influence the implementation and management of these technologies. Solar hotspots are the regions characterized by an exceptional solar power potential suitable for decentralized commercial exploitation of energy with the favorable techno-economic prospects and organizational infrastructure support to augment solar based power generation in a country as visualized in Figure 1.

Figure 1: Diagrammatic representation of the solar hotspots
Need to identify solar hotspots in India
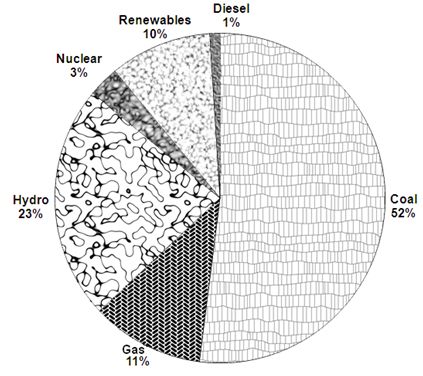
Today a low-carbon energy transition at varying rates has been noticed in both the poor as well as rich countries. India has the second highest population in the world with an escalating energy demand. Electricity meets a major portion of this energy demand and is notably related to the socioeconomic progress of the country which is growing at a rate of 8%. The Compound Annual Growth Rate (CAGR) of power generation in India since 2005 is 5.2% while there was a peak shortage of 12.7% (over 15 GW) and average Transmission and Distribution (T&D) loss of 27.2 % recorded during 2009-2010 [4].Unfortunately, over 400 million people do not have access to electricity and nearly 84740 un-electrified villages (14.3%) in the country, calling for intensive decentralized and efficient power generation [5]. The Integrated Energy Policy (IEPR 2006) in India has envisaged more than 800000 MW (Megawatts) by 2032 which is 5 times the existing power generation capacity [6]. The scarce fossil fuel based centralized capacity addition is expected to be further expensive, inefficient, polluting and unsustainable. Though mega hydro projects share 23% of the generation capacity, further addition would mean increased environmental disturbance. Nuclear energy is vital but hazardous for environment and national security. Renewable sources contribute only 10% to the nation’s power basket where coal is the dominant source (Figure 2). Currently India is ranked fifth in the world with 15691.4 MW grid-connected and 367.9 MW off-grid renewable energy based power capacity, hinting at a slow clean power transition compared to other developing economies like China [7]. By and large, it is imperative to boost our renewable energy based power generation capacity, especially through solar.
Although India is one of the best recipients of solar energy due to its favorable location in the solar belt (40°S to 40°N), a meager aggregate of 66 MWp (Megawatt peak) solar applications (80 % of which are solar lanterns, home/street lighting systems and solar water pumps) are installed in the country. This includes a total of 12.28 MWp grid connected and 2.92 MWp off grid Solar Power Plants (SSPs) [8]. The National Solar Mission (NSM) launched in January 2010 has given a great boost to the solar scenario in the country. Table 1 shows the targets set by the ‘Solar India’ mission. It is imperative to identify the solar hotspots in the country to achieve the ambitious target of 2000 MW off-grid and 22000 MW grid-connected solar generation by 2022 and even higher capacities beyond that time-frame. The identification of hotspots of solar potential hasten the penetration of SPV and CSP based off-grid and grid-connected SPPs, encourage decentralized power generation with the reduced transmission and distribution (T&D) losses while meeting a major part of the country’s energy demand. These regions help attract investment, generate employment, abate Green-house Gas (GHG) emissions and realize a sustainable mechanism of power generation. An initial step towards achieving the goal of a ‘Solar India’ is to assess the solar resource potential and its variability in the country.

Figure 2: Share of different sources in installed power generation capacity in India
Table 1: Targets set by the National Solar Mission
| Application Segment | Target for phase I (2010-2013) |
Target for phase II (2013-2017) |
Target for phase III (2017-2022) |
|
| 1. | Solar Collectors (million m2) |
7 | 15 | 20 |
| 2. | Off Grid Solar applications (MW) | 200 | 1,000 | 2,000 |
| 3. | Utility grid power (including roof top) (MW) | 1,000 - 2,000 | 4,000 - 10,000 | 20,000 |
Solar resource potential assessment
Solar resource potential of a region has been assessed in a multitude of ways through long term pyranometric insolation data from surface solar radiation. India with a land area of 3.28 million km2 has 45 solar radiation stations. As the region of interest expands in geographical area, sparse and expensive pyranometric network fails to capture its solar resource variability. Also, these data are often prone to errors due to calibration drift, manual data collection, soiling of sensors, non-standardization and inconsistency of measuring instruments [10]. Data sparseness is often compensated by interpolation, extrapolation and modeling methods based on widely available geophysical and meteorological data. Models based on meteorological satellites which provide reliable insolation data at higher spatial and temporal resolutions are widely recognized. These models are proven to show lower Root Mean Square Error (RMSE) compared to interpolation and extrapolation models for distances beyond 34 km [11]. Hence they are suitable for solar resource potential assessment of larger spatial scales. Nevertheless, surface based pyranometric data remain a good source for validation purposes even today.
Quantification of insolation based on satellite data through different modeling techniques have been reviewed earlier [12] including country level solar resource potential assessments. For example, the solar potential of Kampuchea was estimated based on a statistical model with the visible and infrared images obtained from Japanese Stationary Meteorological Satellite GMS-3 along with ground based regression parameters [13]. The solar potential of Pakistan is assessed by employing a physical model on Geostationary Operational Environmental Satellite (GOES) INSAT images [14] and Chile based on a physical model applied to the GOES-8 and GOES-12 images [15]. Daily Global insolation in Brazil for different clear sky conditions was assessed based on a statistical model on images from a GOES satellite instrument [16]. For the same region, the Global, Direct and Diffuse solar radiation have been assessed based on the 10 km X 10 km satellite derived Solar and Wind Energy Resource Assessment (SWERA) project database [17]. Most of these studies when validated with surface data showed Root Mean Square Error (RMSE) in the range of 5-15%. RMSE for different satellite models have been found to be within 20% for daily values and 10% for hourly values [18].
Estimation of insolation and dissemination of large scale solar power applications have been studied based on different methodologies. The potential of grid connected SPV systems in Bangladesh was estimated at 14 sites in the country and observed a generation capacity of 50174 MW with reduction in annual GHG emissions of 1423 tons using National Aeronautics and Space Administration (NASA) Surface Meteorology and Solar Energy (SSE) dataset and HOMER optimization software [19]. The power generation potential of High Concentration Photovoltaics (HCPV) in Brazil was assessed using the SWERA insolation database [20] . The Direct Normal Irradiance (Direct insolation) in Turkey based on the NASA SSE dataset was done so as to estimate the viability of CSP for power generation [21] . The Western and Southeastern parts of the country were found to have high solar resource potential as well as large area of waste lands for CSP based power generation. The study also discusses the technical and organizational aspects of CSP based power generation. Similar studies in China [22] and many other parts of the world [23] have also been observed. The solar resource potential assessment efforts in the federal state of Karnataka in India [24][25] and the consequent megawatt capacity SPPs that were installed [26], incite further interest in identifying the solar hotspots in India, assessing relevant solar power technologies and prospects of dissemination.
| * Address for Correspondence: | |
|
Dr. T.V. Ramachandra Energy & Wetlands Research Group, Centre for Ecological Sciences, Indian Institute of Science, Bangalore – 560 012, INDIA. Tel : 91-80-23600985 / 22932506 / 22933099, Fax : 91-80-23601428 / 23600085 / 23600683 [CES-TVR] E-mail : cestvr@ces.iisc.ac.in, energy@ces.iisc.ac.in, Web : http://wgbis.ces.iisc.ac.in/energy |
|
| l | l | l | l | l | l | l | l | l |