1. Change in properties of waste
The initial pH of 4.06 in waste samples, suggests the initiation of degradation. Fresh organic fraction of MSW will have pH in range of 6-7 (Bizukojc et al., 2003). The initial temperature was 28°C and during the degradation, temperature in the anaerobic chamber was 24.5°C - 26 °C in all samples. Anaerobic digestion occur under two temperature regimes namely, mesophilic (between 20-45°C usually 35°C) and thermophilic (between 50-75 °C usually 55 ° C). Sample temperature was found to range from 25-29.5°C (mostly above 28°C) on all sampling days under aerobic conditions, this is because the heat formed was easily getting dissipated into the atmosphere as the sample quantity was small and kept open. Total solid content of waste was decreasing with time (Table 6). Percentage of carbon in the preliminary sample was about 42% which shows highest among the three elements with nitrogen 1% and hydrogen 6%. Results of CHN analysis carried on different sampling days shows that carbon vary from 46-49% in aerobic, hydrogen 6-7% and nitrogen 1-2-%. At lab scale total wet waste reduction in aerobic degradation was found to be 25 times faster than anaerobic degradation.
Table 6:
Change in total solids of waste (%)
| Sl. No. |
Days |
Aerobic |
Anaerobic |
| 1 |
3 |
93.45 |
93.07 |
| 2 |
6 |
92.74 |
92.99 |
| 3 |
9 |
87.67 |
93.88 |
| 4 |
12 |
91.92 |
86.80 |
| 5 |
17 |
93.25 |
86.66 |
2. Emission factor (based on the experiment)
Total gas produced from 30 days of continuous degradation of 1 kg of waste under anaerobic condition is 101.528 ml, which consist of 17% of methane and 83% of carbon dioxide (Table 7). Emission factor for gaseous emissions of methane and carbon dioxide are 0.013gm/kg and 0.165gm/kg respectively (As gaseous volume was in milliliter, it is converted into gaseous mass using gas volume and the respective density at standard temperature and pressure (Density = Mass/Volume, density of methane and carbon dioxide as 0.716g/l and 1.965g/l, respectively). Total daily emission from organic fraction of solid waste degradation in Bangalore is 31.06 kg and 403.52 kg of methane and carbon dioxide, respectively.
Table 7: Emission from anaerobic degradation of waste (in 30 days)
| Chamber |
Waste quantity (kg) |
CH4 (ml/kg) |
CO2 (ml/kg) |
Total (ml/kg) |
| C1 |
1 |
22.527 |
134.379 |
156.906 |
| C2 |
1 |
12.875 |
33.275 |
46.150 |
| Avg |
1 |
17.701 |
83.827 |
101.528 |
3. Comparison of emission computed using different method of estimation
3.1 Determination of emission by Mass balance approach: The elemental composition of the sample was found to be comparable with the literature. According to Reinhart, (2004), the elemental composition of sample was 1.30, 0.07 and 0.17 of Carbon, Nitrogen and Hydrogen, respectively. From stoichiometric calculation it can be seen that 1.1978 moles of methane and 1.2143 moles of carbon dioxide is emitted from 1 mole of analysed sample (C2.98H0.462O1.02N0.099) under anaerobic condition. Thus, 0.355 kg of CH4 and 0.991 kg of CO2 are emitted from 1 kg of waste sample. Similarly, under aerobic condition carbon dioxide emission was found to be about 2.431 kg/kg of waste. So, total emission from Bangalore solid waste using mass balance approach in anaerobic condition is 869.75 t/day of methane and 5955.95 t/day of carbon dioxide.
3.2 Default methodology: In the estimation of methane emission potential by IPCC default method, the amount of solid wastes that is available for anaerobic degradation and methane generation was assumed as 100%. The result shows that there was about 87.32 t/day of methane potential for the city, which is less than estimated emission from mass balance approach. If we compare methane emission from per kg of organic waste, then through this method estimated methane emission will be 0.036 kg/kg of waste.
3.3 Experimental estimation method: In contrast to the theoretical estimation method in which methane emission potential is calculated based on the amount of wastes being disposed every day. The theoretical methods overestimate emission values, necessitating quantification of methane emission at lab scale. Total methane emission from Bangalore solid waste using experimental emission factor is 31.06 kg/day, whereas carbon dioxide is 403.52 kg/day. Results are much lower than theoretically estimated values as these methods assume that all potential methane are released as it comes in contact with the environment. Also, quantified values are lower than the emission estimated at landfills in Chennai by Jha et al., (2008). Landfills with mature wastes enhance the methane emissions from fresh waste under anaerobic conditions.
Table 8 shows a comparison of emission factor computed in different methodologies. It is clear from comparison of emission computed from different method of estimation that theoretical estimation method over estimate the emission from waste in comparison to lab estimated or field estimated values. Still further more accurate estimation is possible using accurate quantity of waste goes for different treatment methods and also knowing emission from open dump and unscientific disposal at landfill site at more controlled conditions.
Table 8:
Comparison of emission factors
| Gaseous emission |
Mass balance approach (kg/kg) |
Default methodology (kg/kg) |
Experimental estimation method (gm/kg) |
| CH4 |
0.355 |
0.036 |
0.013 |
| CO2 |
0.991 |
- |
0.165 |
Note: Default method of IPCC accounts only CH4
4. Wardwise CF of solid waste using experimental value
Everyday Bangalore generates around 3500 tones of municipal solid waste. In that 55% is contributed from household waste (Table 2) with per capita generation of 0.35 kg/day of domestic waste.
4.1 Carbon footprint of municipal solid waste: Estimated methane and carbon dioxide emission from representative waste samples were used for computing annual emission from solid waste. Total ward-wise organic waste generated is 2044 t/day. Methane and carbon dioxide emissions are 19.13 and 242.83 kg/day. Methane emission values were multiplied with 21 to compute the carbon footprint of waste. Annual carbon footprint of municipal solid waste is 644.61 kg/day of CO2 equivalent assuming that total waste generated in city is reaching to waste disposal site without any treatment. City wards where population is less dense has less emission than densely populated ward (Fig 5). Most of the core city wards are densely populated, so their carbon footprint potential is more than other wards of the city. Fig 2 illustrates the pattern of open dumping, which are prevalent at outskirts.
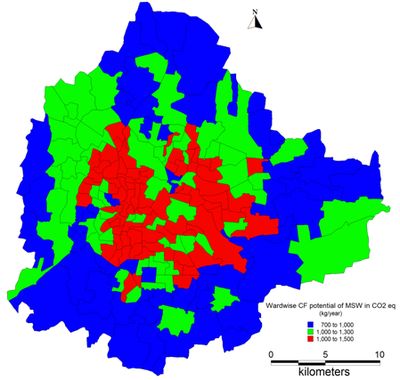
Fig 5: Carbon footprint of municipal solid waste
4.2 Carbon footprint of open dumps – unauthorized locations: Earlier study reports the existence of 60 open dumpsites around the city (Lakshmikantha, 2006). Recent study (field work conducted in 2010) shows a considerable increase in open dumps across the city and outskirts. Quantification of dumps shows that there are 270 dumps (Fig 2) distributed in all four zones of the city. Waste quantity is determined through the visual estimates at each location (supplemented by photographs of each site). A total of about 83557 t wastes is scattered in and around Bangalore city. Average life of open dump as two months and based on field investigations during 2011 and 2012, about 40% of daily waste is being dumped at unauthorized locations (Fig 2). Fig 6 illustrates the carbon footprint of unauthorized dumps and authorized dumps (with minimal or no treatment) based on the quantity (at authorized, unauthorized dumps) and emission factor.
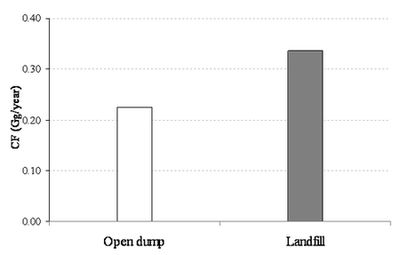
Fig 6: Annual carbon footprint considering open dumpsites
5. Characteristics of composting and its emission potential
The percentage of carbon dioxide and methane emitted from compost plant is far less than that emitted from chambers under anaerobic condition. Among the three compost samples, sample from plant (with residence time of 10 days) show higher gas emission (as it is the new pit among the three) of 0.0000205 ml methane and 0.0002168 ml carbon dioxide (Table 9). The sample from compost of 60 days has relatively lower gas emission, due to the presence of mature waste. BMP analysis further corroborate as there is no gas production from compost samples.
Table 9:
Emissions from air samples collected near compost plant
Plant
(residence time of waste). |
Sample vol. (cm3) |
CH4 (%) |
CO2 (%) |
CH4
ml/cm3 |
CO2
ml/cm3 |
60 days |
5722.65 |
0.02 |
0.23 |
0.0000034 |
0.0000401 |
30 days |
1130.4 |
0.018 |
0.144 |
0.0000159 |
0.0001273 |
10 days |
1844.7 |
0.038 |
0.4 |
0.0000205 |
0.0002168 |
