There are a number of methods to estimate carbon footprint in terms of methane emission from solid waste disposal methods. These methods are broadly classified into i) theoretical estimation and ii) experimental method. Accuracy of theoretical estimation depends on availability of data. Usually, available theoretical estimation methods are; mass balance approach, default methodology (using degradable organic carbon content), theoretical first order kinetics and triangular method (IPCC, 1996; Kumar et al., 2004; Garg et al., 2006; Sharma et al., 2006).
1. Theoretical estimation method
1.1 Mass balance approach: Mass balance approach is simplest level of emission estimation and generally discouraged to use as it gives high estimation for emission. This method does not include any factor and does not distinguish between various types of disposal sites. In this approach theoretical emission is calculated usingstochiometric using equations as per Tchobanoglous et al., (1993). Equation for aerobic and anaerobic degradations considering complete degradation of waste is given by equations 1 and 2.
C2.98H0.462O1.02N0.099 + 2.659 O2→2.98 CO2 + 0.0825 H2O+ 0.099 NH3 .... (1)
C2.98H0.462O1.02N0.099 +2.4287 H2O→1.1978 CH4 + 1.2143 CO2 + 0.099NH3 .(2)
1.2 Default methodology: This approach of emission estimation considers the degradable organic carbon content of MSW (equation 3) and does not include changes in conversion of carbon to methane emission with time (Bingemer and Crutzen, 1987; Revised IPCC 1996).
CH4 (Gg/yr) = MSWT×MSWF×MCF×DOC×DOCF×F×(16/12-R)×(1-OX) (3)
Where, MSWT = Total municipal solid waste generated, MSWF = Fraction of MSW disposed of at the disposal sites (0.6), MCF = Methane correction factor (0.6), DOC = Degradable organic carbon (0.18), DOCF = Fraction of DOC dissimilated (0.77), F = Fraction of methane in LFG (0.5), R = Recovery of LFG (0), OX = Oxidation factor (0).
1.3 First order kinetics: First order kinetics considers availability of time series waste disposal data and other detailed informations for disposal site to compute the methane emission as the degradable organic components degrade slowly and methane is emitted over a long period.
1.4 Triangular method: Triangular method considers time dependent release of gaseous emission based on first order decay. Total gaseous yield is computed for the organic fraction considering; rapidly biodegradable waste and slowly biodegradable waste.. This requires extensive waste characterization and quantification is required at waste disposal site (Kumar et al., 2004).
2. Experimental estimation method
Methane and carbon dioxide are measured and quantified at laboratory scale through waste degradation under aerobic and anaerobic conditions. This process involved, design of chamber, monitoring and quantification of emissions as shown in figure 3.
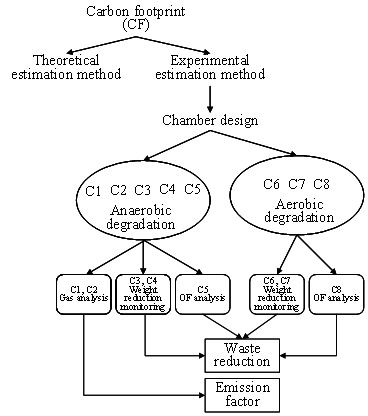
Fig 3: Flow chart of experimental setup
2.1 Design of chamber: The gas analysis chamber was made up of glass with diameter of 7 cm and 20cm height. Shape of chamber was conical with a gas collection apparatus. Gas collection apparatus was round in shape with seven openings for gas collection (Figure 4.1). These openings were closed with rubber lead. In anaerobic condition collection openings were closed whereas for aerobic condition openings were left open. There were 8 chambers; C1, C2, C3, C4, C5, C6, C7 and C8. Chamber C1, C2, C3, C4 and C5 were maintained under anaerobic condition whereas chamber C6, C7 and C8 are maintained in aerobic conditions without any external aeration. Chamber C1 and C2 are used for gas analysis whereas C3, C4, C6 and C7 are used to monitor weight reduction with time and C8 and C5 is used for organic fraction (OF) analysis. Anaerobic chambers were covered with paper and kept away from sunlight to give optimum conditions of anaerobic degradation. In aerobic chambers, lead was open to provide conditions similar to open dumpsites.
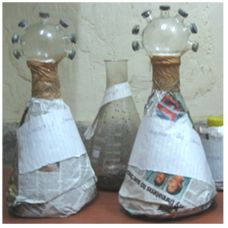
Fig 4.1: Gas collection chamber
2.2 Monitoring duration for waste degradation: Experiment was started with 200g of sample kept in each of the eight chambers (Figure 4.2). Degrading samples were subjected to organic fraction analysis, gas analysis and weight reduction study. For organic fraction analysis, waste samples were collected on 0, 3, 6, 9, 12 and 17th day (Chanakya et al., 2007).
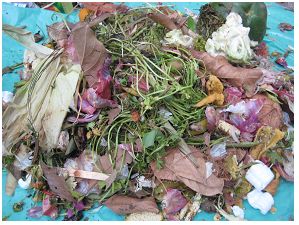
Figure 4.2: Waste sample used for experiment
2.3 Organic fraction analysis: In organic fraction analysis parameters like temperature, moisture content, total solids, volatile solids Carbon, hydrogen and nitrogen were measured.
pH: 3g of dried sample was added with 15ml of distilled water was shake for 24hrs to find out pH with pH meter.
Moisture content: To obtain dry mass, the solid waste material was weighed (W1) and then dried (W2) in oven at 105°C till the mass of the dried material became constant. The moisture content is computed by equation 4.
% moisture content = ((W1-W2)/W1 × 100) … … (4)
Total solids: 5g of sample was weighed (W2) in an empty crucible (W1) and dried in an oven maintained at 105°C for 24hrs (W3). Percent TS was calculated using equation 5.
% TS = ((W3-W1)/(W2-W1) × 100) …….. (5)
Volatile solids (VS): This was measured in accordance with APHA (1975). 2-3g of oven dried sample was weighed (B) in an empty crucible (A) and heated to 550°C for 1hr in the muffle furnace (C). Percent VS was calculated using equation 6.
% VS = ((B-C) /(B-A) × 100) ………. (6)
CHN analysis: Carbon, hydrogen and nitrogen was analysed with the help of CHN analyzer (LECO elemental analyser). After finding the CHN of the sample the elemental composition of waste under the study was determined with the help of equation given by Tchobanoglous et al. (1993). Elemental composition was used for determining the theoretical estimation (mass balance approach) of gaseous emission during waste degradation in aerobic and anaerobic process.
2.4 Gas analysis - Gaseous composition: Gas analysis was carried out using a gas chromatograph (ProGC, Mayura Analytical Pvt.Ltd., India) equipped with flame ionization and thermal conductivity detectors. All hydrocarbons are separated by Heysep-R column having mesh size 80/100 and dimensions 2m × 1/8in. Detection is done by FID detector. Analysis of gas was done on every fourth day. After 15 days, with the decrease of gas production with time, samples were collected at the gap of 7 days. Gas was collected in 10ml syringe and then subjected to Gas chromatography.
Quantification of gaseous emission: Quantification of gaseous emission was done using water displacement method. In water displacement method, samples were connected through burette filled with potassium dichromate solution. As gas enters and passes through the burette it displaces filled potassium dichromate solution in the burette. The volume of solution displaced is equal to the volume of gas produced from waste samples. After 30th day of the experiment volume of gas was measured in chambers.
2.5 Weight reduction study: Chamber samples were weighed in weighing balance on 0, 3, 6, 9, 12, 17 and 30th day to check subsequent reduction in total waste quantity kept on 0th day.
Analysis of composting process: Composting is an aerobic process of organic waste treatment. During composting process waste gets converted in compost or manure. Particularly, carbon content of waste gets converted to humus or emitted in the environment as carbon dioxide. To assess emissions from composting, experiment was carried out in the compost unit which is successfully implemented and managed at Vellore city. City municipal waste in Vellore is being treated since 2009 through aerobic option (compost). There were 17 working compost pits for residential waste. Gas samples were collected (Figure 4.3) from compost process happening in Vellore city. Compost chambers filled at different time interval were selected to see the difference in emission and other properties as these pits were filled in different months and are at different stages of degradation. These experiments were done during 2010 (January to May) and also verified recently (June 2013).
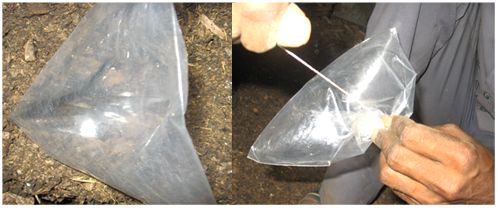
Fig 4.3: Gas collection from compost plant
