|
Results and Discussions
Algae grow at a faster rate with the ability to accumulate substantial quantities of lipid25. In the present study the algae isolated from the wastewaters were selected on the basis of their predominance in wastewaters across seasons. There have been many studies for screening of oleaginous algae13 that are being isolated and characterized under controlled and outdoor culture conditions5. These algae grow copiously25 with adequate nutrient supply and under suitable conditions.
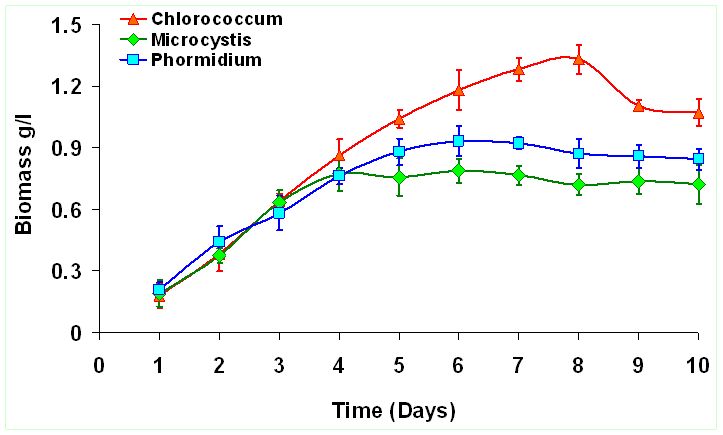
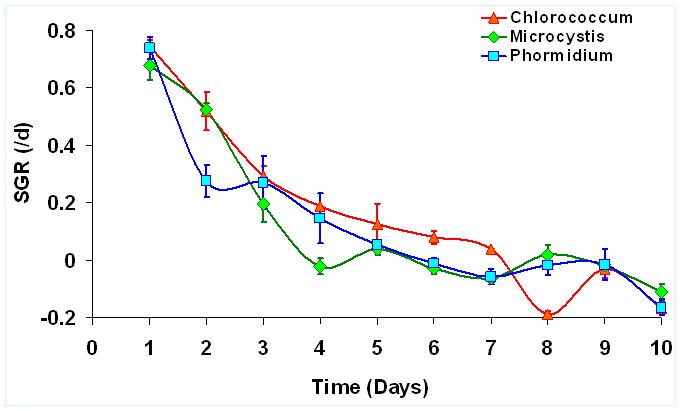
The peak growth of Chlorococcum sp. occours on the 8th day indicating enhanced growth rate corresponding to the time of incubation. Similarly Microcystis sp. reached its peak growth on 4th day and Phormidium sp. on 6th day indicating lack of lag phase. This indicates their capabilities to acclimatize wastewater conditions and grow exponentially during the 9 days growth experiment. Figure 1 illustrates the growth curve of the selected algae from wastewaters. Biomass densities (dry wt.L-1) of Chlorococcum sp. (1.33±0.072 gL-1) is about 1.69 times higher than Microcystis sp. (0.78±0.059 gL-1) and about 1.43 times higher than Phormidium sp. (0.93±0.073 gL-1). However longer growth period was observed in case of Chlorococcum sp. compared to other two species. The specific growth rate (SGR) was higher during the initial period i.e. first 3 days of the culture experiment (Figure 2). Chlororcoccum sp. attained the highest SGR of 0.75 d-1 with a mean SGR of 0.161 d-1. Microcystis sp. achieved the highest SGR of 0.68 d-1 with a mean SGR of 0.122 d-1. In case of Phormidium sp. the highest SGR was observed to be 0.74 d-1 with a mean SGR of 0.123 d-1. Chlororcoccum sp. attained a mean biomass productivity of 0.09 gL-1d-1 during the culture experiment. Under similar conditions Microcystis sp. and Phormidium sp. attained a biomass productivity of 0.064 gL-1d-1 and 0.072 gL-1d-1.
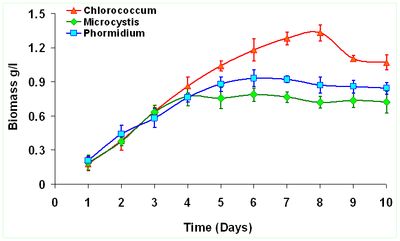
Figure 1. Growth Curves of Algal sp.
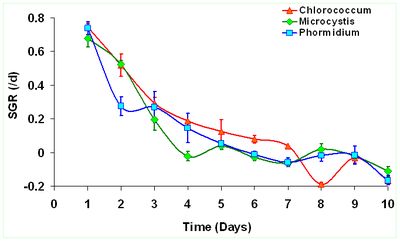
Figure 2. Variations in the specific growth rates (SGR) d-1 of the algal species
After the exponential growth period, the algal sp. was harvested and the biomass was used for oil extraction. Among the isolated algal sp., Chlororcoccum sp. showed the highest lipid content of 30.55±2.65 %. Microcystis sp. showed the lowest lipid content of 8.88±1.78 % and Phormidium sp. showed a moderate lipid content of 18.66±2.34 %, albeit producing a higher biomass in the initial phases. Under stressful environments or during unfavorable conditions algae tend to slow down their cell division and quickly utilize available carbon for synthesizing high energy density compounds like lipids to combat or adjust to the limited nutrient conditions7,22. In the present study an increased lipid accumulation have been observed during the stationary stages of the growth which is in accordance with the earlier studies8. N limitation results in lower photosynthetic C fixation for proteins synthesis evident from the carbohydrate to amide ratio (discussed later) consequently stocking carbon in the form of lipids or carbohydrates, depending on the species 11.
The lipid content reported earlier are in the range of 20-50%25,26, however some oleaginous algae can have very high lipid content >70%8. Growth of Auxenchlorella protothecides in concentrated sewage showed a lipid accumulation of 32 %19. Similarly 30% lipid accumulation was observed in Scenedesmus sp. growing in secondary wastewaters5. Studies on green algae growing in dairy and municipal wastewaters showed a maximum lipid content of 29%27. Studies on Chlorella vulgaris grown in artificial wastewaters showed a higher lipid accumulation of 37%5.
Numerous studies have used techniques like chromatography and fluorescent stain’s like NILE RED for determining lipid accumulation28, but this method has disadvantages in terms of time and cost for processing, accuracy, etc. Analysis through FTIR is much easier and advantageous for the measurement of biochemical composition of algal cells and lipid accumulation studies. A number of studies have reported good correlation of the compositions through the measurement of band intensities, when compared with advanced methods21,29. Many algal sp. have been dealt with FTIR spectroscopy for compositional quantification including Chaetoceros muellerii22; Pediastrum sp.30; Scenedesmus sp., Phormidium sp., Nitzschia sp. and Sphaerocystis sp.29; Microcystis aeruginosa, Croococcus minutus, Nostoc sp., Cyclotella meneghiniana, and Phaeodactylum tricornutum21; Chlamydomonas reinhardtii and Scenedesmus subspicatus7; Dunaliella tertiolecta and Thalassiosira pseudonana31.
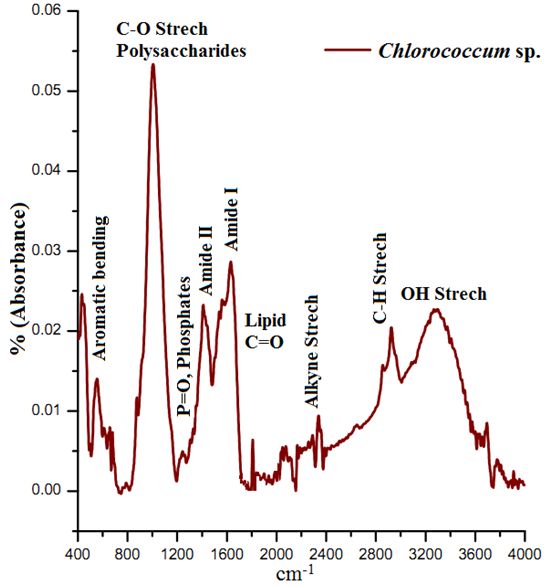
The ATR–FTIR characteristic spectral signatures (4000 to 400 cm-1) of lipids from algal species Chlorococcum sp., Microsystis sp. and Phormidium sp. compared with the standard coconut oil and are elucidated in Figure 3. The absorption bands in the FTIR spectrum is indicative of the presence of hydroxyl (-OH), carbonyl (C=O), aromatic C, alkane, alkene and amide groups in Chlorococcum sp., Microcystis sp. and Phormidium sp. The bands at 3299, 3345, and 3279 cm-1 are due to the O–H stretching vibrations that have been observed in the Chlorococcum sp., Microcystis sp. and Phormidium sp. However no prominent bands were observed in the standard Lipid due to absence of OH species (Figure 3, top). A weak band with a small peak at 2923 cm-1 can be attributed to asymmetric C-H vibrations mostly due to methylene groups of lipids (Figure 3 and Figure 4). The bands noticed at 2855 cm-1 is assigned to symmetric C-H vibrations in Chlorococcum sp. and other species that is due to stretching of methyl groups of lipids. The bands at 2338 cm-1 corresponds to CO2 vibrations. The prominent bands present ~1740–1640 cm-1 are due to the presence of C=O of esters or fatty acids (Figure 4). The bands following these C=O peaks are the Amide I and II mostly present in 1630 and 1574 cm-1 that is due to the presence of C=O groups on proteins, C≡N bonds and C-H, N-H associated with proteins respectively. A small band at 1240 cm-1 can be assigned to P=O, Stretch by the Phospho-diester backbone present in nucleic acids (DNA and RNA). A prominent band at ~1000 cm-1 in the studied algal species is due to the C-O-C stretching in polysaccharides. Few small bands found ~800-550 cm-1 are attributed to Aromatic C-H bending. The characteristic lipid peak can be very distinctively visualized in the Coconut oil standard FTIR spectra at ~1700 cm-1 (Figure 4; top). The FTIR spectra of Chlorococcum sp. with different band assignments from 4000 to 400 cm-1 are depicted in Figure 4.
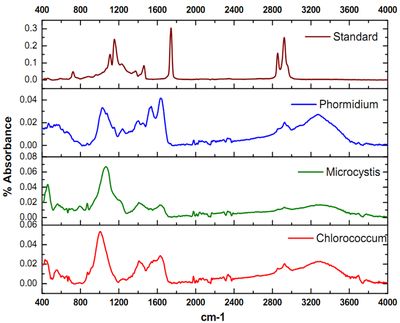
Figure 3. Comparative analysis of the FTIR Absorbance Spectra of Chlorococcum sp., Microcycstis sp., Phormidium sp. and Lipid standard (Coconut oil)
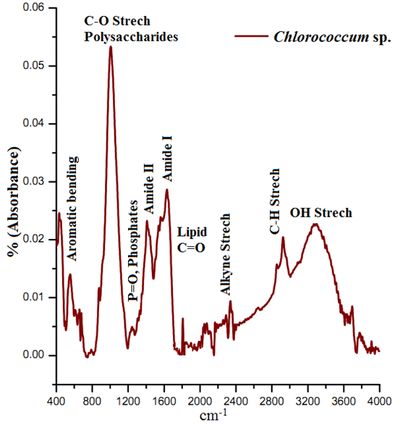
Figure 4. ATR-FTIR Spectra (Mid IR) Chlorococcum sp. with specific bands assignments
The ATR-FTIR spectra of the selected algalcellshowed 7 distinct absorption bands from the wave numbers ranging from 1800-800 cm-1 (Table 2). These bands were assigned to specific functional groups following biochemical standards and published literature21. The assignments of bands corresponding to the functional groups are provided in the Table 2. Out of all these bands four bands were most important for the study i.e. ~1740 cm-1 for ester/fatty acid, ~1655 cm-1 for proteins, ~1240 for phosphates and ~1150-950 cm-1 for carbohydrates (Figure 4). FTIR spectrogram of the algal species has a very specific spectral signature in terms of lipids and other biochemical compositions and indeed has a different figure-print for lipids in Chlorococcum sp. and the two other algal species. Figure 5a, b and c illustrates the changes in the FTIR spectra with the culture time from day 1 to day 10 for Chlorococcum sp., Microcystis sp. and Phormidium sp. respectively and the macromolecular compositions are depicted in Table 3. The compositional changes were monitored by the Carbohydrate/Amide (C/P), Lipid/Amide (L/P) and Lipid/Phosphates (L/Phos.) changes of algalsp as depicted in Figure 6a, b and c. The cultures experienced an increase in the L/P ratio. The FTIR assignments of bands to the spectra in case of the three selected algae showed significant variation in the carbohydrate, protein, lipid and phosphate contents (Figure 5a, b and c).
Table 2. FTIR Band Assignments for Algal species
| Band Assignments |
Functional groups |
| ~1740 cm-1 |
ν(C=O)stretching of ester groups, primarily from lipids and fatty acids |
| ~1655 cm-1 |
ν(C=O)stretching of amides from proteins (Amide I) |
| ~1545 cm-1 |
δ(N–H)bending of amides from proteins(Amide II) |
| ~1455 cm-1 |
δas(CH2) and δas(CH3) bending of methyl from proteins |
| ~1380 cm-1 |
δs(CH2) and δs(CH3) bending of methyl and νs(C–O) stretching of COO– |
| ~1240 cm-1 |
νas(>P=O) stretching, associated with phosphorus compounds |
| ~1000 cm-1 |
ν(C–O–C) stretching from polysaccharides |
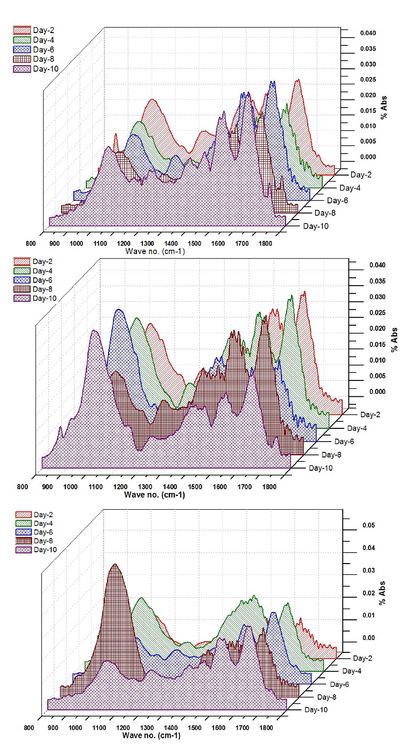
Figure 5. Transitions in the FT-IR spectra of a) Chlorococcum sp. b) Microcystis sp. and c) Phormidium sp. with culture time (10 days)
Table 3. Quantification of Carbohydrates, Proteins, Lipids and Phosphates (computed from the area under the curve after deconvulation and peak fitting) with errors and the strength of the peak fitting (R2)
|
Carbohydrates |
Err. |
R2 |
|
Proteins |
Err. |
R2 |
|
Lipids |
Err. |
R2 |
|
Phosphates |
Err. |
R2 |
| Chlorococcum |
|
|
|
|
|
|
|
|
|
|
|
|
|
|
|
| Day-2 |
2.10273 |
0.02803 |
0.98729 |
|
0.92444 |
0.01324 |
0.99647 |
|
0.06905 |
0.00272 |
0.99247 |
|
0.09788 |
0.00469 |
0.89549 |
| Day-4 |
1.78347 |
0.03772 |
0.95792 |
|
0.74985 |
0.003872 |
0.95991 |
|
0.01886 |
0.00299 |
0.6647 |
|
0.04807 |
0.00245 |
0.91545 |
| Day-6 |
1.34877 |
0.01488 |
0.99226 |
|
1.05672 |
0.0172 |
0.98667 |
|
0.02601 |
0.00138 |
0.96425 |
|
0.20876 |
0.00952 |
0.97132 |
| Day-8 |
0.89808 |
0.01513 |
0.97318 |
|
0.98259 |
0.02026 |
0.99167 |
|
0.14777 |
0.01001 |
0.95981 |
|
0.01047 |
0.00487 |
0.86248 |
| Day-10 |
0.85444 |
0.0134 |
0.97332 |
|
1.33956 |
0.02661 |
0.99398 |
|
0.23361 |
0.00741 |
0.98496 |
|
0.17146 |
0.0051 |
0.93052 |
|
|
|
|
|
|
|
|
|
|
|
|
|
|
|
|
| Microcystis |
|
|
|
|
|
|
|
|
|
|
|
|
|
|
|
| Day-2 |
2.85779 |
0.7171 |
0.94563 |
|
1.04433 |
0.02154 |
0.99203 |
|
0.01193 |
0.00118 |
0.85977 |
|
0.08041 |
0.00326 |
0.95497 |
| Day-4 |
3.55536 |
0.03666 |
0.97658 |
|
1.20784 |
0.02833 |
0.9902 |
|
0.1199 |
0.0017 |
0.72852 |
|
0.04533 |
0.00114 |
0.97882 |
| Day-6 |
3.99281 |
0.07561 |
0.98286 |
|
0.60306 |
0.03448 |
0.93997 |
|
0.18686 |
0.12457 |
0.70767 |
|
0.01854 |
0.03509 |
0.86142 |
| Day-8 |
1.81889 |
0.5583 |
0.93714 |
|
1.0800 |
0.03099 |
0.98502 |
|
0.02142 |
0.00291 |
0.75282 |
|
0.11025 |
0.00301 |
0.9726 |
| Day-10 |
3.41205 |
0.04504 |
0.98243 |
|
0.72644 |
0.01592 |
0.98892 |
|
0.24735 |
0.02517 |
0.98114 |
|
0.02814 |
0.00203 |
0.94441 |
|
|
|
|
|
|
|
|
|
|
|
|
|
|
|
|
| Phormidium |
|
|
|
|
|
|
|
|
|
|
|
|
|
|
| Day-2 |
1.90205 |
0.02457 |
0.98611 |
|
0.45911 |
0.0369 |
0.88593 |
|
0.02249 |
0.00235 |
0.59866 |
|
1.4538 |
0.29058 |
0.98422 |
| Day-4 |
3.7678 |
0.08206 |
0.97325 |
|
1.47444 |
0.09348 |
0.96545 |
|
0.02923 |
0.006168 |
0.89853 |
|
0.28932 |
0.03793 |
0.97508 |
| Day-6 |
2.4166 |
0.05875 |
0.94139 |
|
1.722587 |
0.07604 |
0.98314 |
|
0.11465 |
0.00399 |
0.99431 |
|
0.31169 |
0.02535 |
0.95079 |
| Day-8 |
7.37841 |
0.05158 |
0.99471 |
|
1.00221 |
0.05831 |
0.9467 |
|
0.03635 |
0.00457 |
0.54673 |
|
0.25534 |
0.00976 |
0.97158 |
| Day-10 |
2.73937 |
0.06364 |
0.94218 |
|
2.02027 |
0.09046 |
0.98187 |
|
0.14962 |
0.00646 |
0.99172 |
|
0.18143 |
0.00688 |
0.89957 |
|
|
|
|
|
|
|
|
|
|
|
|
|
|
|
|
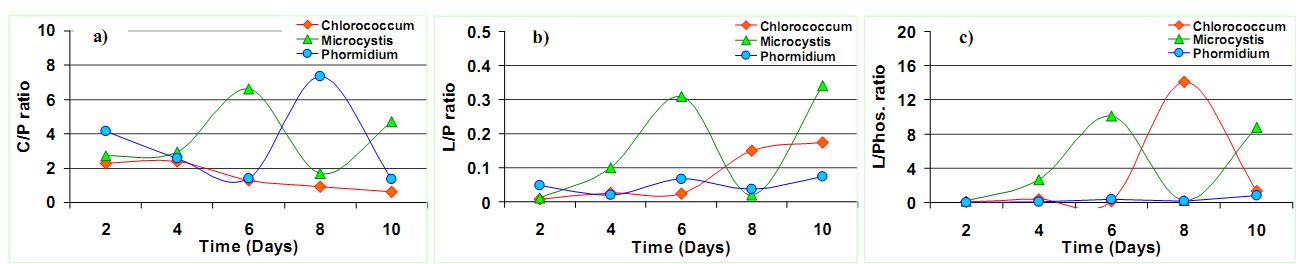
The ratio of Carbohydrate/Amide (C/P) showed a peak at the 6th day of the culture in case of Microcystis sp. and 8th day of the culture in case of Phormidium sp. (Figure 6a). This is indicative of the higher polysaccharides content in the biomass due to rapid TOC assimilation through heterotrophy11 from the 2nd to 6th and 8th day in the culture. The C/P ratio dropped down consistently in Chlorococcum sp., indicating C transformation from Carbohydrates to lipids (Table 3). The higher C/P ratio in the studies shows potential N limitations that would have triggered the lipid synthesis. In the present experiment, the C/P ratio varied from 2.27 to 0.63 (3.6 folds decrease; 10th day) in Chlorococcum sp.; 2.73 to 4.69 (1.71 folds increase; 10th day) in Microcystis sp. and 4.14 to 7.36 (1.78 folds increase; 8th day) in Phormidium sp. respectively. These C/P ratio are comparable to the studies of Stehfest et. al.21 during N deplete conditions. However the reasons for a decrease in the C/P ratio can be due to C degradation at the end of the growth phase. The studies on P tricornitum under nutrient sufficient and N deplete conditions showed C/P ratio of 0.8 (1.14 fold increase; 14th day) and 0.3 (2.42 fold increase; 26th day) respectively however a 6.7 fold increase in Microcystis auregonosa and 3.5 fold increase in Chroococcus minutus in C/P under N deplete conditions was observed21. Chlamydomonas reinhardtii and Scenedesmus subspicatus under lower N regimes showed a C/P ratio of 2.4 (9.6 fold increase; 10th day) and 1.5 (3.75 fold increase; 10th day) respectively7. Investigation on Dunaliella tertiolecta and Thalassiosira pseudonana showed a C/P ratio of 7.33 (2 folds increase; 5th day) and 17.6 (1.46 folds increase; 2nd day) in N replete conditions respectively31. Pediastrum duplex under natural conditions showed an average C/P ratio of 0.632.
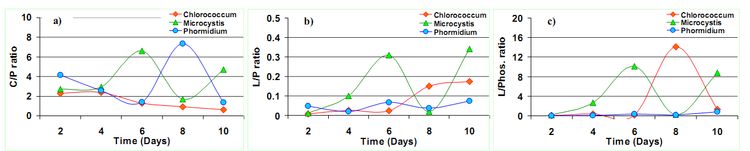
Figure 6. Changes in a) Carbohydrate/Amide I (C/P) ratio, b) Lipid/Amide I (L/P) ratio and c) Lipid/Phosphates (L/Phos.) in the algal species
There was clear increase in the Lipid/Amide (L/P) ratio towards the stationary phase (Figure 6b) which is due to a small increase in lipid with respect to proteins (Table 3). However in case of Microcystis sp., there was a significant increase in the L/P ratio during the 6th day due to stationary phase of its growth and the highest L/P ratio (0.34) was observed in the 10th day. In case of Chlorococcum sp. the L/P ratio started picking up from the 6th day onwards. In case of Phormidium sp., the L/P variations were not significant (p<0.05). In the present experiment the L/P ratio in case of Chlorococcum sp., Microcystis sp., and Phormidium sp. increased from 0.007 to 0.17 (24 folds increase; 10th day); 0.01 to 0.30 (30 folds increase; 6th day) and 0.04 to 0.07 (1.75 folds increase; 10th day) respectively, which are higher compared to the earlier studies21,32. The studies on Phaeodactylum tricornitum under nutrient sufficient conditions and N deplete conditions showed L/P ratio of 0.23 (1.27 fold increase; 14th day) and 0.3 (1.2 fold increase; 26th day) respectively21. Chlamydomonas reinhardtii and Scenedesmus subspicatus under lower N regimes showed L/P ratio of 1.4 (6.75 fold increase; 28th day) and 1.5 (7.1 fold increase; 15th day)7. Investigation on Dunaliella tertiolecta and Thalassiosira pseudonana showed a L/P ratio of 0.2 (5 folds increase; 6th day) and 0.63 (1.3 folds increase; 4th day) in N deplete conditions respectively31. Pediastrum duplex under natural conditions showed an average L/P ratio of 0.232.
The ratio of Lipid/Phosphates (L/Phos.) increased on 6th day and 8th day for Microcystis sp. and Chlorococcum sp. respectively (Figure 6c) which shows P limitation in the algae (Table 3). However there was no significant variation between the L/Phos ratio in Phormidium sp.. Similar observations were also made by Jiang et al.31. In the present experiment, the L/Phos. ratio varied from 0.07 to 1.36 (19.4 folds increase; 10th day) in Chlorococcum sp.; 0.14 to 8.78 (62 folds increase; 10th day) in Microcystis sp. and 0.01 to 0.82 (82 folds increase; 10th day) in Phormidium sp. respectively. Usually there is no change in phosphate content under N limitations and increase in the lipid/phosphate ratio can be as a result of increase in the lipid content in the cells. The studies on P tricornitum under nutrient sufficient and N deplete conditions showed L/Phos. ratio of 0.25 (1.23 fold increase; 15th day) and 0.24 (1.2 fold increase; 14th day) respectively21. Investigation on Dunaliella tertiolecta and Thalassiosira pseudonana showed L/Nucleic acid ratio of 0.4 (3 folds increase; 6th day) and 1.6 (1.6 folds increase; 8th day) in a combined growth setup of N-replete and N free media respectively31.
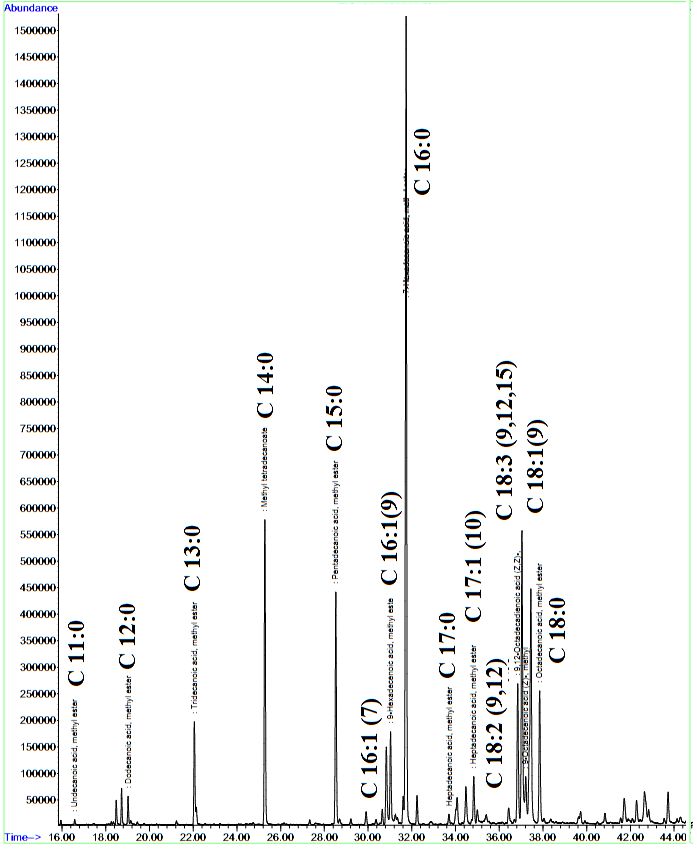
FAME Composition through GC-MS analysis showed 16 different types of fatty acids methyl esters, where most of them were saturated fatty acids (Table 4). Palmitic acid (C16:0) is dominant with 36%, 46% and 64% in Chlorococcum sp., Microcystis sp. and Phormidium sp.respectively (Table 4). FAME studies showed higher percentage of saturated fatty acids (75%) in case of Chlorococcum sp., compared to unsaturated fatty acids in other algal sp. The FAME chromatogram of Chlorococcum sp. is elucidated in Figure 7. The order of the major fatty acids in Chlorococcum sp. in the present study were C16:0 (~36%) >C18:2 (~14%) >C14:0 (~13%) >C15:0 (~9%) >C18:3 (~7%). However in studies conducted by Harwati et al.33 higher proportion of oleic acid C18:1(~40%) were found and the order of major fatty acids is C18:1 (~40%)>C16:0 (~33%)>C18:2 (~11%)>C18:3 (~7%)>C18:0 (~6%). Higher C18:1 compared to C18:2 and 18:3 were observed in other studies34,35. The FAME composition in the present studies showed similar results in Chlorococcum humicola which was dominated by palmitate C16:0 and the order of the major fatty acids found were C16:0 (~38%)>C18:3 (~18%)>C18:1 (~16 %)>C18:2 (~13.5%)> C18:0(~2%)36. The studied FAME profile ofthe wastewater algal species showed similar composition to that of palm oil-based biodiesel. The oil containing higher percentages of C16 and C18 fatty acids provide a good balance for oxidation for longer storage37 and a decreased cold filter plugging point (CFPP) to be used in cold places38. Furthermore, the essential fatty acid from biofuel perspectives were found to be in higher percentages in all the three selected algae with 98.2 %, 94.9% and 72% in Microcystis sp., Phormidium sp. and Chlorococcum sp. respectively (Table 4). Meager quantities of polyunsaturated fatty acids were observed from the FAME analysis. Earlier studies39 for checking the lipid class important from biofuel point of view has showed C16-C18 as most essential fatty acids having desirable biofuel properties. Palmitic, stearic, oleic and linolenic acids were recognized as the most common fatty acids contained in bio-diesel40.
Table 4. Fatty acid composition of Chlorococcum sp., Microcystis sp., Phormidium sp. and Standard Coconut oil (% FAME)
*Blank places à Un detectable
| C N:U |
Fatty Acyl Methyl Ester (%) |
Standard |
Chlorococcum |
Microcystis |
Phormidium |
| C 10:0 |
Decanoic acid, methyl ester |
5.07 |
-- |
-- |
-- |
| C 11:0 |
Undecanoic acid, methyl ester |
-- |
0.203 |
-- |
-- |
| C 12:0 |
Dodecanoic acid, methyl ester |
46.49 |
1.016 |
-- |
-- |
| C 13:0 |
Tridecanoic acid, methyl ester |
-- |
3.807 |
1.72 |
0.874 |
| C 14:0 |
Methyl tetradecanoate |
22.45 |
13.117 |
-- |
4.214 |
| C 15:0 |
Pentadecanoic acid, methyl ester |
-- |
9.916 |
-- |
-- |
| C 16:0 |
Hexadecanoic acid, methyl ester |
9.17 |
36.124 |
46.34 |
64.194 |
| C 16:1(7) |
7-Hexadecenoic acid, methyl ester |
-- |
0.701 |
-- |
2.69 |
| C 16:1(9) |
9-Hexadecenoic acid, methyl ester |
-- |
3.565 |
-- |
-- |
| C 17:0 |
Heptadecanoic acid, methyl ester |
-- |
0.449 |
-- |
-- |
| C 17:1(10) |
cis-10-Heptadecenoic acid, methyl ester |
-- |
2.088 |
-- |
-- |
| C 18:0 |
Octadecanoic acid, methyl ester |
7.94 |
6.322 |
7.11 |
5.522 |
| C 18:1(9) |
9-Octadecenoic acid , metyl ester |
7.23 |
1.592 |
6.54 |
1.56 |
| C 18:1(11) |
11-Octadecenoic acid , methyl ester |
-- |
-- |
-- |
3.455 |
| C 18:2(9,12) |
9,12-Octadecadienoic acid , methyl ester |
1.65 |
14.03 |
11.89 |
3.034 |
| C 18:3(9,12,15) |
9,12,15-Octadecatrienoic acid, methyl ester |
-- |
7.07 |
26.4 |
14.457 |
| |
|
|
|
|
|
| |
|
|
|
|
|
| Saturated fatty acids (Saturates) |
91.12 |
66.72 |
55.17 |
74.84 |
| Monoenoic fatty acids (Mono-unsatuarted fatty acids) |
7.23 |
7.95 |
6.54 |
7.69 |
| Polyenoic fatty acids (Poly-unsaturated fatty acids) |
1.65 |
21.1 |
38.29 |
17.49 |
| C16-C18 (fatty acids important : Biodiesel perspective) |
25.99 |
71.941 |
98.28 |
94.912 |
| |
Total Lipid Content |
30 |
8 |
18 |
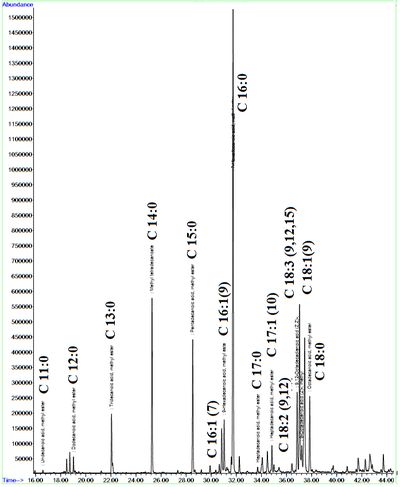
Figure 7. FAME Composition of Chlorococcum sp.(GC-MS)
Lipids with higher composition of palmitate and oleate show good biofuel properties such as quality ignition, higher oxidative stability and lubricity40. Thus all selected wastewater algae were reasonably good from a biofuel point of view, Microcystis sp. Phormidium sp. followed by Chlorococcum sp. (Table 4) comprised of higher percentages of quality fatty acids for biofuel combustion perspectives. Chlorococcum sp. emerged to be the best among the selected species due to its higher growth rate, lipid content and good proportion of important fatty acids and can thus be used as a candidate from wastewaters for energy generation and other combustive processes.
|

