Results and Discussion |
Using remote sensing data and GIS, analyses such as land cover, land use and species level mapping was done for the Kolar district as discussed earlier.
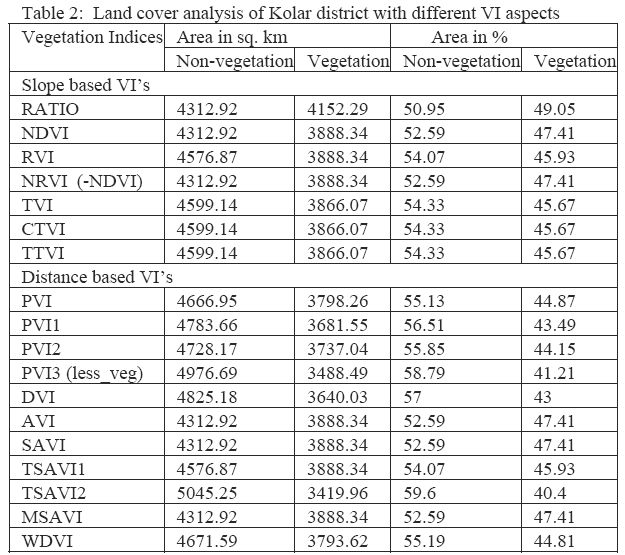
Slope based vegetation indices shows area under vegetation in Kolar district ranges from 47.65 % to 49.05%, while in distance based vegetation indices it ranges from 40.40% to 47.41%. Table 2 provides area under vegetation considering slope and distance based vegetation indices. Comparative analyses of vegetation indices indicate that slope based vegetation index NDVI (Figures 5) is appropriate for the regions with a good vegetation cover (such as Chikballapur taluk). While distance based vegetation index TSAVI 1 (Figures 6) is suitable for semi arid regions with scanty vegetation cover.
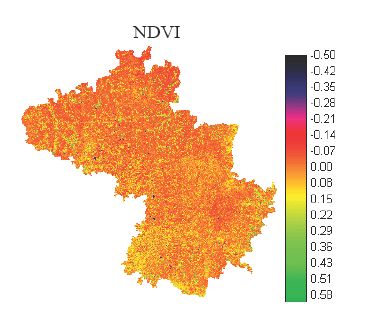
Figure 5: NDVI of Kolar district
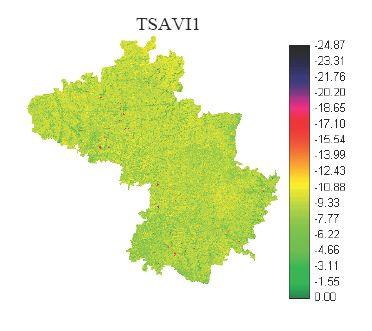
Figure 6: TSAVI 1 of Kolar district
Based on the extent of vegetation cover (land cover) and agroclimatic conditions, two representative taluks namely Kolar and Chikballapur were selected for training data collection for land use analyses.
Land use analysis | TOP |
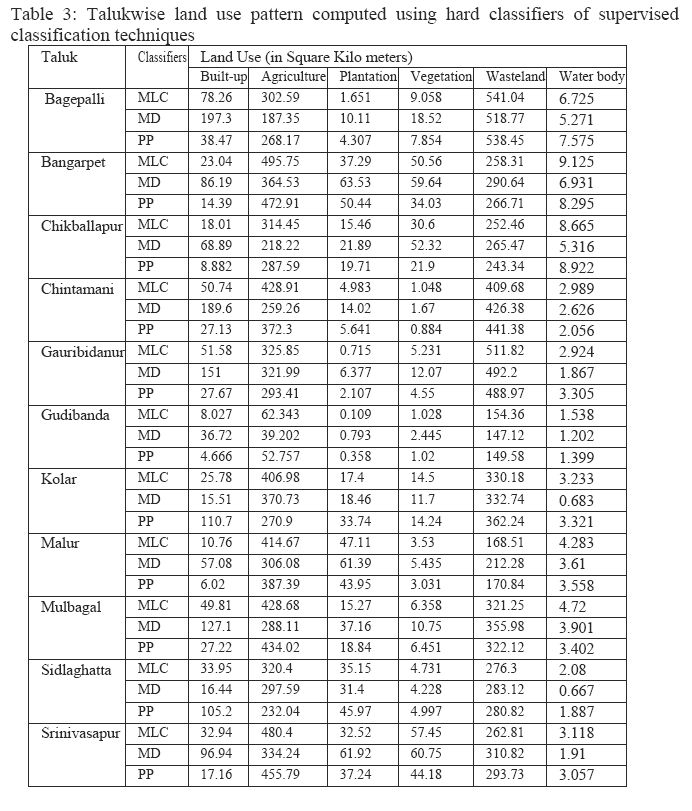
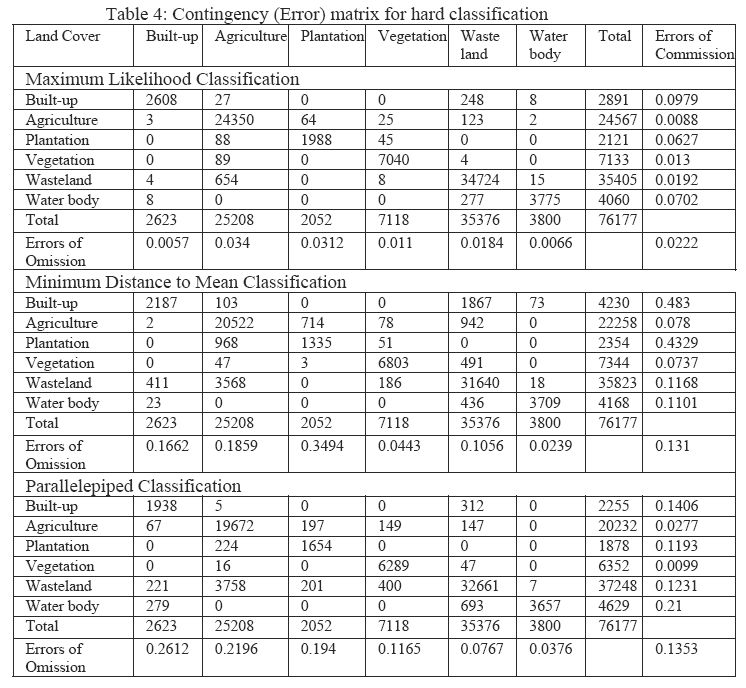
Supervised classification approaches were tried for land use analysis. In order to select the training sites (or ground control points) for supervised classification, a composite image (of G, R and IR bands) with false color assignment was generated. Composite image was generated using linear contrast stretch method by saturating 2.5% from each end of the gray scale. Figure 7 shows false colour composite (FCC) image of Kolar district. This helps in identifying heterogeneous patches, which aid in the selection of training polygons. Also homogenous patches are distinguishably visible. Figure 8 displays the selected training sites in Kolar taluk and supervised classification techniques were tried and results are tabulated in Table 3. Land use analyses using maximum likelihood classifier indicate that 46.69% is agricultural land, 42.33% is wasteland (barren land), 4.62% is built up, 3.07% of plantation, 2.77% natural forest and 0.53% water bodies. Accuracy assessment reveals that MLC is superior compared to MD and PP as it has least errors (due to commission and omission). Contingency (error) is tabulated in Table 4 for all the classifiers. Figure 9 represents the classified image of Kolar district indicating major landuse categories: built up, agriculture, plantation, forest, wasteland and water body.
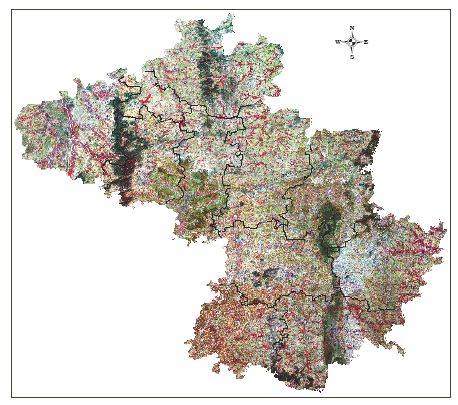
Figure 7: False colour composite image of Kolar district
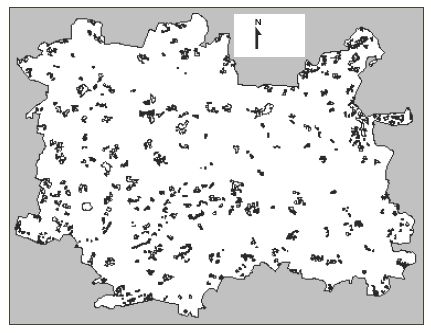
Figure 8: Training sites in Kolar district
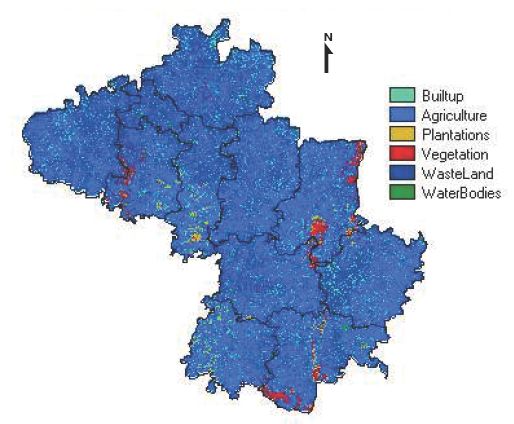
Figure 9: Classified image of Kolar district
Energy Demand Assessment | TOP |
Energy demand survey covering 2070 households spread all over the district covering various communities and economic categories reveal higher dependence of bioresources for fuel wood, agriculture and horticulture residues for energy purposes (85-90%). It is found that demand (per capita fuel consumption) in this region varies from 1.3 kg/person/day to 2.5 kg/person/day.
Higher dependence on bioresources and scarcity in some taluks necessitated further analyses at species level to assess the availability of fuel wood species in each taluk. Detail species level classification has been done as discussion in data analysis section using Panchromatic sensor data (spatial resolution 5.8 meters and spectral resolution of G, R and NIR). Field data was collected from 26 villages in Kolar (Figure 10) and 18 villages in Chikballapur taluk (Figure 11) and these villages were chosen to represent resources micro level variability and to represent the entire taluk.
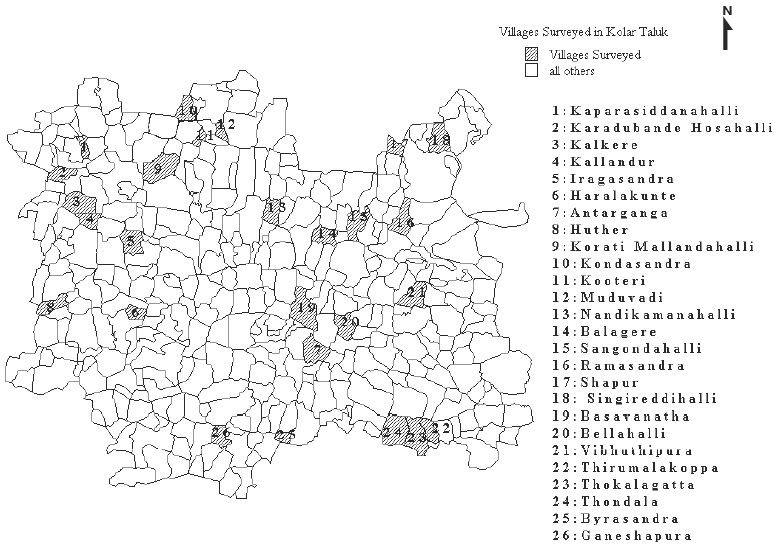
Figure 10: Villages surveyed in Kolar taluk
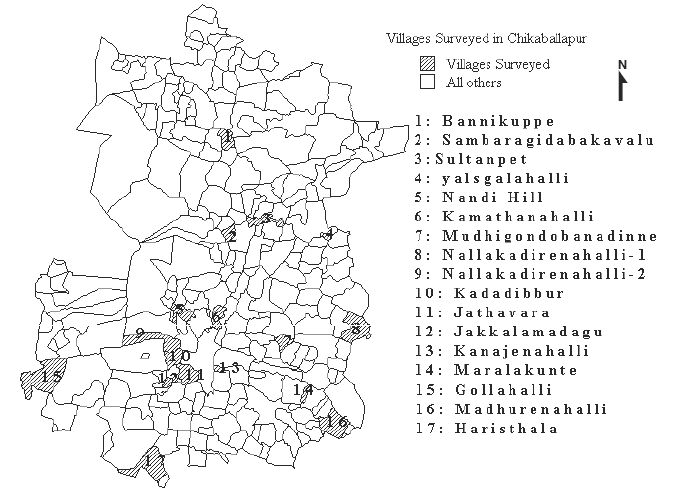
Figure 11: Villages surveyed in Chikkaballapur taluk
Figure 12 and 13 represents pixel level mapping in geo registered cadastral village maps of Bannikupe and Jathavara Hosahali villages in Chikballapur taluk and its corresponding Panchromatic village maps and histogram of a dominant species. Similar exercise has been done on 26 villages of Kolar taluk. Figure 14 and 15 represents digitized vector layer of Antaragange and Iragasandra-1 villages and its corresponding Panchromatic village maps and spectral response curve of the dominant species. Training sites were selected on the basis of their girth, height, density etc. Adult plants having high density were taken as training data set for image classification. However, there is variation in spectral values due to seasonal aspects. Hence, season wise PAN scene classification has been done.
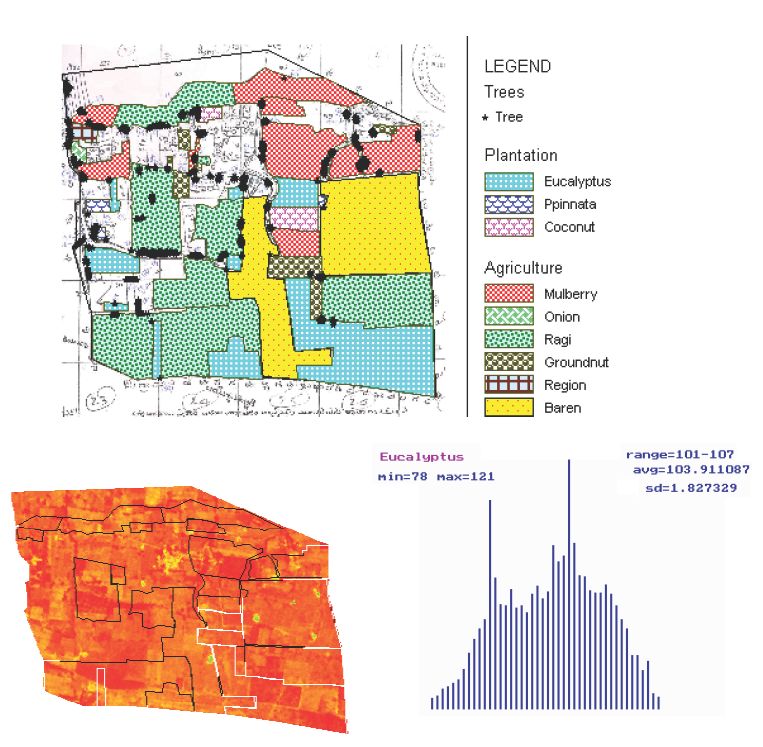
Figure 12: Digitized vector layer of Bannikupe village in Chikballapur taluk and its corresponding Panchromatic village map and histogram of dominant species
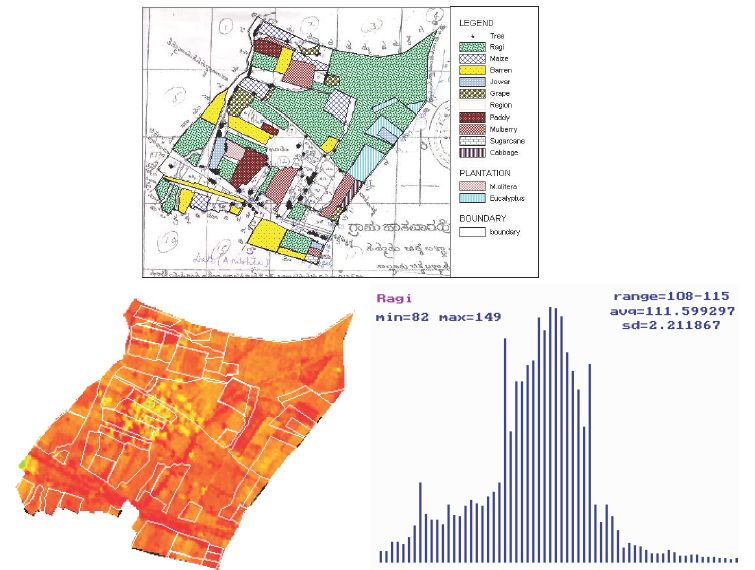
Figure 13: Digitized vector layer of Jathavara Hosahali village in Chikballapur taluk and its corresponding Panchromatic village map and histogram of dominant species
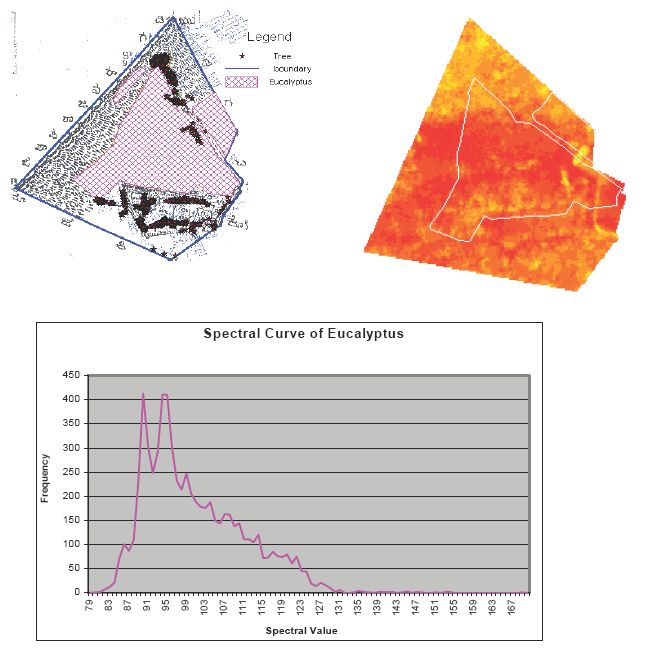
Figure 14: Digitized vector layer of Antaragange village and its corresponding Panchromatic village map and spectral response curve of the dominant species
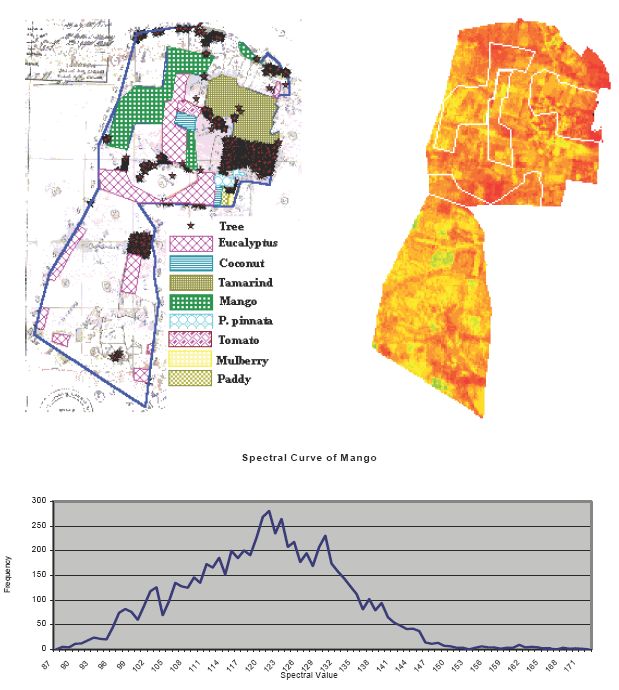
Figure 15: Digitized vector layer of Iragasandra-1 village and its corresponding Panchromatic village map and spectral response curve of the dominant species
TOP |
PAN images of Chikballapur, Gauribidanur and Gudibanda were taken on 05th January 1999. Based on the training data of Chikballapur these three taluks are classified.Durin this period there was no agriculture on the field, so classification of plant was taken into consideration. The different training sites with their spectral value are given below in Table 5,
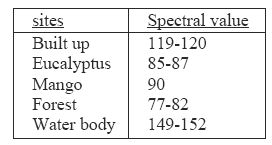
Table 5 : Different Training Sites with their Spectral Values
Based on these spectral values, taluk level classification was carried out and results are shown in Table 6.
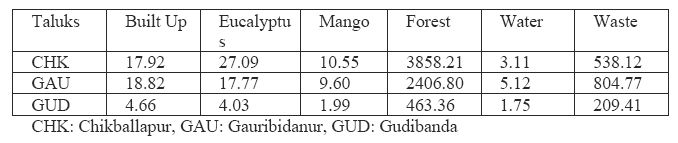
Table 6 : Land use detail on PAN image of 05th January 1999 (Area in sq.Km)
Remote sensing data of Chintamani, Srinivasapur, Siddhlaghata, and Kolar (partial) taluks of 30th January 1999 scene was classified on the basis of Kolar training data (as all these taluks fall in the similar type of land cover). In this period there is no cultivation of agriculture, so classification is done for plantation and trees. The spectral value of different species is given in Table 7.
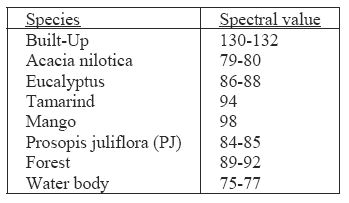
Table 7 : Different Species with their Spectral Values
On the basis of these spectral values given in Table 7, respective taluks were classified and results are shown in Table 8.
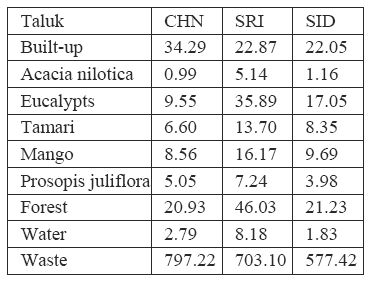
Table 8 : Land use detail on PAN image of 30th January 1999 (Area in sq.Km)
Kolar, Malur, Chintamani, and Srinivasapur taluks of 17th November 1998 were classified on the basis of Kolar taluk training data. During this period, agriculture is prevalent in this region. Taking this aspect into consideration, spectral values of different species in this image are given in Table 9.
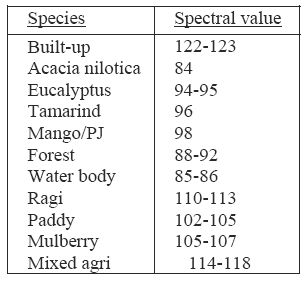
Table 9 : Different Species with their Spectral Values
On the basis of the spectral values given in Table 9, the values of Species and taluks are classified. Table 10 shows the detail about the area under each species.
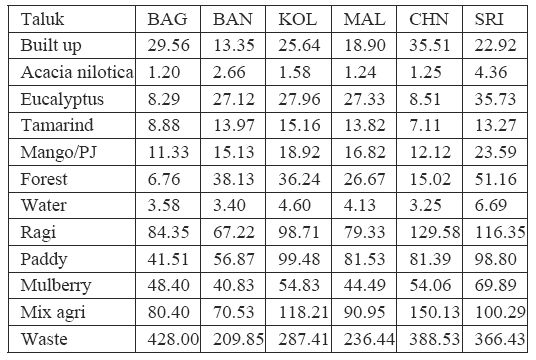
BAG: Bagepalli, BAN: Bangarpet, KOL: Kolar, MAL: Malur, CHN: Chintamani, and
SRI: Srinivasapur.
Table 10 : Land use detail on PAN image of 17th November 1998 (Area in sq.Km)
Classification was done for Bagepalli taluk (for 70% of Bagepalli area, in the scene of path 100 and row 63) and Bangarpet taluk with the help of remote sensing data (PAN data) of 17th November 1998. Table 11 gives details about the classification result of plantation and forest area of all taluks.
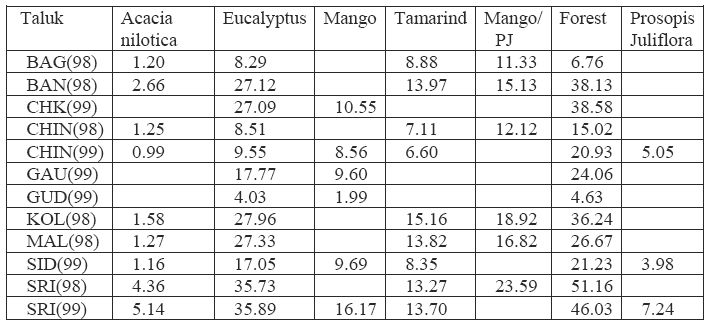
BAG: Bagepalli, BAN: Bangarpet, CHK: Chikballapur, CHN: Chintamani, KOL: Kolar,
GAU: Gauribidanur, GUD: Gudibanda, MAL: Malur, SID: Siddhlaghata, SRI:
Srinivasapur, PJ: Prosopis Juliflora.
Table 11 : Land use pattern on PAN image (species level) for all taluks (Area in sq. km)
Mapping of Prosopis juliflora a commonly used fuel wood species was done in Iraghasandra and Huthur villages of Kolar taluk where the growth was more due to the favorable edaphic factors. With the identification of spectral response pattern for the species (considering density and age), mapping was done for the entire Kolar taluk as well as for the neighbouring Gauribidanur taluk (Figure 16) with the help of merged remote sensing data (LISS III MSS and PAN) in Kolar district. Figure 17 depicts fused image of MSS and PAN data. The map of Prosopis juliflora was verified (field visit) using GPS. The accuracy of mapping is 88% as 44 polygons out of 50 mapped polygons correlated with the species.
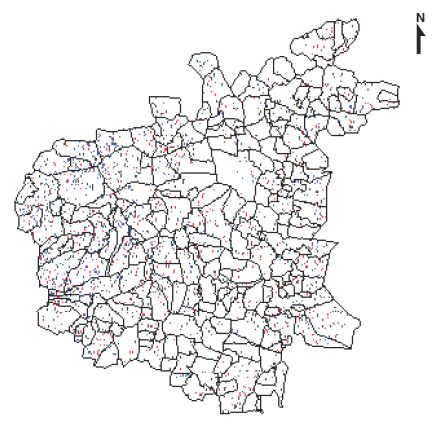
Figure 16: PAN image of Gauribidanur taluk with Prosopis juliflora mapped
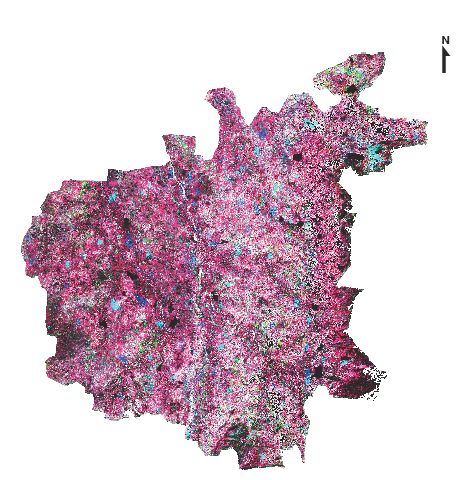
Figure 17: LISS III and PAN fused image of Gauribidanur taluk
TOP |
Table 12 provides village wise population density data. It is seen that population density is less in villages compared to towns. It is found that 80-90% villages have population density less than 5 person per hectare while 1-2% villages (towns) have high population density of more then 20 person per hectare.
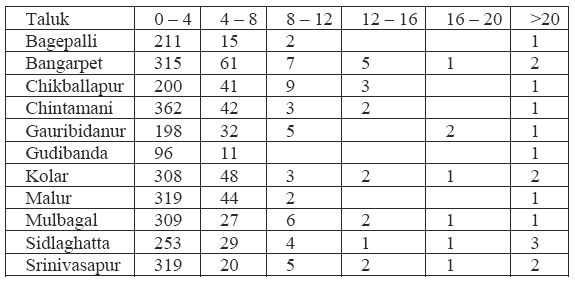
Table 12 : Taluk wise population density (persons per hectare)
Figure 18 illustrates bioresource status of all the taluks in Kolar district for Resource (average)/ Demand (average) cases. Table 13 gives detailed information about bioresource status for case 9 (resources average to demand average ratio). Ratio less than one gives the scarcity of bioresource in that region. It is found that more than 90% villages have potential to meet up to 20% of total population energy demand. This means there is scarcity of bioresource in most of the villages of Kolar district. It is found that Gauribidanur and Gudibanda taluks have least bioresource where more than 95% villages, bioresource option can meet the domestic energy requirement of only 0-20 % population. Chikballapur, Srinivasapur, Malur taluks have healthy vegetation compared to other taluks. In 20% villages of these taluks bioresource option can meet the domestic energy requirement of more than 60 % population.
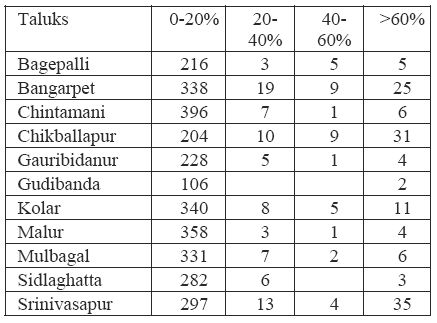
Table 13 : Taluk wise Bioresource Status for case 9
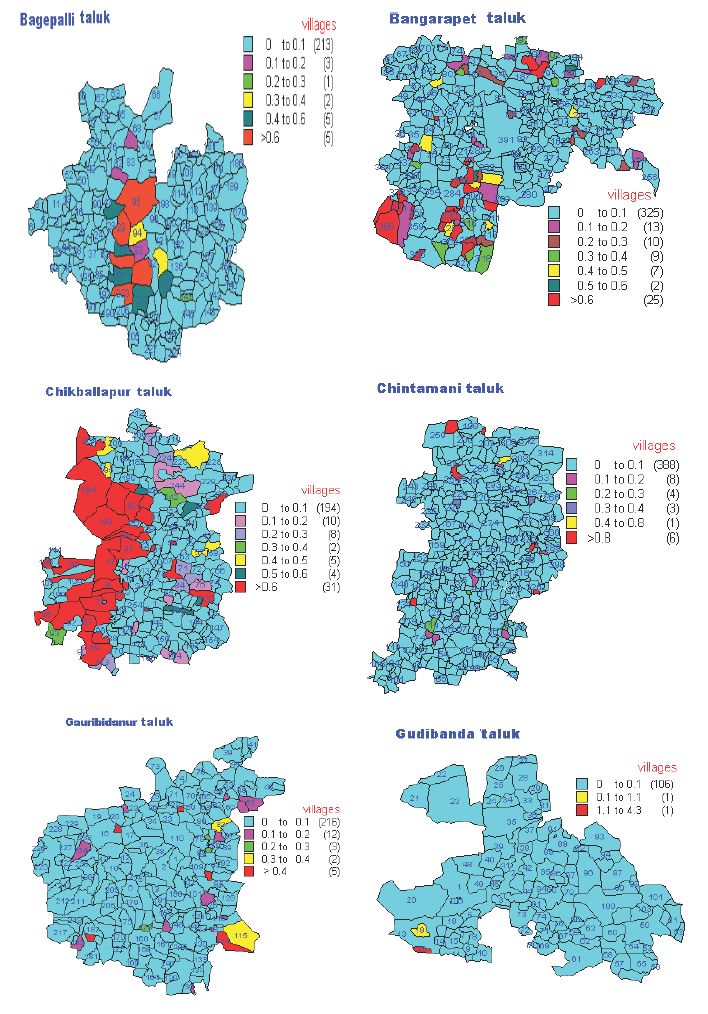
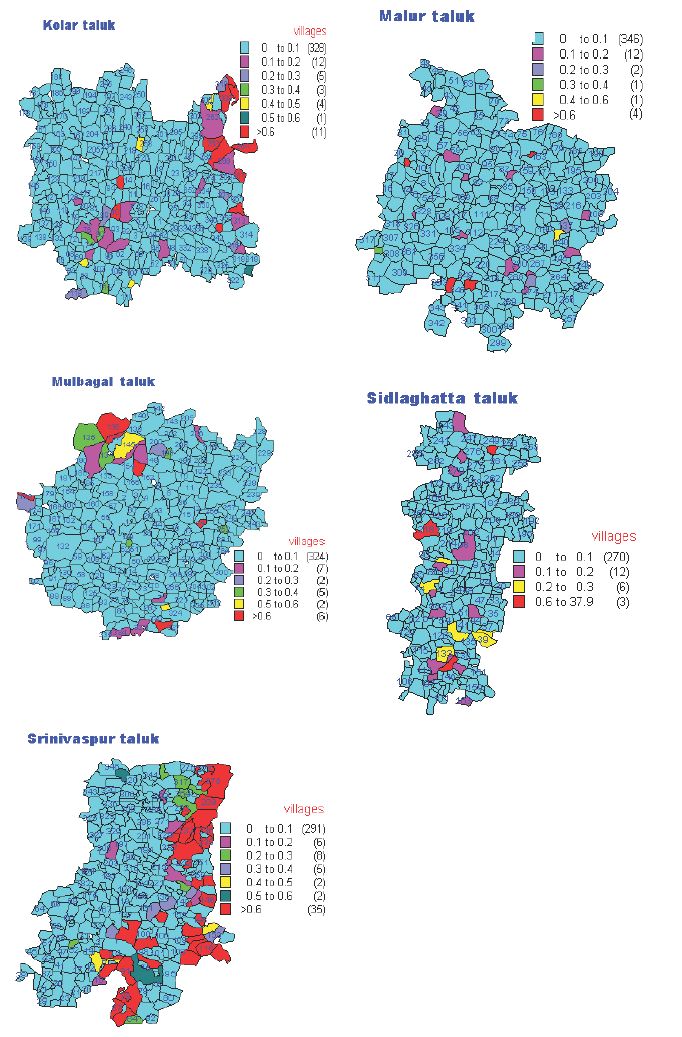
Figure 18: Bioresource status of all the taluks in Kolar district
 | TOP |