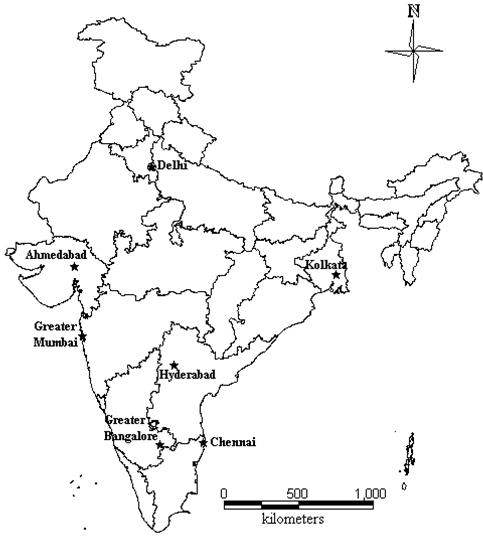
 Figure 1: Study area - Major cities in India (Source: Energy & Wetlands Research Group, CES, IISc)
- Kolkata (Calcutta): Kolkata, the capital of West Bengal with core area of the city is flat and is located on the east bank of Hooghly River. The Municipal Corporation of Kolkata covers an area of 187 km2 with a population of 4,503,787 (in 2009). GDP of Kolkata in the year 2009 was estimated to be Rs.136,549 crores at constant prices resulting in being a major commercial and financial hub in the parts of Eastern and North-Eastern India.
- Chennai (Madras): Chennai, the capital of the state of Tamil Nadu is located on the Coromandel Coast of the Bay of Bengal having a population of 4,611,564 in the year 2009, with an area of 174 km2 which is expanded to 426 km2 by the city corporation in the year 2011. The economy of the city majorly depends on sectors like automobile, software services, health care industries and hardware manufacturing resulting in estimated GDP of Rs. 86,706 crores at constant prices during the year 2009 (Loganathan, et al., 2011).
- Greater Bangalore: Greater Bangalore is the principal administrative, cultural, commercial and knowledge capital of the state Karnataka which covers an area of 741 km2 and a estimated population of 8,881,631 during the year 2009. During the year 2009, Bangalore’s economy of Rs. 90,736 crores at constant prices makes it one of the major economic centres in India. Economy depends on information technology, manufacturing industries, biotechnology and aerospace and aviation industries (Ramachandra et al., 2012).
- Hyderabad: Hyderabad, the capital of Andhra Pradesh is located at the north part of the Deccan plateau with a population of 6,007,259. Municipal Corporation of Hyderabad covers an area of 179 km2 whereas Greater Hyderabad is spread over an area of 650 km2. Economic sector depends on traditional manufacturing, knowledge sector and tourism resulting in a GDP of Rs. 76,254 crores at constant prices in the year 2009.
- Ahmedabad: Ahmedabad an industrial city is situated on the banks of Sabarmati River in north-central Gujarat. It covers an area of 205 km2 with a population of 5,080,596 in the year 2009. Ahmedabad is the second largest industrial centre in western India after Mumbai. Automobile sector, textiles, pharmaceutical and real estate are the major sectors contributing to economy which stands at Rs. 64,457 crores at constant prices in the year 2009.
2.2 QUANTIFICATION OF GREENHOUSE GASES (GHG’s)
Major three greenhouse gases quantified are Carbon dioxide (CO2), Methane (CH4) and Nitrous oxide (N2O). The non-CO2 gases are converted to units of Carbon dioxide equivalent (CO2e) using their respective global warming potential (GWP). The total units of CO2e then represent a sum total of the global warming potential of all 3 major greenhouse gases. Categories considered for GHG emission inventory are (i) Energy: Electricity consumption, Fugitive emissions, (ii) Domestic or household sector, (iii) Transportation, (iv) Industrial sector, (v) Agriculture related activities, (vi) Livestock management and (vii) Waste sector
National greenhouse gas inventories compiled from various sources have been used for calculation of GHG emissions. Country specific emission factors were compiled from the published literatures. In the absence of country specific emission factors default emission factors of IPCC have been used. Emission of each GHG is estimated by multiplying fuel consumption by the corresponding emission factor. Total emissions of a gas from all its source categories (Ramachandra and Shwetmala, 2012; Pandey et al., 2011; Global Footprint Network, 2007), emissions are summed as given in equation 1.
………1
Where,
Emissions Gas = emissions of given gas from all its source categories
A = amount of individual source category utilized which generates emissions of the gas under consideration
EF = emission factor of a given gas type by type of source category.
GHG Emissions from Electricity Consumption: Combustion of fossil fuels in thermal power plants during electricity generation results in the emission of greenhouse gases into the atmosphere. Carbon dioxide (CO2), oxides of sulfur (SOx), nitrogen oxides (NOx), other trace gases and air borne inorganic particulates, such as fly ash and suspended particulate matter (SPM) are the most important constituents emitted from the burning of fossil fuels from thermal power plants (Raghuvanshi et al., 2006; Ramachandra and Shwetmala, 2012; TEDDY, 2006; 2011)). The emissions computed based on the consumption in the following categories: domestic, commercial, industrial and others which include consumption in railways, street lights, municipal water supply, sewage treatment etc based on the amount of electricity consumed by these sectors. The total greenhouse gas emissions have been calculated on the basis of fuel consumption required for the generation of electricity using the equation 2,
Emissions (t) = Fuel consumption (kt) × Net calorific value of fuel (TJ/kt) × Emission factor (t/TJ) .........2
Electricity is generated from various sources (coal, hydro, nuclear, gas, etc.). The proportion of electricity generated from each source for each study region is compiled from the secondary source (State electricity board, Central electrical Authority, etc.). Quantity of respective fuel is computed with the knowledge of the relative share of fuel and the quantity of fuel required for generating one unit of electricity (such as 0.7 kg Coal required for generation of 1 unit (KWh) of electricity). The data related to electricity consumption in different cities is taken from the respective electricity boards providing electricity to that city. Table 2 lists the emission factors and the net calorific values of respective fuels. The total emissions obtained from the amount of fuel consumed is then distributed into major sectors like domestic, commercial, industrial and others based on the amount of electricity consumed in that sector during the inventory year 2009-10. Apart from the fuel consumption on the basis of electricity consumption which is calculated, the fuel consumption and the emissions resulting thereby is also determined for the auxiliary consumption in the power plants located within the city boundary and the transmission loss resulting from these power plants.
Table 2: Net Calorific Value (NCV), CO2, CH4 and N2O emission factors of different fuel
Fuel |
NCV (TJ/kt) |
CO2 EF (t/TJ) a & b |
CH4 EF (t/TJ) b |
N2O EF (t/TJ) b |
Coal |
19.63 |
95.81 |
0.001 |
0.0015 |
Natural Gas |
48 |
56.1 |
0.001 |
0.0001 |
Naphtha |
44.5 |
73.3 |
0.003 |
0.0006 |
Diesel Oil |
43.33 |
74.1 |
0.003 |
0.0006 |
Natural Gas |
48.632 |
64.2 |
0.003 |
0.0006 |
LSHS |
40.19 |
73.3 |
0.003 |
0.0006 |
RFO |
40.4 |
77.4 |
0.003 |
0.0006 |
LSFO |
41 |
73.3 |
0.003 |
0.0006 |
HFO |
40.2 |
73.3 |
0.003 |
0.0006 |
Note: NCV - Net Calorific Value, EF - Emission factor, LSHS - Low Sulfur Heavy Stock, RFO - Residual Fuel Oil, LSFO - Low Sulfur Fuel Oil, HFO - Heavy Fuel Oil
Source: a Indian Network for Climate Change Assessment (INCCA, 2010),
b 2006 IPCC Guidelines for National Greenhouse Gas Inventories (IPCC, 2006), TEDDY, 2006; 2011
Fugitive Emissions: Fugitive emissions are the intentional or unintentional release of GHGs which occurs during the extraction, production, processing or transportation of fossil fuels. Exploration for oil and gas, crude oil production, processing, venting, flaring, leakages, evaporation and accidental releases from oil and gas industry are the sources of CH4 emission (INCCA, 2010; Ramachandra and Shwetmala, 2012). Refinery throughput is the total amount of raw materials processed by a refinery or other plant in a given period. In the present study the emissions from refinery crude throughput is calculated from the refineries present within the city boundary as per equation 3.
Emissions (Gg) = Refinery crude throughput (Million tons) × Emission factor (Gg/Million tons) ………3
The methane emission factor for refinery throughput is 6.75904 × 10⁻⁵ Gg/million tons (IPCC, 2000, 2006).
GHG Emissions from Domestic Sector: Large demand for energy consumption in the domestic sector is predominantly due to activities like cooking, lighting, heating and household appliances. As per the Census of India (2001), in urban areas, most commonly used fuel is Liquified Petroleum Gas (47.96%), followed by firewood (22.74%) and kerosene (19.16%). Electricity consumption in the households is another major source of energy utilization in the urban households. The pollution caused by domestic fuel use is a major source of emissions in cities which causes indoor air pollution contributing to overall pollution. Utilization of type of fuels in households also affects the air pollution.
The emissions resulting from electricity consumption in domestic sector is attributed to this sector. Greenhouse gas emissions from fuel consumption in domestic sector can be calculated (Ramachandra and Shwetmala, 2012) by using the equation 4. Table 3 lists NCV and emission factors for the domestic fuels.
Emissions (t) = Fuel consumption (kt) × Net calorific value of fuel (TJ/kt) × Emission factor (t/TJ)
………4
Table 3: Net Calorific Value (NCV), CO2, CH4 and N2O emission factors of domestic fuels used in the study
Fuel |
NCV (TJ/kt) |
CO2 EF (t/TJ) a & b |
CH4 EF (t/TJ) b |
N2O EF (t/TJ) b |
LPG |
47.3 |
63.1 |
0.005 |
0.0001 |
PNG |
48 |
56.1 |
0.005 |
0.0001 |
Kerosene |
43.8 |
71.9 |
0.01 |
0.0006 |
Note: LPG - Liquified Petroleum Gas, PNG - Piped Natural Gas
Source: a Indian Network for Climate Change Assessment (INCCA, 2010), b 2006 IPCC Guidelines for National Greenhouse Gas Inventories (IPCC, 2006)
GHG Emissions from Transportation Sector: Transportation sector is one of the dominant anthropogenic sources of greenhouse gases (GHGs) in to the atmosphere (Mitra and Sharma 2002). The urban population predominantly depends on road transport due to which there is an increase in sales of vehicles in urban areas every year. Type of transport and fuel, apart from type of combustion engine, emission mitigation techniques, maintenance procedures and age of the vehicle are the major factors on which road transportation emissions depend upon (Ramachandra and Shwetmala, 2009; 2012). Emissions is estimated from either the fuel consumed (fuel sold data) or the distance travelled by vehicles approach. Bottom-up approach was implemented based on number of registered vehicles, annual vehicle kilometers travelled and corresponding emission factors for the estimation of gases from road transportation sector (Gurjar et al., 2004; Ramachandra et al., 2009). At national level studies, fuel consumption approach is used to calculate the emissions from road transport (Singh et al., 2009; INCCA, 2010).
Bottom-up approach is used in this study in which emissions are calculated using the data available on number of vehicles, distance travelled in a year and the respective emission factor for different vehicles. Emissions from road transport are calculated as per equation 5 and emission factors are listed in Table 4.
Ei = ∑ (Vehj × Dj) × E i,j,km ………5
Where,
Ei = Emission of the compound (i)
Vehj = Number of vehicles per type (j)
Dj = Distance travelled in a year per different vehicle type (j)
E i,j,km = Emission of compound (i), vehicle type (j) per driven kilometer.
Table 4: CO2, CH4 and N2O emission factors for different type of vehicles
Type of Vehicle |
CO2 EF (g/km) a |
CH4 EF (g/km) b |
N2O EF (g/km) b |
Motor Cycles, Scooters & Mopeds |
27.79 |
0.18 |
0.002 |
Cars and Jeeps |
164.22 |
0.17 |
0.005 |
Taxis |
164.22 |
0.01 |
0.01 |
Buses |
567.03 |
0.09 |
0.03 |
Light Motor Vehicles (Passengers) |
64.16 |
0.18 |
0.002 |
Light Motor Vehicles (Goods) |
273.46 |
0.09 |
0.03 |
Trucks and Lorries |
799.95 |
0.09 |
0.03 |
Tractors and Trailers |
515.2 |
0.09 |
0.03 |
Source: a Emission factor development for Indian Vehicles, The Automotive Research Association of India, 2007 (ARAI, 2007), b EFA - European Environmental Agency, (2001), Gurjar et al., 2004
In this study the number of registered vehicles in the inventory year 2009 is taken from the ‘Motor Transport Statistics’ of respective states and also from ‘Road Transport Year Book (2007-2009) when the city level data is not available from the local transport authority. Supreme Court passed an order in July 1998 for converting all public transport vehicles to CNG mode in Delhi, which marked a beginning of CNG vehicles in India (Sandhya Wakdikar, 2002; Chelani and Sukumar, 2007). Emissions from the number of vehicles using Compressed Natural Gas (CNG) as a fuel are also calculated in the major cities where CNG is introduced to mitigate the emissions resulting from transportation. Vehicle kilometer travelled per year values are taken from the Central Pollution Control Board of India (CPCB, 2007; Chelani and Sukumar, 2007). The annual average mileage values of different vehicles used are given in Table 5.
Table 5: Vehicle Kilometers Travelled (VKT)
Type of Vehicles |
VKT |
Motor Cycles, Scooters & Mopeds |
10000 |
Cars and Jeeps |
15000 |
Taxis |
30000 |
Buses |
60000 |
Light Motor Vehicles (Passengers) |
40000 |
Light Motor Vehicles (Goods) |
40000 |
Trucks and Lorries |
30000 |
Tractors and Trailers |
5000 |
Source: Transport fuel quality for the year 2005, CPCB (2007)
GHG emissions for major cities in India were calculated considering the fuel consumption for navigation in major ports of Mumbai, Kolkata and Chennai. 2006 IPCC guidelines provide method to calculate emissions from navigation (IPCC, 2006). Using the ship type in the ports and gross registered tonnage (GRT), the total fuel consumed is calculated, using which the emissions are calculated. The type of ships and GRT data is available from (Basis Ports Statistics of India, 2009-10). Equation 6 is used to compute the emissions using the fuel consumption in different ship types using GRT and ship type data as given below,
Emissions (t) = Fuel consumption (kt) × Net calorific value of fuel (TJ/kt) × Emission factor (t/TJ)
………6
Container = 8.0552 + (0.00235 × GRT)
Break Bulk (General Cargo) = 9.8197 + (0.00413 × GRT)
Dry Bulk = 20.186 + (0.00049 × GRT)
Liquid Bulk = 14.685 + (0.00079 × GRT)
High Speed Diesel (HSD), Light Diesel Oil (LDO) and Fuel Oil are the major fuels used for shipping in India (Ramachandra and Shwetmala, 2009). The average of NCV values and emission factors are used to calculate the emissions for fuel consumption. CO2 emission factors for Fuel Oil and HSD/LDO are taken as 77.4t/TJ and 74.1t/TJ respectively. CH4 and N2O emission factors are taken as 0.007t/TJ and 0.002t/TJ respectively for navigation (IPCC, 2006). At the country level, the emissions from shipping are calculated using the fuel consumption data (NATCOM, 2004; Garg et al., 2006; Ramachandra and Shwetmala, 2009; MCI 2008).
GHG Emissions from Industry Sector: Greenhouse gas emissions are produced from a wide variety of industrial activities. Industrial processes that chemically or physically alter materials are the major emission sources. The blast furnace in the iron and steel industry, manufacturing of ammonia and other chemical products from fossil fuels used as chemical feedstock and the cement industry are the major industrial processes which releases considerable amount of CO2 (IPCC, 2006). There is no data available for calculation of emissions from small and medium scale industries which are present in thousands of number in the major cities. In this study the emissions are calculated from the major polluting industrial processes from the industries which are located within the city boundaries. In cities like Mumbai, presence of large petrochemical plants, fertilizer plants and power plants leads to emissions (Kulkarni et al., 2000).
The greenhouse gases estimated for the type of industries located within the city boundaries based on the availability of the data are discussed below. Ammonia (NH3) is a major industrial chemical and the most important nitrogenous material produced. Ammonia gas is directly used as a fertilizer, paper pulping and also in manufacturing of chemicals (IPCC, 2006). Ammonia production data is obtained from the fertilizer industry (RCF, 2010; MFL, 2010) and emission factors and other parameters (Table 6) are obtained from IPCC 2006 guidelines. Emission from ammonia production is calculated as per equation 7.
ECO2 = AP × FR × CCF × COF × 44/12 – RCO2 ………7
Where,
ECO2 = emissions of CO2 (kg)
AP = ammonia production (tonnes)
FR = fuel requirement per unit of output (GJ/tonne ammonia produced)
CCF = carbon content factor of the fuel (kg C/GJ)
COF = carbon oxidation factor of the fuel (fraction)
RCO2 = CO2 recovered for downstream use (urea production) in kg.
Table 6: Values used to calculate GHG emissions from fertilizer industry
Parameter |
FR (GJ/tone NH3 produced) |
CCF (kg C/GJ) |
COF (fraction) |
Value |
37.5 |
15.30 |
1 |
Source: 2006 IPCC Guidelines for National Greenhouse Gas Inventories (IPCC, 2006)
Glass industry can be divided into 4 major groups: Containers, flat (window) glass, fibre glass and specialty glass. Limestone (CaCO3), dolomite Ca, Mg(CO3)2 and soda ash (Na2CO3) are the major glass raw materials which are responsible for the emission of CO2 during the melting process (IPCC, 2006). Equation 8 is used when there is no data available on glass manufactured by process or the carbonate used in the manufacturing of glass.
CO2 emissions = Mg × EF × (1-CR) ………8
Where,
CO2 Emissions = emissions of CO2 from glass production (tonnes)
Mg = mass of glass produced (tonnes)
EF = default emission factor for manufacturing of glass (tonnes CO2/tonne glass)
CR = cullet ratio for process (fraction).
Table 7: Values used to calculate GHG emissions from glass industry
Parameter |
Emission factor (tonnes CO2/tonne glass) |
Cullet ratio |
Value |
0.2 |
0.5 |
Source: 2006 IPCC Guidelines for National Greenhouse Gas Inventories (IPCC, 2006)
Table 3.7 gives the values of different parameters that are used to calculate GHG emissions from glass industry. In the present study fuel consumption data available from major industries present within the major city boundary limits are used to calculate the emissions where all data is available (Annual reports of Vitrum Glass, 2010; G-P (I) Ltd., 2010; EMAMI, 2010; Kesoram Ind. Ltd, 2010; TN Petro Products Limited, 2010; Khoday India Limited, 2010). The fuel consumption by the industries for the year 2009-10 is obtained from their annual reports using which the emissions are calculated accounting for fuel utilization.
GHG Emissions from Agriculture related Activities: Agriculture related activities such as paddy cultivation, agricultural soils and burning of crop residue are considered for quantification of GHG. Flooded rice fields are one source of methane emissions. During the paddy growing season, methane is produced from anaerobic decomposition of organic material in flooded rice fields which escapes to the atmosphere through the rice plants by the mechanism of diffusive transport (IPCC, 1997). Oxygen supply is seized to the soil from the atmosphere due to the flooding of rice fields which leads to anaerobic fermentation of organic matter in the soil, resulting in the production of methane (Ferry 1992).
There are three processes of methane release into the atmosphere from paddy fields. The major phenomenon being the CH4 transport through rice plants (Seiler et al., 1984; Schutz et al., 1989). This accounts for more than 90% of the total CH4 emissions. Methane loss as bubbles (ebullition) from paddy soils is also a common and significant mechanism. The least important process is the diffusion loss of CH4 across the water surface (IPCC, 1997). The emission of methane from rice fields depends on various factors such as amendment of organic and inorganic fertilizers, characteristics of rice varieties, water management and soil environment (Mitra et al., 1999). CH4 emissions from rice cultivation have been estimated by multiplying the seasonal emission factors by the annual harvested areas. The total annual emissions are equal to the sum of emissions from each sub-unit of harvested area which is calculated using equation 9 (IPCC, 2000).
………9
Where,
CH4 Rice = annual methane emissions from rice cultivation (Gg CH4 yr-1)
EFi,j,k= seasonal integrated emission factor for i, j, and k conditions (kg CH4 ha-1)
Ai,j,k= annual harvested area of rice for i, j, and k conditions (ha yr-1)
i, j and k= represent different ecosystems, water regimes, type and amount of organic amendments and other conditions under which CH4 emissions from rice may vary.
It is advisable to calculate the total emissions as a sum of the emissions over a number of conditions, when carrying out studies at city levels the following method from Revised IPCC 1996 guidelines is used (IPCC, 1997).
Fc = EF × A × 10-9 ………10
Where,
Fc = estimated annual emission of methane from a particular rice water regime and for a given organic amendment (Gg/yr)
EF = methane emission factor integrated over integrated cropping season (g/m2)
A = annual harvested area cultivated under conditions defined above. It is given by the cultivated area times the number of cropping seasons per year (m2/yr).
The above method is used because the area of paddy fields based on the type of ecosystem (irrigated, rain fed, deep water and upland) is not available at city level. Seasonally integrated emission factor of 10g/m2 is used which is obtained from the revised 1996 IPCC guidelines (IPCC, 1997).
Agricultural soils contribute towards the emission of 2 major GHGs: methane and nitrous oxide. N2O is produced naturally in soils through the processes of nitrification and denitrification. Nitrification is the aerobic microbial oxidation of ammonium to nitrate and denitrification is the process of anaerobic microbial reduction of nitrate to nitrogen gas (N2). Nitrous oxide is a gaseous intermediate in the reaction sequence of denitrification and a by-product of nitrification that leaks from microbial cells into the soil and ultimately into the atmosphere. This method, therefore, estimates N2O emissions using human-induced net N additions to soils (e.g., synthetic or organic fertilizers, deposited manure, crop residues, sewage sludge), or of mineralization of N in soil organic matter following drainage/management of organic soils, or cultivation/land-use change on mineral soils (IPCC, 2006; Granli and Bockman, 1994).
The emissions of N2O resulting from anthropogenic N inputs or N mineralization occur through both a direct pathway (i.e., directly from the soils to which the N is added/released), and through two indirect pathways: (i) following volatilization of NH3 and NOx from managed soils and from fossil fuel combustion and biomass burning, and the subsequent redeposition of these gases and their products NH4+ and NO3- to soils and waters; and (ii) after leaching and runoff of N, mainly as NO3-, from managed soils. Total N2O emissions are given by,
N2O emissions = N2ODirect emissions + N2OIndirect emissions ………11
Direct N2O emissions – The sources included for estimation of direct N2O emissions are, synthetic N fertilizers, organic N applied as fertilizer, urine and dung N deposited on pasture, range and paddock by grazing animals, N in crop residues, N mineralization associated with loss of soil organic matter resulting from change of land use or management of mineral soils and drainage/management of organic soils.
N2ODirect -N = N2O-N N Input + N2O-N OS + N2O-N PRP ………12
Where,
N2ODirect -N = annual direct N2O-N emissions from managed soils (kg N2O-N yr-1)
N2O-N N Input = annual direct N2O-N emissions from N inputs to managed soils (kg N2O-N yr-1)
N2O-N OS = annual direct N2O-N emissions from managed organic soils (kg N2O-N yr-1)
N2O-N PRP = annual direct N2O-N emissions from urine and dung inputs to grazed soils (kg N2O-N yr-1).
N2O-N N Input = [[(FSN + FON+ FCR + FSOM) × EF1] + [FSN + FON+ FCR + FSOM)FR × EF1FR]] ……13
Where,
FSN = annual amount of synthetic fertilizer N applied to soils (kg N yr-1)
FON = annual amount of animal manure, compost, sewage sludge and other organic N additions applied to soils (kg N yr-1)
FCR = annual amount of N in crop residues (above-ground and below-ground), including N-fixing crops and from forage/pasture renewal, returned to soils (kg N yr-1)
FSOM = annual amount of N in mineral soils that is mineralized, in association with loss of soil C from soil organic matter as a result of changes to land use or management, (kg N yr-1)
EF1 = emission factor for N2O emissions from N inputs (kg N2O-N (kg N input)-1)
EF1FR is the emission factor for N2O emissions from N inputs to flooded rice (kg N2O-N (kg N input)-1).
N2O-N OS = [(FOS,CG,Temp × EF2CG, Temp) + (FOS,CG,Trop × EF2CG, Trop) + (FOS,F,Temp,NR × EF2F,Temp,NR) + (FOS,F,Temp,NP × EF2F,Temp,NP) + (FOS,F,Trop × EF2F,Trop)] ………14
Where,
EF2 = emission factor for N2O emissions from drained/managed organic soils, kg N2O-N ha-1 yr-1
The subscripts CG, F, Temp, Trop, NR and NP refer to Cropland and Grassland, Forest Land, Temperate, Tropical, Nutrient Rich, and Nutrient Poor, respectively.
N2O-N PRP = [(FPRP,CPP × EF3PRP,CPP) + (FPRP,SO × EF3PRP,SO)] ………15
Where,
FPRP = annual amount of urine and dung N deposited by grazing animals on pasture, range and paddock, kg N yr-1
EF3PRP = emission factor for N2O emissions from urine and dung N deposited on pasture, range and paddock by grazing animals, kg N2O-N (kg N input)-1
The subscripts CPP and SO refer to Cattle, Poultry and Pigs, and Sheep and other animals respectively.
FON = FAM + FSEW + FCOMP+ FOOA ………16
FAM = NMMS Avb × [1-(Frac FEED + Frac FUEL + Frac CNST)] ………17
F PRP = ∑ T [(N(T) × Nex(T) × MS (T,PRP)] ………18
Where,
FON = total annual organic N fertilizer applied to soils other than by grazing animals (kg N yr-1)
FAM = annual amount of animal manure N applied to soils (kg N yr-1)
FSEW = annual amount of total sewage N that is applied to soils (kg N yr-1)
FCOMP = annual amount of total compost N applied to soils (kg N yr-1).
NMMS Avb = amount of managed manure N available for soil application, feed, fuel or construction (kg Nyr-1)
Frac FEED = fraction of managed manure used for feed
Frac FUEL = fraction of managed manure used for fuel
Frac CNST = fraction of managed manure used for construction
N(T) = number of head of livestock species/category Tin the country
Nex(T) = annual average N excretion per head of species/category T (kg N animal-1 yr-1)
MS (T,PRP) = fraction of total annual N excretion for each livestock species/category T that is deposited on pasture, range and paddock.
Organic soils contain more than 12 to 18% of organic carbon. Indian soils are generally deficient of organic carbon (less than 1%). Only some soils in Kerala and Northeast hill regions contain higher organic carbon (5%). So the area under organic soil has been taken as nil (Bhatia et al., 2004).
Indirect N2O emissions – Sources considered for estimation of indirect N2O emissions include synthetic N fertilizers, organic N applied as fertilizer, urine and dung N deposited on pasture, range and paddock by grazing animals, N in crop residues, N mineralization associated with loss of soil organic matter resulting from change of land use or management of mineral soil. The N2O emissions from atmospheric deposition of N volatilized from managed soils is estimated by equation 19.
N2O(ATD)-N = [(FSN × Frac GASF) + ((FON + FPRP) × Frac GASM)] × EF4 ………19
Where,
N2O(ATD)-N = annual amount of N2O–N produced from atmospheric deposition of N volatilized from managed soils ( kg N2O-N yr-1)
FSN = annual amount of synthetic fertilizer N applied to soils (kg N yr-1)
Frac GASF = fraction of synthetic fertilizer N that volatilizes as NH3 and NOx (kg N volatilized (kg of N applied)-1)
FON = annual amount of managed animal manure, compost, sewage sludge and other organic N additions applied to soils (kg N yr-1)
FPRP = annual amount of urine and dung N deposited by grazing animals on pasture, range and paddock (kg N yr-1)
Frac GASM = fraction of applied organic N fertilizer materials (FON) and of urine and dung N deposited by grazing animals (FPRP) that volatilizes as NH3 and NOx (kg N volatilized (kg of N applied or deposited)-1)
EF4 = emission factor for N2O emissions from atmospheric deposition of N on soils and water surfaces (kg N-N2O (kg NH3-N + NOx-N volatilised)-1).
N2O emissions from leaching and run off in regions where leaching and runoff occurs are estimated using the equation 20.
N2O(L)-N = (FSN + FON + FPRP + FCR + FSOM) × Frac LEACH - (H) × EF5 ………20
Where,
N2O(L)-N = annual amount of N2O-N produced from leaching and runoff of N additions to managed soils in regions where leaching/runoff occurs (kg N2O-N yr-1)
FSN = annual amount of synthetic fertilizer N applied to soils in regions where leaching/runoff occurs (kg N yr-1)
FON = annual amount of managed animal manure, compost, sewage sludge and other organic N additions applied to soils in regions where leaching/runoff occurs (kg N yr-1)
FPRP = annual amount of urine and dung N deposited by grazing animals in regions where leaching/runoff occurs (kg N yr-1)
FCR = amount of N in crop residues (above- and below-ground), including N-fixing crops, and from forage/pasture renewal, returned to soils annually in regions where leaching/runoff occurs (kg N yr-1)
FSOM = annual amount of N mineralized in mineral soils associated with loss of soil C from soil organic matter as a result of changes to land use or management in regions where leaching/runoff occurs (kg N yr-1)
Frac LEACH-(H) = fraction of all N added to/mineralized in managed soils in regions where leaching/runoff occurs that is lost through leaching & runoff (kg N (kg of N additions)-1)
EF5 = emission factor for N2O emissions from N leaching and runoff (kg N2O-N (kg N leached and runoff)-1).
Conversion of N2O(ATD)-N and N2O(L)-N emissions to N2O emissions is done using the equation 21.
N2O(ATD)/(L) = N2O(ATD)/(L)-N × 44/28 ………21
Large quantities of agricultural wastes are produced from the farming systems in the form of crop residue. Burning of crop residues is not a net source of CO2 because the carbon released to the atmosphere during burning is reabsorbed during the next growing season (IPCC, 1997). However it is a significant net source of CH4, CO, NOx and N2O. In this study the emissions are calculated for two GHGs namely CH4 and N2O. Non-CO2 emissions from crop residue burning were calculated using the equation 22.
EBCR = ∑ crops (A × B × C × D × E × F) ………22
Where,
EBCR= Emissions from residue Burning
A = Crop production
B = Residue to crop ratio
C = Dry matter fraction
D = Fraction burnt
E = Fraction actually oxidized
F = Emission factor.
GHGEmissions from Livestock Sector: Major activities resulting in the emission of greenhouse gases from animal husbandry are i) enteric fermentation and ii) manure management. Enteric fermentation is a digestive process by which carbohydrates are broken down by the activity of micro-organisms into simple molecules for absorption into the blood stream. Factors like type of digestive tract, age and weight of the animal, quality and quantity of feed consumed affects the amount of CH4 released. Ruminant livestock (cattle, sheep) are the major sources of CH4 whereas moderate amounts are released from non-ruminant livestock (pigs, horses). CH4 emissions from enteric fermentation is calculated using equation 23,
Emissions = EF(T) × N(T) × 10-6 ………23
Where,
Emissions = methane emissions from Enteric Fermentation (Gg CH4 yr-1)
EF(T) = emission factor for the defined livestock population (kg CH4 head-1 yr-1)
N(T) = the number of head of livestock species / category T
T = species/category of livestock
To estimate the total emissions from enteric fermentation, the emissions from different categories and sub-categories are summed together.
Methane emissions from manure management is calculated using the equation 24,
Emissions = EF(T) × N(T) × 10-6 ………24
Where,
Emissions = methane emissions from manure management (Gg CH4 yr-1)
EF(T) = emission factor for the defined livestock population (kg CH4 head-1 yr-1)
N(T) = the number of head of livestock species / category T
T = species/category of livestock
Nitrous oxide emissions from manure management is calculated through equation 25,
Emissions = EF(T) × N(T) × N-excretion × 10-6 ………25
Where,
Emissions = nitrous oxide emissions from manure management (Gg CH4 yr-1)
EF(T) = emission factor for the defined livestock population (kg N head-1 yr-1)
N(T) = the number of head of livestock species / category T
T = species/category of livestock
N-excretion = nitrogen excretion value for the livestock (kg head-1 yr-1)
Table 8: Methane emission factors used to calculate emissions from livestock management
Livestock |
EF for Enteric Fermentation
(kg CH4/head/year) a |
EF for Manure management
(kg CH4/head/year) a |
Dairy cattle |
46 |
3.6 |
Non dairy cattle |
25 |
2.7 |
Young cattle |
25 |
1.8 |
Buffaloes |
55 |
4 |
Sheep |
5 |
0.3 |
Goats |
5 |
0.2 |
Pigs |
1 |
4 |
Horses and ponies |
18 |
1.6 |
Source: a Revised 1996 IPCC Guidelines for National Greenhouse Gas Inventories (IPCC, 1997), Gurjar et al., 2004
CH4 and N2O emission factors used in this study are shown in the table 8. N2O emissions from manure management, for livestock species of dairy cattle, non-dairy cattle, young cattle and buffaloes, nitrogen excretion rates are taken as 60, 40, 25 and 46.5 kg/head/yr respectively.
GHG Emissions from Waste Sector: Methane (CH4) is the major greenhouse gas emitted from the waste sector. Three major categories are considered in this study: Municipal solid waste disposal, domestic waste water and industrial waste water. Considerable amounts of methane (CH4) are produced from the treatment and disposal of municipal solid waste. CH4 produced at solid waste disposal sites (SWDS) contributes approximately 3-4% to the annual global anthropogenic greenhouse gas emissions (IPCC, 2001). The IPCC method for estimating CH4 emissions from SWDS is based on the First Order Decay (FOD) method which assumes that CH4 and CO2 are formed when the degradable organic component in waste decays slowly throughout a few decades. No method is provided for N2O emissions from SWDS because they are not significant. Emissions of CH4 from waste deposited in a disposal site are highest in the first few years after deposition, and then the bacteria responsible for decay consumes the degradable carbon in the waste due to which the emission decreases (IPCC, 2006). CH4 emissions from solid waste disposal system is calculated by equation 26,
Emissions CH4 = [MSW × MCF × DOC × DOC f × F ×16/12] - R] × (1 - OF) .........26
Where,
MSW = mass of waste deposited (Gg/yr)
MCF = methane correction factor for aerobic decomposition in the year of deposition (fraction)
DOC = Degradable Organic Carbon in the year of deposition (Gg C/Gg waste)
DOC f = fraction of Degradable Organic Carbon which decomposes (fraction)
F = fraction of CH4 in generated landfill gas (fraction)
R = methane recovery (Gg/yr)
16/12 = molecular weight ratio CH4/C (ratio)
OF = oxidation factor (fraction).
Methane (CH4) correction factor (MCF) accounts for the fact that unmanaged SWDS produce less CH4 from a given amount of waste than anaerobic managed SWDS. MCF of 0.4 is used in this study for unmanaged and shallow landfills (IPCC, 2006). Degradable Organic Carbon value of 0.11 is obtained from (NEERI, 2005), fraction of degradable organic carbon that decomposes (DOC f) is taken as 0.5 (IPCC, 2006), fraction of CH4 (F) in generated landfill gas is taken as 0.5 (IPCC, 2006) and it is considered that the there is no CH4 recovery in the disposal sites in the major cities and oxidation factor is taken as zero for unmanaged and uncategorized solid waste disposal system.
When treated or disposed anaerobically, wastewater can be a source of methane (CH4) and also nitrous oxide (N2O) emissions. Domestic, commercial and industrial sectors are the sources of wastewater. The waste water generated may be treated on site or in a centralized plant or disposed untreated nearby to water bodies. Wastewater in closed underground sewers is not believed to be a significant source of CH4. The waste water in open sewers will be subjected to heating from the sun and the sewer conditions may be stagnant causing anaerobic conditions to emit CH4 (Nicholas. 2006). There is a variation in the degree of wastewater treatment in most developing countries. Domestic wastewater is treated in centralized plants, septic systems or may be disposed of in unmanaged lagoons or waterways, via open or closed sewers. Though the major industrial facilities may have comprehensive onsite treatment, in few of the cases industrial wastewater is discharged directly into the water bodies (IPCC, 2006).
The extent of CH4 production depends primarily on the quantity of degradable organic material in the wastewater, the temperature and the type of treatment system. More CH4 is yielded from wastewater with higher COD or BOD concentrations when compared to wastewater with lower COD or BOD concentrations. Rise in temperature will also increase the rate of CH4 production. N2O is associated with the degradation of nitrogen components (urea, nitrate and protein) in the wastewater. Domestic wastewater mainly includes human sewage mixed with other household wastewater, from sources such as effluent from shower drains, sink drains, washing machines, etc. (IPCC, 2006). The equation used to estimate CH4 emissions from domestic wastewater is given by equation 27,
CH4 emissions = [ ∑ i,j (Ui × Ti,j × EFj)] (TOW – S ) – R ………27
Where,
CH4 Emissions = CH4 emissions in inventory year (kg CH4/yr)
TOW = total organics in wastewater in inventory year (kg BOD/yr)
S = organic component removed as sludge in inventory year (kg BOD/yr)
Ui = fraction of population in income group i in inventory year
Ti,j = degree of utilization of treatment/discharge pathway or system, j, for each income group fraction i in inventory year
i = income group: rural, urban high income and urban low income
j = each treatment/discharge pathway or system
EFj = emission factor (kg CH4/kg BOD)
R = amount of CH4 recovered in inventory year (kg CH4/yr).
Emission factor (EFj) is calculated using the below equation 28,
EFj = Bo × MCFj ………28
Where,
EFj = emission factor (kg CH4/kg BOD)
j = each treatment/discharge pathway or system
Bo = maximum CH4 producing capacity (kg CH4/kg BOD)
MCFj = methane correction factor (fraction).
The total amount of organically degradable material in the wastewater (TOW) is a function of human population and BOD generation per person. It is expressed in terms of biochemical oxygen demand (kg BOD/year) and is given by equation 29,
TOW = P × BOD × 0.001 × I × 365 ………29
Where,
TOW = total organics in wastewater in inventory year (kg BOD/yr)
P = country population in inventory year (person)
BOD = country-specific per capita BOD in inventory year (g/person/day)
0.001 = conversion from grams BOD to kg BOD
I = correction factor for additional industrial BOD discharged into sewers (for collected the default is 1.25 and for uncollected default is 1.00).
Nitrous oxide (N2O) emissions can occur as both direct and indirect emissions. Direct emissions are from the treatment plants and indirect emissions from wastewater after disposal of effluent into waterways, lakes or the sea. Direct emissions of N2O may be generated during both nitrification and denitrification of the nitrogen present (IPCC, 2006). The equation for estimating N2O emissions from wastewater effluent is given by equation 30,
N2O emissions = N effluent × EF effluent × 44/28 ………30
Where,
N2O emissions = N2O emissions in inventory year (kg N2O/yr)
N effluent = nitrogen in the effluent discharged to aquatic environments (kg N/yr)
EF effluent = emission factor for N2O emissions from discharged to wastewater (kg N2O-N/kg N).
44/28 = conversion of kg N2O-N into kg N2O.
EF effluent of 0.005 kg N2O -N/kg N is used in this study (default value: IPCC, 2006).
The equation for Total Nitrogen in the effluentis given by equation 31,
N effluent = (P × Protein × F NPR × F NON – CON × F IND – COM) – N sludge ………31
Where,
N effluent = total annual amount of nitrogen in the wastewater effluent (kg N/yr)
P = human population
Protein = annual per capita protein consumption (kg/person/yr)
F NPR = fraction of nitrogen in protein (kg N/kg protein)
F NON-CON = factor for non-consumed protein added to the wastewater
F IND-COM = factor for industrial and commercial co-discharged protein into the sewer system
N sludge = nitrogen removed with sludge (kg N/yr).
Per capita protein consumption (Pr) value is taken as 21.462 (Nutritional Intake in India, 2009-10), fraction of nitrogen in protein (F NPR), fraction of non-consumption protein (F NON-CON) and fraction of industrial and commercial co-discharged protein (F IND-COM) values are taken as 0.16 kg N/kg protein, 1.4 (fraction) and 1.25 (fraction) respectively (IPCC, 2006).
Industrial wastewater may be treated on site by the industries or can be discharged into domestic sewer systems. The emissions are included in domestic wastewater emissions, if it is released into the domestic sewer system. Methane is produced only from industrial wastewater with significant carbon loading that is treated under intended or unintended anaerobic conditions (IPCC, 2006). Major industrial waste water sources having high CH4 production potential are pulp and paper manufacture, meat and poultry industry, alcohol, beer and starch production, organic chemicals production and food and drink processing industries. In this study industrial waste water emissions are calculated based on the data availability from the industries located within the city limits. Method for estimation of CH4 emissions from on-site industrial wastewater treatment is given in equation 32,
CH4 emissions = ∑ i (TOWi – Si) EFi – Ri ………32
Where,
CH4 Emissions = CH4 emissions in inventory year (kg CH4/yr)
TOWi = total organically degradable material in wastewater from industry i in inventory year (kg COD/yr)
i = industrial sector
Si = organic component removed as sludge in inventory year (kg COD/yr)
EFi = emission factor for industry i, kg CH4/kg COD for treatment/discharge pathway or system(s) used in inventory year.
If more than one treatment practice is used in an industry then weighted average is taken for this factor.
Ri = amount of CH4 recovered in inventory year, kg CH4/yr.
Emission factor (EFj) for each treatment/discharge pathway or system is calculated using the equation 33,
EFj = Bo × MCFj ………33
Where,
EFj = emission factor for each treatment/discharge pathway or system (kg CH4/kg COD)
j = each treatment/discharge pathway or system
Bo = maximum CH4 producing capacity (kg CH4/kg COD)
MCFj = methane correction factor (fraction).
The total amount of organically degradable material in the wastewater (TOW) is a function of industrial output (product) P (tons/yr), wastewater generation W (m3/ton of product) and degradable organics concentration in the wastewater COD (kg COD/m3).
TOW = P × BOD × 0.001 × I × 365 ………34
Where,
TOW = total organically degradable material in wastewater for industry ‘i’ (kg COD/yr)
i = industrial sector
Pi = total industrial product for industrial sector ‘i’ (t/yr)
Wi = wastewater generated (m3/t product)
CODi = chemical oxygen demand (kg COD/m3).