|
Introduction
Greenhouse gases are those gaseous constituents of the atmosphere, both natural and anthropogenic, that absorb and emit radiation at specific wavelengths within the spectrum of thermal infrared radiation emitted by the Earth’s surface, the atmosphere itself, and by clouds (IPCC, 2007a,b). Concentration of greenhouse gases (GHG’s) in the atmosphere has increased rapidly due to anthropogenic activities resulting in significant increase in the temperature of the earth. The energy radiated from the sun is absorbed by these gases making the lower part of the atmosphere warmer. This phenomenon is known as natural greenhouse gas effect whereas enhanced greenhouse effect is an added effect caused due to the human activities, by these gases present in the atmosphere. Increase in the concentration of these greenhouse gases results in global warming. Atmospheric concentrations of GHG gases have increased due to increasing emissions of GHGs during post industrialization era due to human activities. Carbon dioxide (CO2), methane (CH4) and nitrous oxide (N2O), are the major greenhouse gases. Among the GHG’s, carbon dioxide is the most dominant gas causing global warming which accounts for nearly 77% of global total CO2 equivalent GHG emissions (IPCC 2007b).
In 1958, attempts were made towards the high-accuracy measurements of atmospheric CO2 concentration and documented the changing composition of the atmosphere with the time series data (Keeling, 1961, 1998). The increasing abundances of two other major greenhouse gases, methane (CH4) and nitrous oxide (N2O) in the atmosphere have been reported (Steele, 1996). Methane levels were found to rise at a rate of about 1% per year (Graedel and McRae, 1980; Fraser et al., 1981; Blake et al., 1982) but then during 1990s its rate retarded to an average increase of 0.4% per year (Dlugokencky et al., 1998). The increase in the concentration of other greenhouse gas N2O is smaller, found to be about 0.25% per year (Weiss, 1981; Khalil and Rasmussen, 1988). Second class of greenhouse gases - the synthetic HFCs, PFCs, SF6, CFCs, and halons did not exist in the atmosphere before the 20th century (Butler et al., 1999). CF4, a PFC, is detected in ice cores and appears to have an extremely small natural source (Harnisch and Eisenhauer, 1998).
Carbon Dioxide (CO2) Emissions: CO2 abundance was found to be significantly lower during the last ice age than over the last 10000 years of the Holocene as per the initial measurements (Delmas et al., 1980; Berner et al., 1980; Neftel, 1982). CO2 abundances ranged between 280 ± 20 ppm from past 10000 years present up to the year 1750 (Indermuhle, 1999). There was an exponential increase of CO2 abundance during the industrial era to 367 ppm in 1999 (Neftel et al., 1985; Etheridge, 1996; Houghton et al., 1992; IPCC, 1996, 1998, 2000, 2001, 2001a) and to 379 ppm (in 2005).
Methane (CH4) Emissions: Anthropogenic activities like fossil fuel production, enteric fermentation in livestock, manure management, cultivation of rice, biomass burning, and waste management releases methane to the atmosphere to a significant extent. Estimates indicate that human related activities release more than 50% of global methane emissions (EPA, 2010). Natural sources of methane include wetlands, permafrost, oceans, freshwater bodies, non-wetland soils, and other sources such as wildfires. Accelerating rise in methane and nitrous oxide concentrations were reported during the 20th century (Machida, 1995; Battle, 1996) and constant abundance of 700 ppb until the 19th century. A steady increase brought methane abundances to 1745 ppb in 1998 (IPCC, 2001a; 2003) and 1774 ppb in 2005 (IPCC, 2006).
Nitrous Oxide (N2O) Emissions: Nitrous oxide (N2O) is produced by both natural sources and human-related activities. Agricultural soil management, animal manure management, sewage treatment, mobile and stationary combustion of fossil fuel and nitric acid production are the major anthropogenic sources. Nitrous oxide is also produced naturally from a wide variety of biological sources in soil and water, particularly from microbial action (EPA., 2010). From the measurements for N2O it is found that the relative increase during the industrial period is smaller (15%). The analysis showed a concentration of 314 ppb in 1998 (IPCC, 2001a), rising to 319 ppb in 2005.
The climate system is a complicated, inter-related system consisting of the atmosphere, land surface, snow and ice, oceans and other bodies of water and living things (Le Treut et al., 2007; Bouwman, 1990; Bronson et al., 1997). Climate change is a serious threat to the global community. Rising global temperatures will affect the local climatic conditions and also melt the fresh water ice glaciers causing the sea levels to rise. There is universal scientific understanding that earth’s climate is changed by the greenhouse gas emissions generated by human activity (Anthony et al., 2006). Surface air temperature is the parameter generally taken into account for climate change. Extensive studies have been carried out to study the pattern of global and regional mean temperature with respect to time (Hasselmann, 1993; Schlesinger and Ramankutty, 1994; North and Kim, 1995). The atmospheric concentrations of carbon dioxide equivalent with the possibility of rise in global temperatures beyond certain levels were reported earlier (Stern 1996). The recent (globally averaged) warming by 0.5°C is partly attributable to such anthropogenic emissions (Anthony et al., 2006). Change in climate also results in extreme weather events like very high temperatures, droughts and storms, thermal stress, flooding and infectious diseases. In the last 100 years the mean annual surface air temperature has increased by 0.4-0.6°C in India (Hingane et al., 1985; Kumar et al., 2002). This necessitates understanding the sources of global greenhouse gas emissions to implement appropriate mitigation measures.
1.1 CARBON EMISSIONS AND ECONOMIC GROWTH
The transition to a very low carbon economy needs elementary changes in technology, regulatory frameworks, infrastructure, business practices, consumption patterns and lifestyles (McKinnon et al., 2010; Benjamin, 2009). Over the past decade, the emission of greenhouse gases into the atmosphere has caused a concern over global warming with efforts focusing on minimizing the emissions. Heavy industries are transferred to knowledge-based and service industries which are relatively cleaner as the economic development continues (Shafik and Bandyopadhyaya, 1992) and at advanced levels of growth, there was a gradual decrease of environmental degradation because of increased environmental awareness and enforcement of environmental regulation (Stern et al., 1996). There is a need for a target to be set which aids the local and national governments to frame climate change policies and regulations. Carbon dioxide emissions and energy consumption are closely correlated with the size of a country’s economy (Cook, 1971; Humphrey et al., 1984; Goldemberg, 1995; Benjamin, 2009). Carbon intensity is one of the most important indicators which help in measuring a country's CO2 emission with respect to its economic growth. Carbon intensity refers to the ratio of carbon dioxide emissions per unit of economic activity, usually measured as GDP. It presents clear understanding of the impact of the factors that are responsible for emissions and also helps the policy makers in formulating future energy strategies and emission reduction policies (Ying et al., 2007). The analysis of changes in carbon intensity in developing countries helps in optimizing fuel-mix and economic structure; meanwhile it also provides detailed information on the mitigation in the growth of energy consumption and related CO2 emissions.
Carbon intensity value drops if there is a decrease in emissions or sharp rise in the economic growth of the country. Carbon dioxide emissions resulting from the consumption of energy from the major countries were compiled from published literatures (International Energy Statistics, United States Energy Information Administration, EIA). Economic growth represented in terms of constant US $2000 is obtained from the World Bank (http://worldbank.org). GDP in domestic currencies were converted using 2000 official exchange rates. Figure 1.1 illustrates the carbon intensity trend across major carbon players in the globe. India’s overall carbon intensity of energy use has marginally decreased in recent years despite coal’s dominance. Strong penetrations of wind capacity and efficiency improvements in coal-based electricity production are some factors that are responsible for the decline of carbon intensity (Rao and Reddy, 2007; Rao et al., 2009).
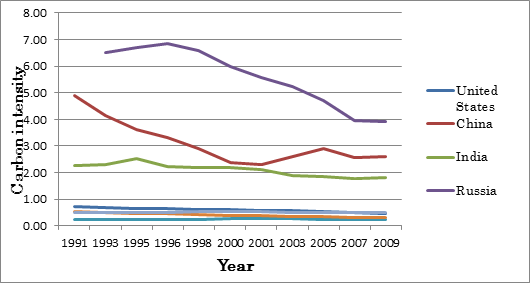
Fig 1.1: Carbon intensity across the countries (kg CO2/constant US $)
Many organizations and governments are looking for strategies to reduce emissions from greenhouse gases from anthropogenic origin, responsible for global warming (Kennedy et al., 2009; 2010). The increasing interest in carbon footprint assessment comes as a result of growing public awareness of global warming. The global community now recognizes the need to reduce greenhouse gas emissions to mitigate climate change (Jessica, 2008). Many global metropolitan cities and organizations are estimating their greenhouse gas emissions and developing strategies to reduce their emissions.
“Carbon footprint” is defined as a measure of the impact of human activities on the environment in terms of the amount of greenhouse gases produced. The total greenhouse gas emissions from various anthropogenic activities from a particular region are expressed in terms of carbon dioxide equivalent, which indicate the carbon footprint of that region (Andrew, 2008). Carbon dioxide equivalent (CO2e) is a unit for comparing the radiative forcing of a GHG (measure of influence of a climatic factor in changing the balance of energy radiation in the atmosphere) to that of carbon dioxide (ISO 14064-1, 2006, 2006a, 2006b). It is the amount of carbon dioxide by weight that is emitted into the atmosphere that would produce the same estimated radiative forcing as a given weight of another radiatively active gas.
Carbon dioxide equivalents are calculated by multiplying the weight of the gas being measured by its respective global warming potential (GWP). It is a relative measure of how much heat a greenhouse gas traps in the atmosphere. It compares the amount of heat trapped by a certain mass of the gas in question to the amount of heat trapped by a similar mass of carbon dioxide. As defined by the Intergovernmental Panel on Climate Change (IPCC), a GWP is an indicator that reflects the relative effect of a greenhouse gas in terms of climate change considering a fixed time period, such as 100 years (GWP100). GWP is expressed as a factor of carbon dioxide (whose GWP is standardized to 1). GWP depends on factors such as absorption of infrared radiation by a given species, spectral location of its absorbing wavelengths and the atmospheric lifetime of the species (Matthew, 1999). The Global warming potentials of major greenhouse gases over the next 20 years (http://unfccc.int/; The Science of Climate Change: Summary for Policymakers, 1995) are 1 for CO2, 25 for CH4, 298 for nitrous oxide (IPCC, 2007a,b).
Need for Estimation of Carbon Footprint: Carbon footprints have the potential to reduce the impact on climate change by increasing consumer awareness and fostering discussions about the environmental impacts of products. It offers valuable information for the sustainable urban planning for policy makers and the local municipalities (Bhatia, 2008, Carbon Trust, 2007a,b; Courchene and Allan, 2008; Hammond, 2007; Hoornweg, et al., 2011; Laurence, et al., 2011).
1.3 CARBON FOOTPRINT STUDY IN CITIES
Emissions of greenhouse gas emissions at city levels with the detailed analysis of per capita GHG emissions for several large cities helps in evolving appropriate mitigation measures and resource efficiency (Hoornweg et al., 2011). Kennedy et al., 2009 and Kennedy et al., 2010 developed a method for comparing emissions resulting from electricity consumption, heating and industrial fuel use, transportation and waste sectors across the 10 global cities. Similar studies by Benjamin Sovacool and Marilyn Brown (2009) provide comparative account of carbon footprint in metropolitan areas with suggestions for policymakers and planners regarding policy implications. Assessment of carbon footprint is being used for management of climate change and mitigate changes in climate at local levels. Studies on carbon footprint of Norwegian municipalities are calculated and are related with the factors of size and wealth (Hogne et al., 2010).
1.4 SECTOR WISE ASSESSMENT OF GHG EMISSIONS IN INDIA: REVIEW
GHG Emissions in Electricity Generation sector in India: GHG emissions from electricity use occur during the generation of the electricity. Earlier studies have estimated the emission of gases due to power generation (Gurjar et al, 2004; Raghuvanshi et al., 2006; Chakraborty et al., 2007; Weisser, 2007; Kennedy et al., 2009; Shobhakar, 2009; Kennedy et al., 2010; Chun Ma et al., 2011, Qader et al., 2009; POST 2006). India’s reliance on fossil-fuel based electricity generation has aggravated the problem of high carbon dioxide (CO2) emissions from combustion of fossil fuels, primarily coal, in the country’s energy sector. Combustion of coal at thermal power plants emits mainly carbon dioxide (CO2), sulphur oxides (SOx), nitrogen oxides (NOx), other trace gases and air borne inorganic particulates, such as fly ash and suspended particulate matter. Inventory of carbon dioxide emissions from coal based power generation in India are carried out from the present energy generation and the projections are done for next 2 decades (Raghuvanshi et al, 2006). A comprehensive emission inventory for megacity Delhi, India for the period 1990-2000 has been developed in which major CO2 emissions were found from the power plants. Electricity generation, transport, domestic, industrial processes, agriculture emissions and waste treatment were the major sectors for which the emission inventories are done (Gurjar et al., 2004, 2010).
Measurements of CO2 and other gases from coal based thermal power plants in India was done and the emission rates of the GHGs was found to be depended on factors like quality of coal mixture/oil, quantity used for per unit generation, age of the plant and amount of excess air fed into the furnace (Chakraborty et al., 2007). Study of large point source (LPS) emissions from India was carried out (Garg et al., 2001) for 1990 and 1995 using IPCC 1996 method, which showed CO2 and SO2 emissions being the major gases from the power plants.
GHG Emissions in Domestic and Commercial Sectors: Emissions from households and commercial establishments occur due to energy consumption for cooking, lighting, heating and household appliances. Studies are carried out using input-output analysis and aggregated household expenditure survey data to calculate the CO2 emissions from energy consumption for different groups of households for the year 1989-1990 (BSI, 2008; Murthy et al., 1997a, b; Pachauri and Spreng, 2002; Pachauri, 2004; Parikh et al., 1997; INCCA, 2010; Garg et al., 2004, 2006, 2011). In 2007, at the national level, the residential sector emitted 137.84 million tons of CO2 equivalents and the commercial sector emitted 1.67 million tons of CO2 equivalent (INCCA, 2010). City level emission inventory for key sectors are carried out and household sector was responsible for a major portion of emissions, due to which it is a target sector for emission reduction targets which can be achieved in both existing and new housing which increases energy efficiency (Gupta, 2006, Reddy and Srinivas, 2009).
GHG Emissions in Transportation Sector: Emissions from the road transport sector are directly related to the quantities of gasoline and diesel consumption and the increase in emissions has been due to an increase both in the number of motor vehicles on the road and the distance these vehicles travel (Anil Singh et al., 2008). Traffic composition of six mega cities of India (Delhi, Mumbai, Kolkata, Chennai, Bangalore and Hyderabad) shows that there is significant shift from the share of slow moving vehicles to fast moving vehicles and public transport to private transport (Jalihal et al., 2005; Jalihal and Reddy, 2006). Various studies have been carried out in India with regard to the emissions resulting from transportation sector (Bhattacharya and Mitra, 1998; Ramanathan, 1975; Ramanathan and Parikh, 1999; MiEF, 2004). Trends of energy consumption and consequent emissions of greenhouse gases such as CO2, CH4 and N2O and ozone precursor gases like CO, NOx and NMVOC in the road transport sector in India for the period from 1980 to 2000 have been studied and efforts being made to apportion the fuels, both diesel and gasoline, across different categories of vehicles operating on the Indian roads (Anil Singh et al., 2008; Ramachandra and Shwetmala, 2009) and are the major sources of air pollutants in urban areas (Gurjar et al., 2004; Das et al., 2004; Gurjar et al., 2010).
Estimation of emissions from vehicles has been studied using various model calculations (Goyal and Ramakrishna, 1998). There are studies that are carried out which calculate the emissions on the basis of the activity data, vehicle kilometer travelled, vehicle category and sub category (Ramanath and Parikh, 1999; CPCB, 2007; Mittal and Sharma, 2003; ALGAS, 1998; ADB, 2006; Baidya and Borken Kleefeld, 2009). Emission factors for Indian vehicles have been developed by the Automotive Research Association of India in co-ordination with MoEF, CPCB and State Pollution Control Boards (ARAI, 2007). Inventory estimates for the emissions of greenhouse gases and other pollutants and effects of vehicular emission on urban air quality and human health are studied in major urbanized cities in India (Sharma et al, 1995; Sharma and Pundir. 2008; Gurjar et al., 2004; Ghose et al, 2004; Ravindra et al., 2006; Jalihal et al., 2006).
GHG Emissions in Industrial Sector: Industry is a major source of global greenhouse gas emissions. Industrial sector is responsible for approximately one-third of global carbon dioxide emissions through energy use (William, 1996). In India, emission estimates from large point sources such as thermal power, steel industry, cement plants, chemical production and other industries are carried out by various researchers (Mitra, 1992; Mitra et al., 1999; Garg et al., 2001; 2004; Mitra and Bhattacharya, 2002; Gurjar et al., 2004; Garg et al., 2006). CO2 emissions from iron and steel, cement, fertilizer and other industries like lime production, Ferro alloy production and aluminum production have been estimated (Garg et al., 2006; 2011).
Six industries in India have been identified as energy-intensive industries: Aluminum, cement, fertilizer, iron and steel, glass, and paper. The cement sector holds a considerable share within these energy-intensive industries (Schumacher et al., 1999; Bernstein et al., 2007). At the country level, trends of greenhouse gas emissions from industrial processes are studied which shows 24,510 CO2 equivalent emissions in the year 1990, 102,710 CO2 equivalent emissions in 1994 and 168,378 CO2 equivalent emissions in 2000 and 189,987.86 CO2 equivalent emissions in 2007 (Sharma et al., 2009, 2011; Kumar, 2003). Under the aegis of INCCA, a national-level GHG inventory for CO2, CH4 and N2O inventory was published in 2010 for the base year 2007 which showed from industrial processes and product use (Sharma et al., 2011).
GHG Emissions in Agriculture Sector: Agricultural activities contribute directly to emissions of greenhouse gases through a variety of processes. The major agricultural sources of GHGs are methane (CH4) emissions from irrigated rice production, nitrous oxide (N2O) emissions from the use of nitrogenous fertilizers, and the release of carbon dioxide (CO2) from energy sources used to pump groundwater for irrigation (Nelson et al., 2009). Where there is open burning associated with agricultural practices, a number of greenhouse gases are emitted from combustion. All burning of biomass produces substantial CO2 emissions. In India the crop waste generated in the fields is used as feed for cattle, domestic biofuel and remainder is burnt in the field (Reddy et al., 2002). Rice paddy soils contain organic substrates, nutrients and water, thereby resulting to be an increasing source of methane resulting from anaerobic decomposition of carbonaceous substances (Alexander,1961). The anaerobic bacterial processes in the irrigated rice cultivated fields are considered to be among the largest sources of methane emission (Sass & Fisher 1998) and the annual global contribution of methane is estimated to be ~190 Tgy-1 (Koyama,1963; Yanyu et al., 2006).
During recent years, several studies on CH4 emission from Indian rice fields have been carried out by different researchers to study the effect of soil type, season, water regime, organic and inorganic amendments and cultivars (Parashar et al., 1991; Mitra, 1992; Parashar et al., 1993; Parashar et al., 1994; Adhya et al., 1994; Sinha, 1995; Mitra et al., 1999; Chakraborty et al., 2000, 2007; Jain et al., 2000; Khosa et al., 2010). Average methane flux varied significantly with different cultivars ranging between 0.65 and 1.12 mg m-2 h-1 (Mitra et al., 1999). CH4 emissions from Indian rice paddies, therefore, is estimated to be 3.6±1.4 Tgy-1, which is lower than 4.2 (1.3 to 5.1) Tgy-1 obtained using the IPCC 1996 default emission factors (Gupta et al., 2009). India emitted 3.3 million tons of CH4 in 2007 from 43.62 million ha cultivated (Gupta, 2005; MoA, 2008; INCCA, 2010). Application of fertilizer-N in upland irrigated rice has led to increased N2O emissions (Kumar et al., 2000; Majumdar et al., 2000; Ghosh et al, 2003; Garg et al., 2004, 2006). Total seasonal N2O emission from different treatments ranged from 0.037 to 0.186 kg ha-1 (Ghosh et al., 2003; Aggarwal et al., 2003; Bhatia et al., 2008; Bhatia, 2008; INCCA, 2010).
GHG Emissions in Livestock Sector: There are two major sources of methane emission from livestock: Enteric fermentation resulting from digestive process of ruminants and from animal waste management (IPCC, 2006; Bandyopadhyay et al., 1996). Animal husbandry accounts for 18% of GHG emissions that cause global warming (Naqvi and Sejian, 2011). Methane emission from enteric fermentation from Indian livestock ranged from 7.26 to 10.4 MT/year (Garg and Shukla, 2002). In India more than 90% of the total methane emission from enteric fermentation is being contributed by the large ruminants (cattle and buffalo) and rest from small ruminants and others (Swamy and Bhattacharya, 2006). Production and emission of CH4 and N2O from manure depends on digestibility and composition of feed, species of animals and their physiology, manure management practices and meteorological conditions like sunlight, temperature, precipitation, wind, etc. (Gaur et al., 1984; Yamulki et al., 1999).
In India, various studies have been carried out in which the emission inventories for enteric fermentation and manure management are done at the national level (Garg et al., 2001; Naqvi and Sejian, 2001; Gurjar et al., 2004; Gupta et al., 2009; Garg et al., 2011). Total emission of methane from Indian livestock was estimated as 10.08 MT considering different categories of ruminants and type of feed resources available in different zone of the country (Singhal et al., 2005). CH4 and N2O country specific emission factors for bovines were found to be lower than IPCC-1996 default values. Inventory estimates were found to about 698 ± 27 Gg CH4 from all manure management systems and 2.3 ± 0.46 tons of N2O from solid storage of manure for the year 2000 (Gupta et al., 2009). Using the emission factors provided in the report (NATCOM, 2004), it is estimated that the Indian livestock emitted 9.65 million tons in 2007. Buffalo is the single largest emitter of CH4, as it constitutes 60% of the total CH4 emission from this category, simply because of its large number compared to any other livestock species and also because of the large CH4 emission factor with respect to others (INCCA, 2010). By using the IPCC guidelines, the total CH4 emitted from enteric fermentation in livestock is found to be 10.09 million tons and emissions from manure management is estimated about 0.115 million tons of CH4 and 0.07 thousand tons of N2O are emitted (INCCA, 2010).
GHG Emissions Inventory in Waste Sector: The main greenhouse gases emitted from waste management is CH4. It is produced and released into the atmosphere as a by-product of the anaerobic decomposition of solid waste, where-by methanogenic bacteria break down organic matter in the waste. Similarly, wastewater becomes a source of CH4 when treated or disposed anaerobically. It can also be a source of N2O emissions as well due to protein content in domestically generated waste water (INCCA, 2010; Hogne, et al., 2010; Marlies et al., 2009). Industrial wastewater with significant carbon loading that is treated under intended or unintended anaerobic conditions will produce CH4 (IPCC, 2006).
Waste landfills are considered to be largest source of anthropogenic emissions and the methane emissions from the landfill is estimated to account for 3-19% of the anthropogenic sources in the world (IPCC, 1996). Landfill gas, a mix of primarily CO2 and CH4, is emitted as a result of the restricted availability of oxygen during the decomposition of organic fraction of waste in landfills (Talyan et al., 2007). Methane emissions are estimated for a particular landfill site or for a region in India (Kumar et al., 2000; Gurjar et al., 2004; Ramachandra and Bachamanda, 2007; Subhasish et al., 2009; Kumar et al., 2004, 2009; Rawat and Ramanathan, 2011).
CH4 emission estimates were found to be about 0.12 Gg in Chennai from municipal solid waste management for the year 2000 which is lower than the value computed using IPCC, 1996 (IPCC, 1996). The existing situation of municipal solid waste management in major cities in India are assessed and parameters like waste quantity generated, waste generation rate, physical composition and characterization of MSW in each of the cities are carried out (Kumar et al., 2009). Solid waste generated in Indian cities increased from 6 Tg in 1947 to 48 Tg in 1997 (Pachauri and Sridharan, 1998) with per capita increase of 1-1.33% per year (Rao and Shantaram, 2003). As per INCCA (2010), 604.51 Gg of CH4 was emitted from solid waste disposal sites in India.
Methane is generated from two categories of waste water - domestic and industrial. The main factor in determining the extent of CH4 production is the amount of degradable organic fraction in the wastewater (Fadel et al., 2001) that is commonly expressed in terms of biochemical or chemical oxygen demand (BOD) or (COD). Methane emissions from disposal and treatment of industrial and municipal solid waste (MSW) are not a prominent source in India, except in large urban centers. In India, methane emissions from domestic/commercial and industrial waste water are found to be 861 Gg and 1050 Gg respectively for the year 2007 and about 15.81 Gg of nitrous oxide is emitted from domestic/commercial waste water sector (Garg et al., 2001; Sharma et al., 2011).
Sector-wise review highlights of fragmented efforts in assessing the carbon footprint In India and there are no comprehensive effort to assess the carbon footprint considering all sectors in the rapidly urbanizing cities, which is vital for evolving appropriate city specific mitigation measures. Objectives of the current communication are to quantify and analyse sector-wise greenhouse gas emissions in terms of Carbon dioxide equivalent (CO2 eq) across major cities in India.
The next section (Section 2) presents methods for quantifying carbon footprint for electricity, domestic, industry, transportation, agriculture, livestock and waste sectors apart from providing a brief account of cities chosen for the current study. Section 3 provides a detailed account of sector wise carbon footprint for major cities in India with synthesis of intercity variations. This is followed by conclusions (section 4) and gaps in the current study (section 5). Annexure I details sector-wise carbon footprint for major cities in India
|