|
Trends of commuting CO2 emissions in Chinese and Indian cities and their global impacts
4.1 Overview of Xi’an and Bangalore
The basic information of Xi’an and Bangalore is shown in Table 5.
4.1.1 Rapid growth in the economic, urbanization, and motorization
In Xi’an, the GDP increased from US$ 10.55 billion in 2000 to US$ 71.29 billion in 2012.
Now, Xi’an ranks the 13th among Chinese cities (JLL 2015). In Bangalore, from 2000 to
2013, the GDP continued increasing except in 2009 (Glastris 2013). In 2011, the GDP of
Bangalore was US$ 83 billion, and now, Bangalore ranks the sixth among Indian cities
(Indiancn 2013). Xi’an’s leading industries are cultural activities, high technology, and
equipment manufacturing. Bangalore’s economy is prospering on the information technology
(IT) industry, which contributes ca. 74 % to the city’s revenues in the year 2000 to 2001
(Parthasarathy 2004). Bangalore has been economically and socially fragmented due to the gap
in income between the workers of IT sectors and local industries (Sabapathy et al. 2012).
In 2010, the built-up area in Xi’an reached 522.28 km2 , 37 times of the area in 1949(Xu 2012). The city area of Bangalore is now 741 km2, grown about 10 times since1949 (Ramachandra et al. 2012). In Xi’an urban central area, the population was 3.09
million in 2003 and increased to 4.48 million in 2014. Similarly, the population of
Bangalore increased from 4.13 million in 1991, 5.68 million in 2001, to about 9.58 million
in 2014 (Ramachandra et al. 2012).
Urban area (km2) Population (million) GDP (US$ billion) Per capita income (US$)
Xi’ana |
522 |
4.48 |
71 |
10,905 |
Bangaloreb |
741 |
9.58 |
83 |
10,247 |
|
City rankingc |
Commuters by bus |
Metro passengers |
Number of buses |
|
|
(million person |
(million person |
|
|
|
times/day) |
times/day) |
|
Xi’an |
13th |
2.47 |
0.16 |
7695 |
Bangalore |
6th |
3.50 |
|
4203 |
|
Average vehicle |
Average volume/ |
Cars/LMVb (million) |
Two-wheelers (million) |
|
speed in CBD |
capacity (V/C) |
|
|
|
(km/h) |
in CBD |
|
|
Xi’an |
5–15 |
0.9 |
1.044 (car) |
0.440d |
Bangalore |
4–13 |
3.5h |
1.102 (LMV)b |
3.725 |
|
Urban form |
|
|
|
Xi’an |
Three ring roads and radial roads, leading industries mostly located outside the 2nd Ring Road, |
|
historical and cultural protection inside 1st Ring Road |
|
Bangalore |
Two ring roads and radial roads, leading industries mostly located outside the Outer Ring Road, |
|
building and market maintain traditional in CBD |
|
Table 5 Basic information of Xi’an and Bangalore
Sources: (Mamatha and Madhu 2007; Sudhira et al. 2007; Ramachandra et al. 2012; XCTMCCU 2012; Indiancn 2013; Sudhakara and Balachandra 2013; XBS and NBSXIT 2013; BT 2015)
- In Xi’an, the data of urban central area is for the year of 2010 and the data of resident population in the urban central area is for the year of 2014; other data of Xi’an in the table is for the year of 2012
- In Bangalore, the data of the urban area is for the year of 2009; the data of the population is for the year of 2014; the data of the GDP and per capita income is for the year of 2011; the data of average V/C in CBD and number of light motor vehicle (LMV) and two-wheeler is for the year of 2014 and comes from the Department of Transportation in Bangalore (BT 2015); and the data of the commuters by bus and number of buses is for the year of 2007
- City ranking data of Xi’an comes from the study of JLL (2015), and city ranking data of Bangalore comes from the reports of the ten richest cities rankings in India (Indiancn 2013)
- In Xi’an, there is prohibition of two-wheelers inside the 2nd Ring Road
In Xi’an, the number of the motor vehicles increased from 0.46 million in 2005 to 1.47 million in 2012, with an average annual growth rate of 18 %. Among these vehicles, the number of cars increased from 0.18 million in 2005 to 1.04 million in 2012, with an average annual growth rate of 28.1 %, and the car ownership was 159 cars per 1000 people in 2012 (XCTMCCU 2012). In Bangalore, the average annual growth rate of the vehicles was 20.22 % per year from 1980 to 2005, and the car ownership rate is 47 per 1000 population (Sudhakara and Balachandra 2013). Additionally, there is a sharp increase of two-wheeler ownership (3.72 million, 69.1 % of all traffic vehicles in 2014).
Both cities are facing severely increasing motorized traffic, especially for the car trips (28.56 % of the mode share in Xi’an in 2012) and two-wheeler trips (42 % of the mode shares in Bangalore in 2007) during the commuting, and walking and cycling trips decreased. In Xi’an, the bus ridership (37.94 % of the mode share) was 4.8 million per day on 243 routes with a fleet of 7695 buses in 2012. The passenger volume of Xi’an Metro Line 2 that began operations in September 2011 has reached 0.16 million people per day (XCTMCCU 2012). In Bangalore, the buses (20 % of the mode share in 2007) served about 3.5 million commuters per day with a fleet of 4203 buses (Mamatha and Madhu 2007). The metro in Bangalore is still under construction. Quick motorization, inconvenient bus services, and increasing commuting distances have led to a large amount of travels by cars or two-wheelers in both cities.
4.1.2 Similar industry distribution and quick urban sprawl
Xi’an and Bangalore have similar urban forms regarding ring roads, radial roads, and industry distributions. Within the 1st Ring Road in Xi’an, it is the city center with large malls, entertainment venues, government offices, and famous historic scenic spots. In the late 1990s, a government-led initiative created several economic zones that focused on new high-technology industry, ecological and cultural tourism industries between the 2nd Ring Road and the 3rd Ring Road. The economic zones in the south, southwest, and southeast outside the 2nd Ring Road developed more quickly than those in the northern part. Similarly, in Bangalore, there exist the government offices, commercial sites of retail and wholesale, cultural institutions, and transport hubs in the CBD area. Bangalore’s IT industry and the concentration of small and medium enterprises clustered mostly along or outside the Outer Ring Road (Sudhira et al. 2007).
Also, both cities sprawl by ring roads and radial roads quickly. In Xi’an, the newly developed suburbs in 1990s have now become part of the city sprawl as the urban area gradually spread out. Similarly, in Bangalore, as the city gradually sprawled, industrial estates at the periphery of the city along or beyond the Outer Ring Road have become part of the sprawl.
Compared with Xi’an, Bangalore has a less dense and more extensive urban sprawl in the outer areas, outskirts, and peri-urban regions of the city. At the urban fringe of Bangalore, the sprawl is haphazard and unplanned (Pucher et al. 2005; Mamatha and Madhu 2007; Ramachandra et al. 2012). In Xi’an, there is denser and more compact urban sprawl. Bangalore’s haphazard and unplanned urban sprawl pattern is due to the land privatization, highly market-oriented economic development, and government’s lack of urban and transpor-tation planning control and land use control, while Chinese governments have the ability to control the urban and transportation planning and land use.
4.1.3 Congested CBD
In the CBD of Xi’an, there are severe congestions during peak hours. The reasons include many large malls, entertainment venues, and government offices have attracted a huge amount of traffic; there exist some through traffic between the northern and the southern districts; and the famous historic scenic spots and old streets in the CBD attract tourists to this area. These all lead to more traffic volumes and congestions in the CBD area. The average volume/capacity (V/C) is as high as 0.9 in the CBD area; on other roads, it ranges from 0.4 to 0.8 (XCTMCCU 2012).
Bangalore’s transportation is even worse in its CBD (Mamatha and Madhu 2007). The Outer Ring Road is 8 km away from the CBD. If people want to use this ring road for travelling, the detour is a burden in terms of time and cost. Therefore, people tend to use the CBD as a thoroughfare, which is one of the reasons for the congestions in the CBD area. Besides, the government offices, commercial sites, cultural institutions, and transport hubs are all located in the CBD area. These attracted lots of traffic in the CBD. In peak hours, the average travel speed in the CBD is 13 km/h. In the core area of the CBD, the average travel speed in the peak hours is as low as 4 to 7 km/h. And, the V/C is as high as 3.5 in CBD area; on other roads, it ranges from 2.34 to 2.96 (Mamatha and Madhu 2007). (Due to a large number of two-wheelers in India, India uses a special method to calculate traffic capacity, which is different from normal method.)
4.2 The ranges and trends of urban commuting CO2 emissions in Chinese and Indian cities
The average commuting CO2 emission per person per kilometer varies with fuel consumption and vehicle occupancy. The sensitivity analysis of CO2 emission factor by mode and fuel type is shown in Fig. 1, and the maximum changes of CO2 emission factors are shown in Table 6. It is found that the occupancy has a significant impact on the CO2 emission factor (kg/passenger/km). The variation of the occupancy can cause −50 to +66.67 % variations on the CO2 emission factors of car, normal coach, and taxi. If vehicles travel smoothly and do not have frequent idling, the CO2 emission factors of cars and two-wheelers can be reduced by 14 %. If the road is congested with poor road conditions, the CO2 emissions of cars and two-wheelers can be increased by 14 %. From the perspective of the global CO2 emission reductions, increasing vehicle occupancy in China and India has the largest impact on control-ling the increase of commuting CO2 emission and the global climate change mitigations. In addition, traffic congestion reduction, pavement condition improvement, and reduction of frequent driving speed changes are also important for CO2 emission reduction.
4.3 Trends of CO2 emissions for major travel modes in Chinese and Indian cities
In 2008, the trips by electric motors, buses, and cars in Xi’an were 0.89, 5.34, and 2.42 million, respectively, and the average trip distance was 5.4 km. In 2012, the trips by electric motors, buses, and cars in Xi’an increased to 1.48 million (with an annual increase rate of 13.64 %), 5.89 million (with an annual increase rate of 2.47 %), and 3.39 million (with an annual increase rate of 8.82 %), respectively, and the average trip distance reached 5.81 km (with an annual increase rate of 1.85 %). In 2012, the CO2 emission factors for electric motors, buses, and cars are 0.011, 0.021, and 0.184 kg/passenger/km. Using the same annual increase rates of the trips of electric motors, buses, and cars and the average trip distance from 2008 to 2012, it is estimated that, by 2030, the trips by electric motors, buses, and cars in Xi’an will reach 14.88, 9.13, and 15.55 million, respectively, and the average trip distance will increase to 8.08 km. Based on the calculation in Sect. 4.2, under the worst situation where the vehicle occupancy decreases and the traffic congestions increase, the CO2 emission factors for electric motors, buses, and cars will be increased to 0.015, 0.031, and 0.295 kg/passenger/km. Then, by 2030, the total CO2 emissions from the above three travel modes in Xi’an will reach 15 × 106 t, about 7.8 times of current CO2 emissions; the annual average CO2 emissions per person will reach 1.6 t, about 7.1 times of current level.
Based on the estimated CO2 emissions in 2030 of Xi’an and the population of Xi’an and other major Chinese cities, by 2030, it is estimated that the total CO2 emissions from electric motors, buses, and cars in major Chinese cites (Beijing, Shanghai, Shenzhen, and Guangzhou excluded) will reach 480 × 106 t. If India has the similar increasing tendency in CO2 emissions as China has, the annual average CO2 emissions per person in both China and India will reach 1.6 t in 2030, increased from 0.22 t in 2012; the total CO2 emissions from the above three travel mode in China and India will be increased from 135 × 106 t in 2012 to 961 × 106 t in 2030 (accounting for 0.37 to 2.67 % of the total global CO2 emissions of 2013), which will affect the global climate change significantly. Hence, to mitigate global change, it is important to explore the characteristics of the commuting trips and to find strategies to reduce commuting CO2 emissions in China and India.
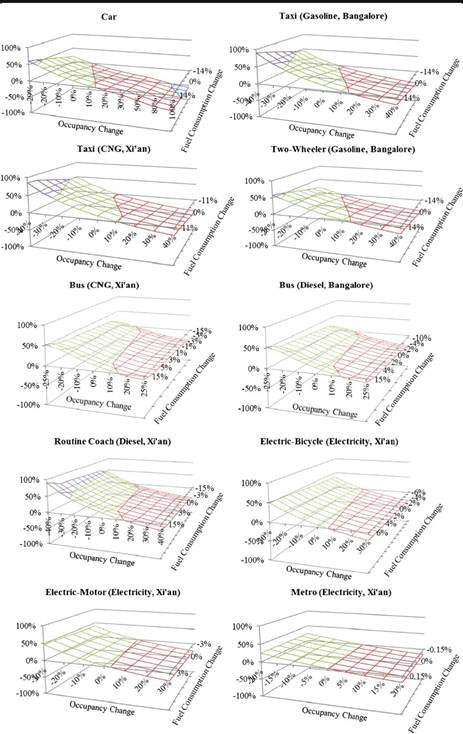
Fig. 1 Sensitivity analysis of the well-to-wheel CO2 emission factor to fuel consumption and vehicle occupancy in Xi’an and Bangalore by mode
table 6: Maximum changing extents of well-to-wheel CO2 emission factors with the changes of fuel consumption and the occupancy in Xi’an and Bangalore
|
|
Only fuel
consumption
|
Only occupancy
change percent
|
Both fuel consumption and
occupancy change percent
|
Travel mode
|
Fuel type
|
|
Decrease
|
Increase
|
Decrease
|
Increase
|
|
Decrease
|
Increase
|
|
|
|
|
|
|
|
|
|
|
|
Car/two-wheelera |
Gasoline |
|
−14.00/−14.00 % |
14.00/14.00 % |
|
−50.00/−28.57 % |
40.85/38.39 % |
|
−57.00/−38.57 % |
60.56/58.33 % |
Taxi |
CNG/gasolinea |
|
−11.00/−14.00 % |
11.00/14.00 % |
|
−28.57/−28.57 % |
66.67/66.67 % |
|
−36.43/−38.57 % |
85.00/90.00 % |
Bus |
CNG/diesela |
|
−15.00/−15.00 % |
15.00/15.00 % |
|
−20.00/−20.00 % |
33.33/33.33 % |
|
−32.00/−32.00 % |
53.33/53.33 % |
Normal coachb |
Diesel |
|
−15.00 % |
15.00 % |
|
−28.57 % |
66.67 % |
|
|
−39.29 % |
91.67 % |
Metrob |
Electricity |
|
−0.15 % |
0.15 % |
|
−16.67 % |
25.00 % |
|
|
−16.79 % |
25.19 % |
Electric bicycleb |
Electricity |
|
−6.00 % |
6.00 % |
|
−23.08 % |
42.86 % |
|
|
−27.69 % |
51.43 % |
Electric motorb |
Electricity |
|
−3.00 % |
3.00 % |
|
−23.08 % |
42.86 % |
|
|
−25.38 % |
47.14 % |
aTwo-wheelers and taxis use gasoline and buses use diesel according to the data of Bangalore
b Only Xi’an has this travel mode information
Citation : Yuanqing Wang, Liu Yang, Sunsheng Han, Chao Li and Ramachandra T V, 2016. Urban CO2emissions in Xi’an and Bangalore by commuters: implications for controlling urban transportation carbon dioxide emissions in developing countries, Mitig Adapt Strateg Glob Change, 21(113): , DOI 10.1007/s11027-016-9704-1
|