 |
Spatial Data Mining and Modeling for Visualisation of Rapid Urbanisation |
 |
| Abstract | Introduction | Methods | Study area and Data | Results and Discussions | Conclusion | Acknowledgement | References | Home |
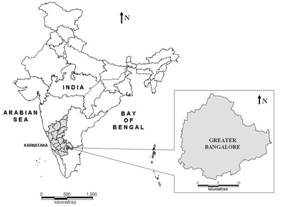
Study area and Data Greater Bangalore is the principal administrative, cultural, commercial, industrial, and knowledge capital of the state of Karnataka with an area of 741 square kilometers (sq. km) and lies between the latitudes 12°39’00’’ to 131°3’00’’N and longitude 77°22’00’’ to 77°52’00’’E (figure 1). Bangalore has grown spatially more than ten times (741 sq. km) since 1949 (69 sq. km.) and is the fifth largest metropolis in India currently with a population of about 7 million. The mean annual total rainfall is about 880 mm with about 60 rainy days a year over the last ten years. The summer temperature ranges from 18° C – 38° C, while the winter temperature ranges from 12° C – 25° C. Thus, Bangalore enjoys a salubrious climate all round the year. Survey of India (SOI) toposheets of 1:50000 and 1:250000 scales were used to generate base layers of the city boundary and water bodies. Field data for ground control points (GCPs) and training sites for supervised classification of RS data were collected with a handheld GPS. RS data used are
|