Results
Unique Spatial Patterns
A concentric ring pattern of CO2 emissions is discernible among
household samples in Xi’an, waving downward from the inner city
then upward towards the outer ring. In Bangalore, the high level
emission households are distributed sporadically, interspersed with
low emission households in multiple clusters all over the space.
Distinctive Family Characteristics
Families in Xi’an are smaller than their counterparts in Bangalore.
About 60% of the households in Xi’an are three-member
families. In Bangalore three member families only account for 15%
of the samples. Instead, almost half of the samples in Bangalore are
four-person families. In Xi’an four-person families only account for
10% of the samples. The largest family reported in the Xi’an sample
has 8 persons, while the largest in Bangalore has 33 persons. About
2% of the household samples in Xi’an have 6 persons or more, but in
Bangalore about 13% of the samples have 6 members or more.
Distinctive Housing
The majority of the households in Xi’an live in walk-up apartments
(64%) or high-rise apartments (32.5%), while in Bangalore a
large proportion of the households live in single storey houses (41%)
and walk-up apartments (42%). A larger proportion of households
live in newer apartments in Xi’an than in Bangalore, and the unit
size of housing is smaller but less varied in Xi’an as compared with
Bangalore.
Modernisation as a Key Driver Towards High CO2 Emissions
In both cities the ownership and usage of motor vehicles show
positive influence on CO2 emissions, though the ownership and
usage vary greatly. About 20% of the family heads commute by car or
motorcycles in Xi’an but in Bangalore the proportion is above 60%.
However, among the families that use motor vehicles, the average level of petrol consumption in Xi’an (149 litres per month) is higher
than that in Bangalore (45 litres per month); this is due to the popular
use of motorcycles in Bangalore. In contrast, more than half (52%) of the family heads and their spouses in Xi’an walk or cycle to work,while in Bangalore only about 11–20% of the family heads and their
spouses walk or cycle to work.
The use of electricity is measured by the number of household
appliances in Xi’an but the use of electricity for cooking in Bangalore.
This choice of measurement reflects the different characteristics of
on-site energy use in the two cities. About 56% of the families in Xi’an
use six or more electric appliances such as refrigerator, microwave,
TV, etc. In Bangalore, about 54% of the families use electricity for
cooking.
In terms of income, the proportion of samples in each of the
highest three bands (US$ 1668 and more) are quite similar between
Xi’an and Bangalore. But the poorer households form a larger
proportion in Bangalore (25%) than that in Xi’an (7%). According to
the accumulative percentage values, there are 5% more samples that
earned a monthly income of US$ 833 and less in Bangalore than that
in Xi’an.
The 1 km zone as a Planning Unit to Reduce CO2 Emissions
A rich mix of economic activities within a neighbourhood space
(about 1 km radius from home) is associated with low household CO2
emissions. This is confirmed by both the aggregate household emissions
model and the commuting-related emissions model in Xi’an.
A related finding is that a rich mix of services and facilities, such as
kindergartens, primary and secondary schools, supermarkets, banks
and hospitals, in the immediate vicinity (within 500 m radius) of a
household is associated with higher emissions from the household.
These results are not contradictory as they represent different
aspects of the built environment. The provision of more services and
facilities within the immediate zone contributes to the formation of
a prestigious residential environment, thus higher house values and
wealthier families are more likely to be found in the area – apparently,
wealthier families are associated with higher CO2 emissions.
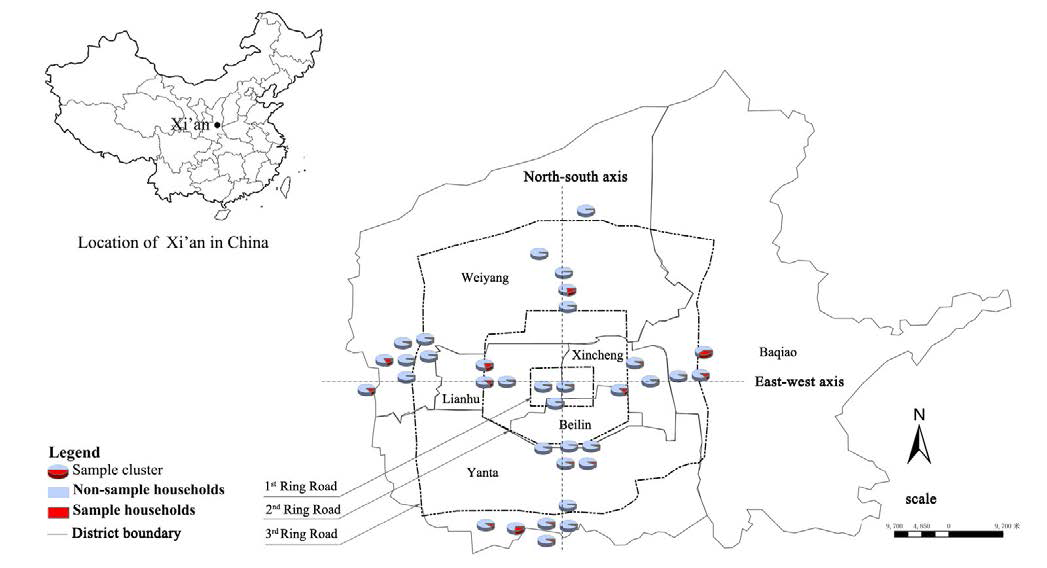
Figure 1. Sample households selected from housing blocks/groups including market housing, municipal housing and work-unit housing
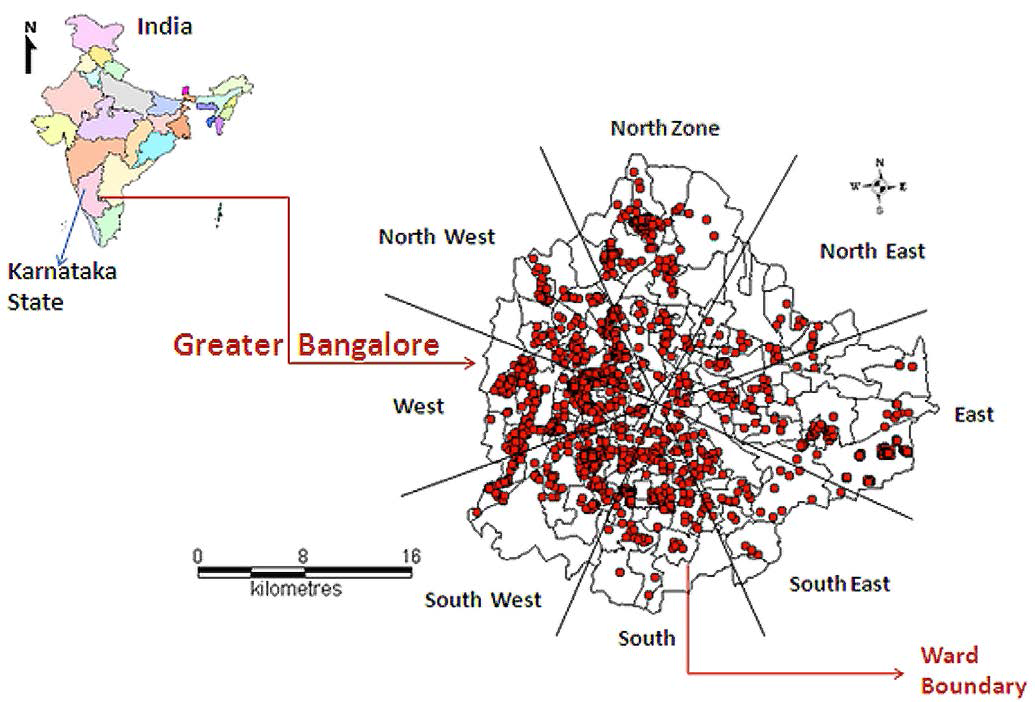
Figure 2. The spatial distribution of sample households in Bangalore.
Households in Xi’an are more likely to be surrounded by a
richer mix of services, facilities and jobs than their counterparts in
Bangalore. In the immediate vicinities of households in Xi’an, more
than 60% of the samples are surrounded by eight or more service
and/or facility types. This same measurement is much smaller in
Bangalore (less than 30%). Less than 4% of the sample households in
Xi’an are surrounded by one or two service or facility types, while the
same measurement reads 20% in Bangalore. Within the neighbourhood
space, more than 50% of the sample households in Xi’an are
surrounded by four or more job types, while in Bangalore the same
measurement is about 12%. About 30% of the samples in Xi’an are
surrounded by one or two job types, while in Bangalore the percentage
is as high as 73%. This same pattern is true for the extended
neighbourhood defined by a 5 km radius from home.
Citation : Sun Sheng Han, Yuan Qing Wang, T. V. Ramachandra and Bo Qin, 2015. The Impact of Spatial Parameters on Carbon Dioxide (CO2) Emissions: A Comparative Study between Cities in China and India [ARCP2011-07CMY-HAN], APN Science Bulletin, Issue 8, March 2015, Pp 6-7.