 |
GHG footprint of Major cities in India |  |
| Abstract | | | Introduction | | | Objective | | | Method | | | Results and Discussion | | | Conclusion | | | Acknowledgement | | | References | | | | | HOME |
T.V. Ramachandra1,2,3,*, Bharath H. Aithal1, K. Sreejith1
|
||
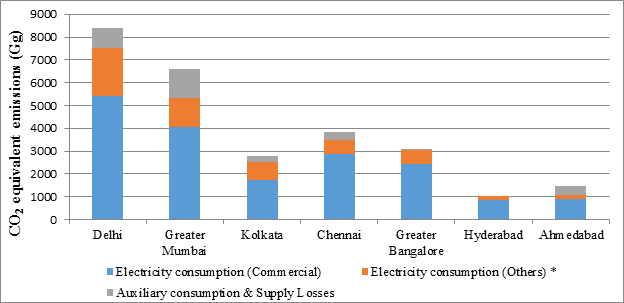
Results and discussion 4.1 GHG emissions from energy sector: The major energy related emissions considered under this sector are emissions from electricity consumption and fugitive emissions. Emissions resulting from consumption of fossil fuels and electricity in sectors like domestic and industrial are represented independently under specific sectors respectively.
Table 9: GHG (CO2 equivalent) emissions from electricity consumption in different cities
Figure 3: GHG emissions (Carbon dioxide equivalent, CO2 eq) from electricity consumption
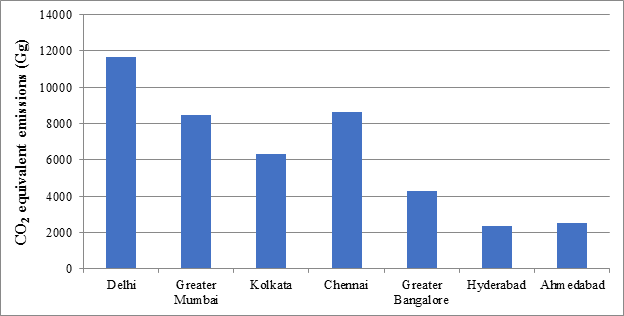
4.2 GHG footprint of domestic sector: Domestic sector is a major sector which contributes to the considerable amount of emissions when city level studies are carried out. The major sources include electricity consumption for lighting and other household appliances and consumption of fuel for cooking. In the present study greenhouse gases emitting from electricity consumption in domestic sector and fuel consumption are accounted. The major fuels used in this study are LPG, Piped Natural Gas (PNG) and kerosene based on the availability of data. The chart given below shows the total greenhouse gas (GHG) emissions converted in terms of CO2 equivalent (GHG footprint / aggregated Carbon equivalent of GHG) from the domestic sector in major cities. In Delhi during the study base year 2009, 11690.43 Gg of CO2 equivalents is emitted from the domestic sector which is the highest among all the cities that accounts for 26.4% of the total emissions when compared with other six cities (Figure 4). Electricity consumption accounted for 9237.73 Gg of emissions out of the total domestic emissions. Earlier estimate sho an emission of 5.35 million tons (5350 Gg) of CO2 emissions from domestic sector in Delhi during the year 2007-08 [206]. Greater Mumbai which covers both Mumbai city and sub urban district emits 8474.32 Gg of CO2 equivalents from the domestic sector which shares 19.14% of the total emissions. Domestic sector in Kolkata results in 6337.11 Gg of CO2 equivalents (14.31% of total emissions). Another major city Chennai ranks second in the list with 8617.29 Gg of CO2 equivalents, contributing to approximately 19.5 % of total emissions share. Greater Bangalore accounts for an emission of 4273.81 Gg of emissions from domestic sector, 9.65% of total emissions from domestic sector. Hyderabad and Ahmedabad the other two cities are responsible for 2341.81 Gg of CO2 equivalent and 2544.03 Gg of CO2 equivalents respectively. These two cities together share 11% of the total domestic emissions.
Figure 4: GHG emissions (Carbon dioxide equivalent, CO2 eq) from domestic sector
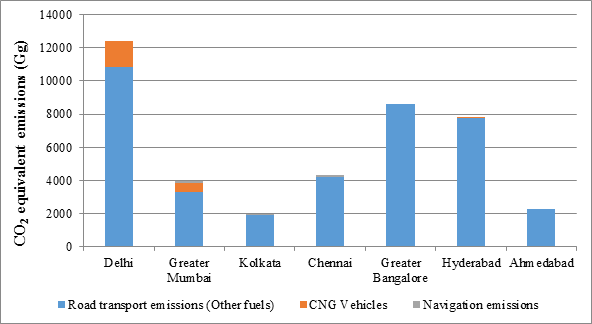
Figure 5: GHG emissions (Carbon dioxide equivalent, CO2 eq) from transportation sector
In Delhi during the year 2009-10, total number of registered vehicles was 6451883, out of which there were around 20 lakhs of cars and jeeps and 40.5 lakhs of motor cycles including scooters and mopeds. CNG fuelled vehicles emitted 1527.03 Gg of CO2 equivalents whereas the remaining vehicles resulted in 10867.51 Gg of emissions contributing almost 30% of the total emissions in this sub category which is the highest among all the major cities. This is twice the earlier estimate of 5.35 million tons (5350 Gg) of CO2 emissions from road transportation sector in Delhi during the year 2007-08 or emissions of 7660 Gg using top down approach or 8170 Gg using bottom-up approach [204].The CNG vehicles are also present in two other cities: Greater Mumbai and Hyderabad. Emissions from CNG vehicles in Mumbai during the year 2009-10 are found to be 531.34 Gg of CO2 equivalents and for Hyderabad it is estimated that 21.55 Gg of CO2 equivalent was emitted from CNG vehicles during the study year. The emission inventories for transportation sector in all the major cities are given in Table 10. Table 10: GHG (CO2 equivalent) emissions from transportation sector in different cities
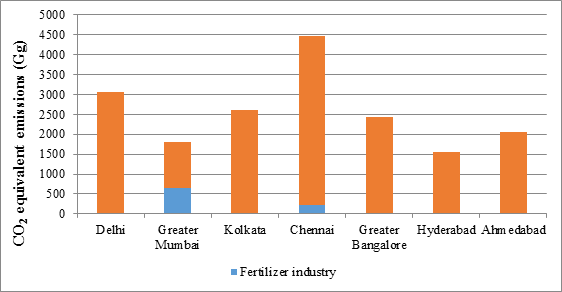
4.4 GHG footprint of industrial sector: Emissions are estimated from the major industrial processes emitting considerable greenhouse gases which are located within the city boundary (Table 11). Electricity consumption in industrial sector is taken into account using which the resulting emissions are calculated. Fuel consumption data is also used in few of the industries to estimate the emissions. Iron and steel industry, cement industry, fertilizer plants and chemical manufacturing are the few major industries which releases huge amount of greenhouse gases into the atmosphere during the process. Emissions are calculated from the major polluting industries in city boundaries as the data is not available for small and medium scale industries. Table 11: GHG (CO2 equivalent) emissions from industrial sector in different cities
Figure 6: GHG emissions (Carbon dioxide equivalent, CO2 eq) from industrial sector
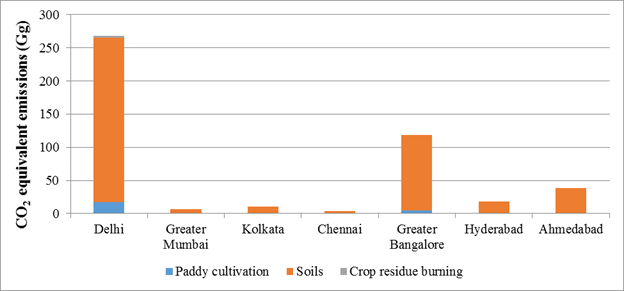
Table 12: GHG (CO2 equivalent) emissions from agricultural related activities in different cities
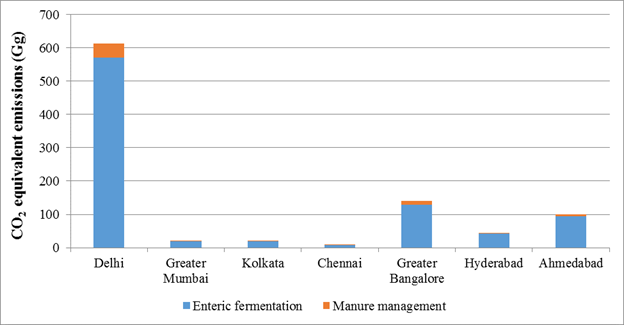
Emissions from paddy cultivation are calculated for two major cities based on the area of paddy fields. Carbon dioxide equivalents (GHG footprint) were found to be 17.05 Gg in Delhi and 5.10 Gg in Greater Bangalore respectively. Emissions resulting from burning of crop residues at the end of growing year are estimated based on Delhi’s emission of 2.68 Gg of CO2 equivalents. N2O emissions are converted into CO2 equivalents as presented in table 12. There are no agricultural activities in most of the cities which indicates decline in agricultural practices as a result of increasing urbanization. 4.6 GHG footprint of livestock management: Enteric fermentation and manure management are the two major activities resulting in the emission of greenhouse gases from animal husbandry. In the present study emissions from livestock management is carried out to calculate the emissions resulting from enteric fermentation and manure management in the major cities. Livestock population for cities is obtained for cities using 2003 and 2007 livestock census, using which the number of livestock is extrapolated to the inventory year 2009 [207, 208]. The emission estimates for the major cities are as given in Table 13. Delhi and Greater Bangalore are the major cities which emits higher amount of greenhouse gases due to animal husbandry. The emissions resulting from enteric fermentation for Delhi and Greater Bangalore are estimated to be 570.57 Gg of CO2 equivalent and 129.36 Gg of CO2 equivalents respectively. Similarly Delhi and Greater Bangalore emits 43.09 Gg of CO2 equivalent and 10.30 Gg of CO2 equivalent respectively making these two cities higher emitters in the livestock management category among the other cities. Figure 8 shows the emission profile of livestock management for different cities.
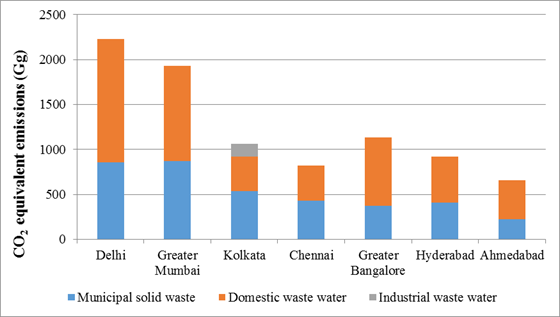
4.7 GHG footprint of waste sector: In the current study greenhouse gas emissions from 3 major waste sectors are calculated: municipal solid waste, domestic waste water and industrial waste water. CH4 emissions from municipal solid waste disposal data are obtained from the local city municipality. CH4 and N2O emissions are calculated from domestic sector. In this study the industrial waste water emissions is calculated for only Kolkata city based on the availability of the data. Table 14 shows city wise CO2 equivalent emissions and their shares in total emissions. Table 13: GHG (CO2 equivalent) emissions from livestock management in different cities
Table 14: GHG (CO2 equivalent) emissions from waste sector in different cities
From the calculations of the present study Delhi emits 853.19 Gg of CO2 equivalents and Greater Mumbai emits 869.92 Gg of CO2 equivalent using IPCC 2006 method [30], both together is responsible for almost 46.7% of the total emissions occurring from solid waste disposal. The emissions depend on the parameters like amount of waste disposed, methane correction factor, degradable organic carbon and oxidation factor [30]. Waste disposal at cities is a major source of anthropogenic CH4 emissions these days. CH4 and N2O emissions from domestic water are calculated on the basis of population of the city. From the current inventories, major emitters from domestic waste water sector are cities Delhi, Greater Mumbai and Greater Bangalore which emit 1378.75 Gg, 1058.09 Gg and 759.29 Gg of CO2 equivalents respectively. Emissions from industrial waste water sector in Kolkata emitted 143.84 Gg of CO2 equivalents during 2009. Waste emission profiles for the major cities are given in Figure 9.
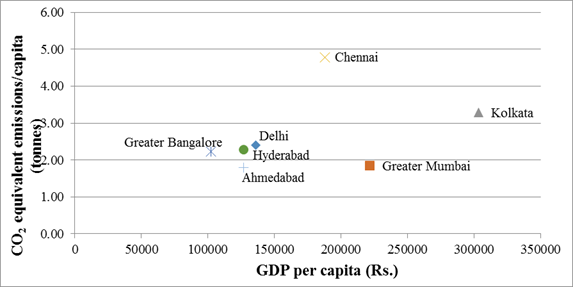
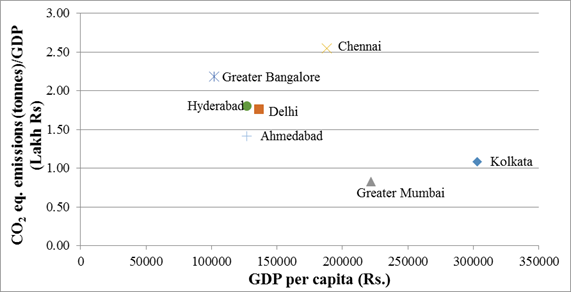
4.8 GHG footprint - Intercity analyses Table 15 gives the values for carbon dioxide equivalent emissions per capita, GDP per capita and carbon dioxide equivalent emissions per GDP for the major cities. Table 15: Values of CO2 eq. emissions/capita, GDP/capita and CO2 eq. emissions/GDP for different cities
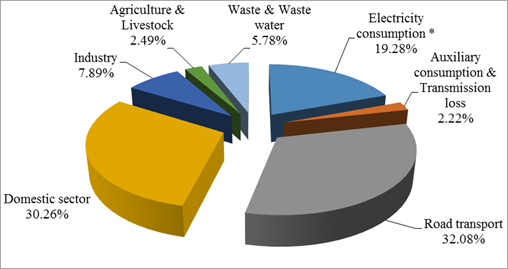
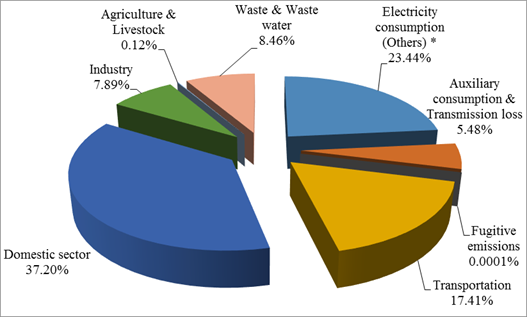
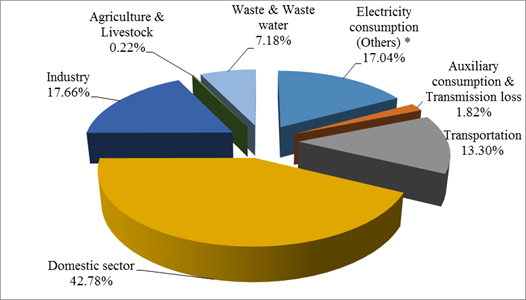
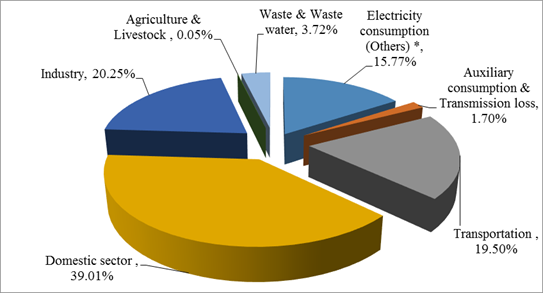
Aggregation of GHG emissions of all sectors reveal that GHG emissions in major cities in India ranges from 38633.20 Gg/year (Delhi), 22783.08 (Greater Mumbai), 22090.55 (Chennai), 19796.60 (Greater Bangalore), 14812.10 (Kolkata) to 13734.59 (Hyderabad). Sector wise GHG footprint analysis for Delhi city (Figure 13) reveals that transport sector leads the carbon emission (32.08%) followed by domestic sector (30.26%) and electricity consumption (19.28%). Electricity consumption (*) includes public lighting, general purpose, temporary and colony lighting. Figure 12, 13, 14 and 15 depicts sector-wise GHG footprint for Delhi, Mumbai, Kolkata and Chennai. In these cities domestic sector has higher GHG footprint ranging from 42.78% (Kolkata), 39.01% (Chennai) and 37.2% (Greater Mumbai). This is followed by transport sector -19.50%(Chennai), 17.41% (Greater Mumbai), 13.3% Kolkata
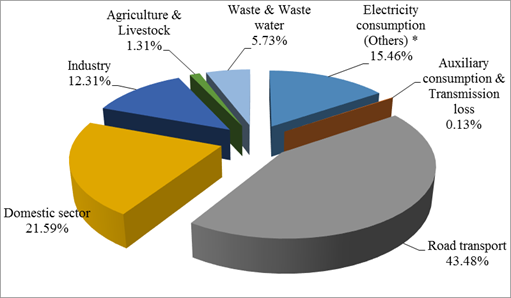
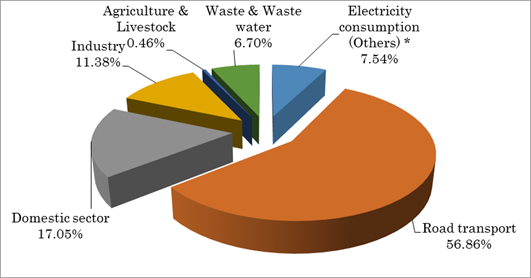
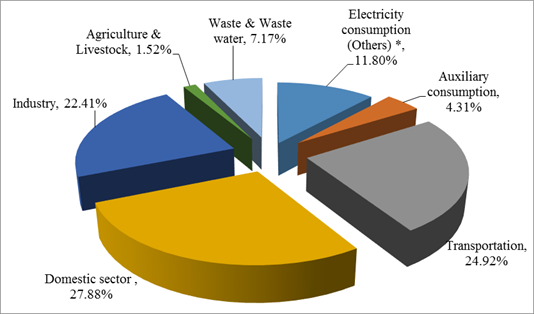
Figure 16 and 17 illustrates the sector-wise carbon emissions for IT (Information Technology) giants of India – Bangalore and Hyderabad. Due to lack of appropriate public transport system in these Cities and haphazard growth due to unplanned urbanisation has led to large scale usage of private vehicles. Emissions from transport sector ranges from 43.83% (Greater Bangalore) and 56.86% (Hyderabad). Figure 18 depicts the GHG footprint of Ahmedabad city with sector share ranging from 27.88% (Domestic), 24.92% (transportation), 22.41% (industry). etc.
|
||||||||||||||||||||||||||||||||||||||||||||||||||||||||||||||||||||||||||||||||||||||||||||||||||||||||||||||||||||||||||||||||||||||||||||||||||||||||||||||||||||||||||||||||||||||||||||||||||||||||||||||||||||||||||||||||||||||||||||||||||||||||||||||||||