TEMPORAL CHANGES IN ENERGY UTILIZATION: AN OVERVIEW
Energy resources can be categorized as commercial (coal, crude oil, natural gas, etc.) and non-commercial (fuel wood, animal residues, agricultural and horticultural residues) depending on the market mechanism. Commercial energy resources are mainly used in industries, transportation, electricity generation, and commercial sectors. Domestic sectors’ energy demand is mainly met by locally and freely available non-commercial resources in rural areas (Ramachandra et al., 2000). India is blessed with very few energy resources such as coal, natural gas, biomass, water, etc. Traces of crude oil sources are found in few places which are not able supply the huge demand. Analysing the temporal change of energy resources will help to understand the resource status and take appropriate action to meet the forthcoming deman
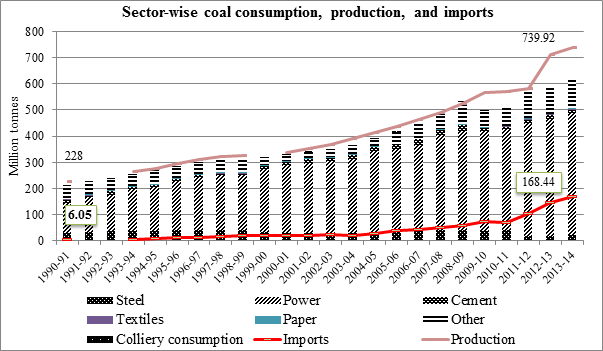
Coal: Coal mining in India started during the eighteenth century for meeting the fuel demand of railways and industries. India is the third highest coal producer in the world with annual production of 739.92 million tonnes (MT) in 2013–14. India has a proven coal reserve of 293.5 billion tonnes available at Jharkhand, Chhattisgarh, Odisha, Madhya Pradesh, and West Bengal (MoC 2013). Resource assessment predicts that the approximate life of coal is 169 years with present reserve and consumption. Figure 3 gives the temporal patterns in coal production and imports over the last two decades. Coal consumption has increased from 213 MT (1990–91) to 615 MT (2013–14) and therefore, has grown more than 3 times over the years. About 168.44 MT of coal is imported in 2013–14 to meet the growing demand in the power sector
Figure 3: Temporal change in coal production, imports, and sector-wise consumption
Calorific value of Indian coal varies from 4000–7000 kcal/kg, which is relatively lower. Coal utilization for electric power generation tops the consumption with 463.71 MT (2013–14) followed by the industrial sector (Figure 3). Steel industries consume 23.16 MT, followed by cement (13.36 MT) and textile industries.
There are numerous environmental and economic problems associated with coal mining, combustion, and power generation. Coal mining results in geographical change of land, with the minimal scope for restoration to its original state. Coal-based thermal power plants have been polluting the neighbouring environment, thus, causing respiratory and other health problems (Ramachandra et al. 2012). Air pollution from coal mines is mainly due to the emissions of particulate matter and greenhouse gases (GHG) including methane (CH4), sulfur dioxide (SO2), nitrogen oxides (NOx), carbon monoxide (CO), etc. These pollutants contaminate water resources, air, soil, and consequent changes in the climate.
Crude Oil, Natural Gas and Petroleum products: Transportation tops in oil consumption (54.28 MTOE) followed by industrial (28.8 MTOE) and domestic (24.89 MW) sectors. Figure 4 gives the sector-wise consumption of crude oil in the country (2012–13). India is blessed with very few oil resources which are located in Mumbai High, Bay of Bengal, and Rajasthan which are being monitored by the Oil and Natural Gas Corporation (ONGC).
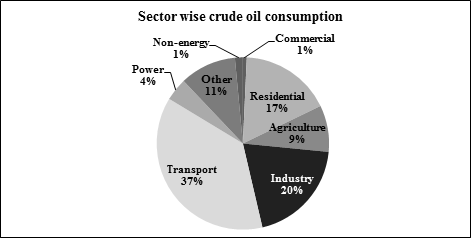
Figure 4: Sector-wise crude oil consumption (MTOE) in India
The total oil production in India has marginally increased from 33 million tonnes (1990–91) to about 37.7 million tonnes (2013–14). Consumption of oil has increased multiple times with industrialization and revolution in transportation system, leading to a radical escalation in oil imports. Imports of crude oil increased from 20.7 million tonnes (1990–91) to 189 million tonnes (2013–14). Figure 5 illustrates the temporal changes in crude oil production and imports (MoPNG 2013). Drastic change in imports occurred during the end of last century, emphasizing the need for energy conservation, demand side management, and renewable energy-based capacity addition, in order to minimize the dependency on other countries.
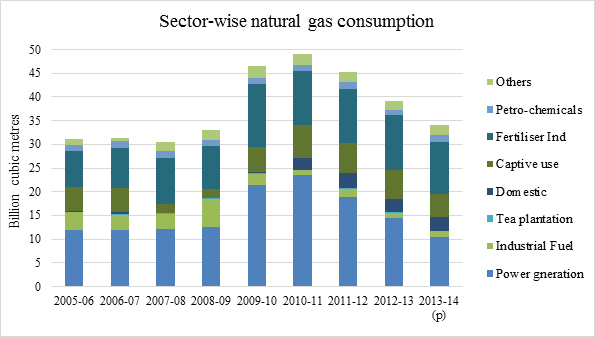
Natural gas is one of the prominent energy sources in power and industrial sectors. Total natural gas production in the country was about 18 BCM (billion cubic meters) during 1990–91 and increased to 34.64 BCM in 2013–14. Natural gas is available in India at Mumbai High basin and in Gujarat. Offshore gas reserves are also located in Andhra Pradesh coast (Krishna Godavari Basin) and Tamil Nadu coast (Cauvery Basin). Onshore reserves are located in Gujarat and the North Eastern states (Assam and Tripura). The country has 1437 BCM of natural gas reserves which may last for 30 years at the present level of consumption. Figure 5 depicts the natural gas production and annual imports from 1990–91 to 2013–14. Figure 6 shows the sector-wise consumption of natural gas in the country. Fertilizer industries are the major consumer of natural gas (11.06 BCM) followed by power generation (10.53 BCM) (MoPNG 2013). Petroleum products and their utilization have been increasing at a higher rate since globalization era (after 1990’s). The total consumption of petroleum products was about 55 MT (1990–91) which has increased to 148 MT (2011–12). Figure 5 also gives the temporal change in petroleum product production and consumption. Import of petroleum products is about 15.85 MT (during 2011–12) and the increase in crude oil imports is directly dependent on the rise in petroleum product consumption. However, the import of final products is expensive compared to crude oil, which affects the country’s economy. Production of petroleum products also increased significantly from 48.5 MT (1990–91) to 204 MT (2011–12), indicating the four-fold growth (MoPNG 2013). Rapid increase in consumption has resulted in numerous environmental and economic problems due to inefficient combustion. This necessitates a paradigm shift from fossil fuel-based energy to renewable energy to achieve the energy independent sustainable development.
Electric power: India is one of the major electric energy consuming countries in the world with the annual generation of 11,79,256 GWh (2013–14) and largely depends upon fossil energy resources. Figure 7 illustrates the share of energy sources in total installed power capacity in the country. Coal is the prominent energy source (170,737.88 MW) followed by hydro (42,623.42 MW), nuclear power plants (37,415.53 MW) and renewable energy sources (27,541 MW). The government has proposed augmentation of nuclear power generations to 20,000 MW by 2020 (CEA-LGBR 2013). Electricity generation has increased from 43,724 GWh (1970–71) to 11,79,256 GWh (2013–14) showing a growth of over 26 times in 40 years. Industrialization, revolution in agriculture and elevated consumption in commercial sector have necessitated an additional increment in electricity demand. Figure 8 gives the sector wise temporal electric energy consumption. Industries top the consumption with 346,469 MW (44.8 per cent), followed by agriculture (133,650 MW, 17.3 per cent), domestic (170,034, 22 per cent) and commercial sector (69,266, 9 per cent) (MoP 2013)
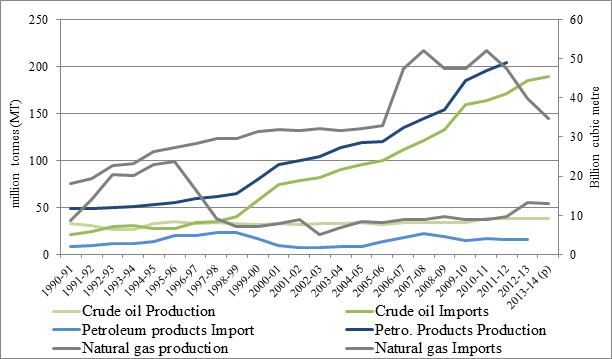
Figure 5: Temporal change in crude oil, natural gas, petroleum products, and their imports
Figure 6: Sector-wise consumption of natural gas in India
Renewable Energy (RE) sources: India is bestowed with ample renewable energy resources throughout the region with the scope for harvesting wind, bio-energy, solar (PV and Thermal), micro hydro, biogas, geothermal, tidal energy, etc. Figure 9 depicts the share of RE sources, based on the total installed capacity. Renewable energy is being used in various forms as is evident from the dependence on bio-energy to an extent of 85 per cent among the rural population (constitutes 70 per cent of the total) since time immemorial. Grid interactive power generating plants from RE sources constitute 37,414 MW with the major share of wind energy plants (24376.26 MW, 65 per cent) followed by biomass/bagasse cogeneration plants (4418.55 MW, 12 per cent), solar photovoltaic (4346.82 MW, 12 per cent), and small hydro (4146.82 MW; 11 per cent). Power generation from municipal solid waste accounts for a very small fraction (MNRE 2013a; MNRE 2013b).
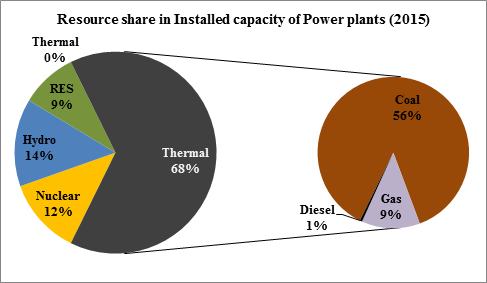
Figure 7: Share of energy sources in total installed capacity
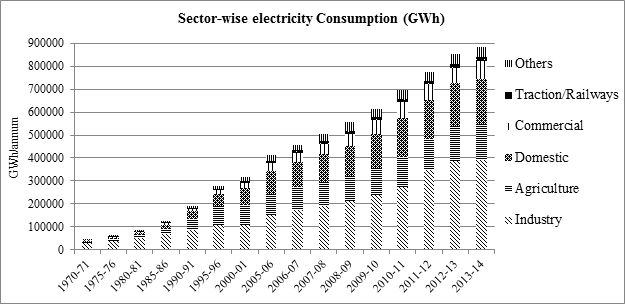
Figure 8: Sector-wise electricity consumption in India
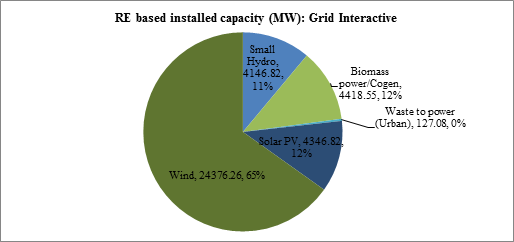
Figure 9: Share of RE sources (Grid interactive) in total installed capacity
Figure 10 shows the share of RE energy sources in off-grid installation (1228.48 MWe) for remote area electrification and as captive generation inindustries. The Government of India is encouraging RE-based capacity installation through National Solar Mission, Jawaharlal Nehru National Solar Mission (JNNSM), projects under Clean Development Mechanism (CDM), incentives for biogas installation, etc. Policy initiatives such as Feed-in-Tariff (FIT) and Generation Based Incentives (GBI), tax holidays, and subsidy on capital investments will help to boost the RE-based capacity addition. Sustainable energy development can take place with renewable energy-based generation while reducing the GHG emission.
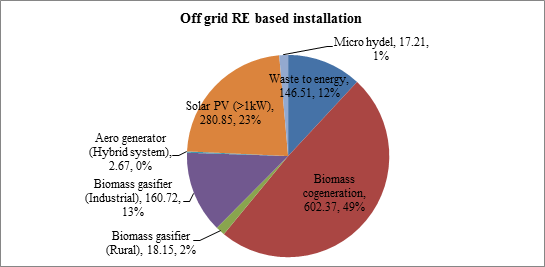
Figure 10: Share of RE energy sources (MWe) in off-grid installation
Solar cookers, dryers, and improved cook stoves can be used in the domestic sector whereas, solar and wind driven pumps are reliable in irrigation. Captive electric energy generation using solid waste, bagasse, agricultural and horticultural residues, wind and solar energy are viable in the industrial sector. Hence, the RE sources can replace the present energy mix with a higher share with distributed generation and micro-grid (rooftop) generation.
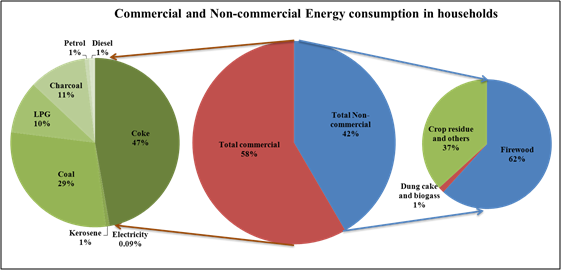
The Indian energy scenario shows that the present energy mix is dominated by conventional energy sources. Dependency on fossil fuels has increased the imports which is affecting the country’s economy. Development in the energy sector is likely to deviate from sustainable path hinting the energy crisis in future. Figure 11 gives the share of commercial and non-commercial sources in the energy mix of the domestic sector of the country. About 58 per cent of the demand is met by commercial energy sources wherein coke dominates the consumption (47 per cent), followed by coal (29 per cent), charcoal (11 per cent), and LPG (10 per cent). Non-commercial sources supply 42 per cent of the demand in which firewood tops with a share of 62 per cent, followed by crop residues and others (37 per cent). Figure 13 highlights an increase in carbon dioxide (CO2) emission from 143 million tonnes (1962) to 2,073 million tonnes (2014). Mitigation of changes in the climate entails lowering GHG emissions, through energy conservation and improvements in end use devices efficiency.
The current level of energy extraction, transportation, and inefficient consumption pattern and its impact on the environment and nation’s economy has necessitated a paradigm shift in the energy planning to achieve sustainable development. Figure 12 shows the increasing trend of GHG emissions. Power generation and transportation sectors are the major contributors to emissions which entails the transition to renewable energy and innovations in vehicle design, etc. Apart from that, end use energy efficiency improvement with DSM would help to conserve energy. Adoption of smart grid architecture would further improve the energy sector through intelligent, reliable, efficient, and less pollutant systems (Ramachandra 2009a; Dabrase and Ramachandra, 1999; Varun, Prakash and Bhat, 2009).
Figure 11: Commercial and non-commercial sources in domestic energy consumption
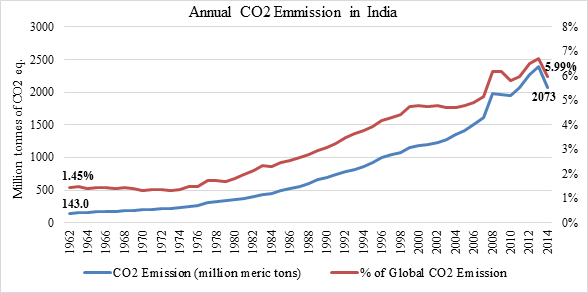
Figure 12: CO2 emission (million tons) from 1962-2014
Citation : T. V. Ramachandra and Ganesh Hegde, 2015. Energy Trajectory in India: Challenges and Opportunities for Innovation, Journal of Resources, Energy and Development, 12(1&2):1-24.