|
RESULTS AND DISCUSSION
Wind profile of Uttara Kannada: Wind speed is seasonal dependent which is normally at its maximum during monsoon season. Wind speed varies from 1.9 m/s (6.84 km/hr.) to 3.93 m/s (14.15 km/hr.) throughout the year resulting minimum in October and maximum in June and July. Annual average wind sped in the district ranges from 2.54 ± 0.04 m/s (9.144±0.144 km/hr.) in Haliyal taluk to 2.70 ± 0.05 m/s (9.72±0.18 km/hr.) in Karwar taluk. Figure 3 gives the taluk wise annual average wind speed of the district. Ample amount of electrical energy can be generated using blowing wind through wind farms which could meet the major fraction of the current electricity demand of the district through decentralized generation.
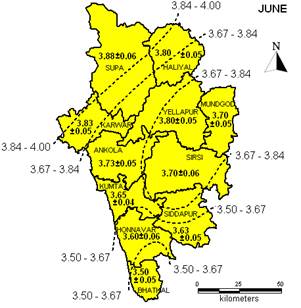
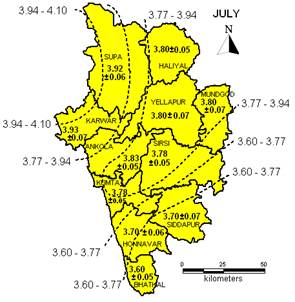
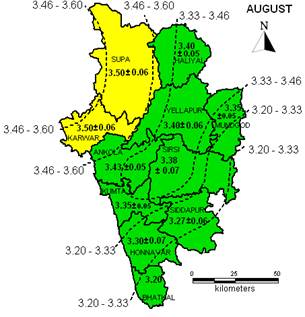
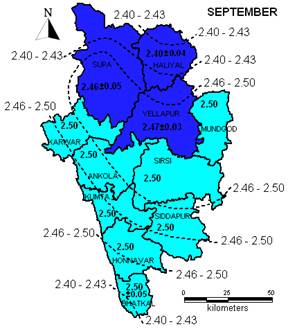
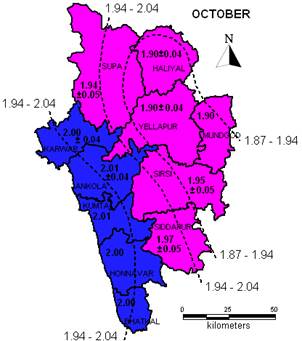
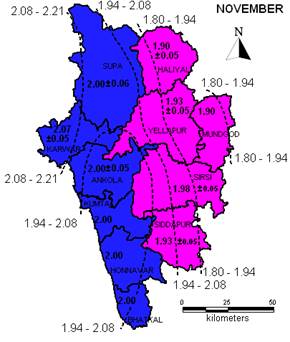
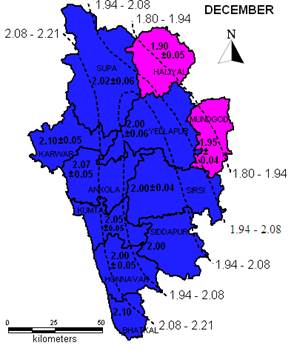
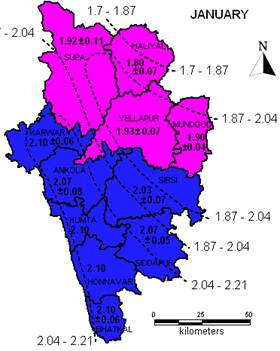
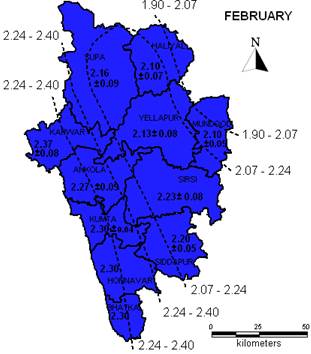
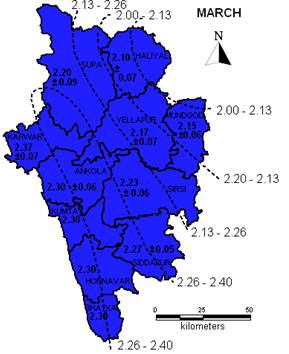
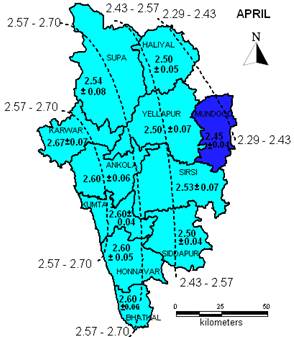
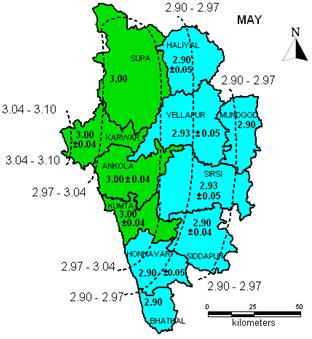
Seasonal variation of wind speed: Speed of the wind is quite uncertain and dependent on ambient temperature and pressure, vegetation cover, elevation, topography of the site etc. Uttara Kannada has a mixed topography includes coastal belt, low and high elevation area with forest cover and also planes. From February to May district experiences summer with higher temperature in costal (Karwar, Honnavar, Kumta, Bhatkal and Ankola) and in planes (Mundgod and Haliyal) and comparatively lower temperature in taluks of higher altitudes (Sirsi, Siddapur, Yellapur and Supa). Figure 4 to 6 gives the mean wind speed variability in the district during summer, winter and monsoon months.
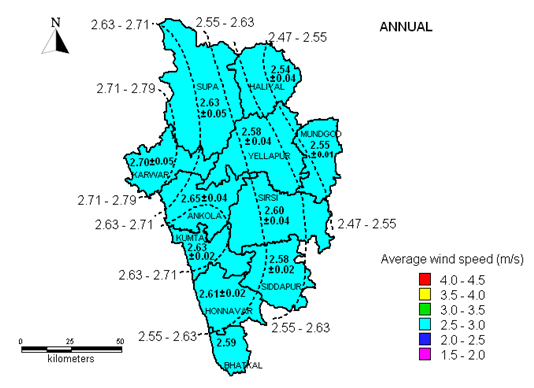 |
Figure 3: Average annual wind speed of Uttara Kannada |
 |
|
|
|
|
Figure 4: Wind speed variation during summer (m/s)
Figure 5: Wind speed variation during monsoon (m/s)
Figure 6: Wind speed variation during winter (m/s)
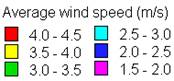
Wind Energy Conversion System (WECS): Wind Energy Conversion System (WECS) is used to extract energy from wind which in turn converted to mechanical and then electrical energy. Main components of WECS are blades, gears, turbine, generator and pillar to mount all the equipment at the required height. Wind potential assessment is a prominent pre installation procedure to assure perfect selection of site and to harness maximum energy. In order to explore the potential of wind technologies at an increased hub height, hourly surface wind speed measurements at IMD stations were estimated and represented in Figure 5. In almost all the taluk more than 45% of the wind speed is above 2.5 m/s except Honnavar (39.58%). Over 20% of the measured hours crossed 3.5 m/s wind speeds in Karwar, Kumta and Supa, in which Karwar being highest (27.38%). These findings along with relatively higher wind speeds (> 2 m/s in high elevation zone) observed in seasonal wind profiles (based on CRU data) are indicative of the prospects of small and medium scale wind applications in Uttara Kannada which are technically achievable and economically viable [12]. Some of these are listed in Table 3. Wind pump for drawing water is an attractive small-scale wind technology for rural energy needs. The agriculture and horticulture intensive zones of Uttara Kannada could get benefited by wind pumps that function at low wind speeds. The Vertical Axis Wind Turbine (VAWT) that can function in wind speeds as low as 1 m/s could be more effective during low wind speed seasons in the region [13]. Reduction in wind speeds and duration could be compensated by hybridizing wind with available alternative resources. Assessment of solar energy potential substantiates that it receives monthly average global insolation (incoming solar radiation) > 5 kWh/m2/day [7]. Hence wind–solar hybrid systems could be considered for endured energy supply in the region. Small-scale wind turbines could also be used in conjunction with biomass gasifies /diesel generators especially in remote areas, although diesel is not a clean option [14]. Battery charging based on wind systems supplements the energy requirements during reduced wind speeds.
Rated power, Prated (kW) |
Rotor swept area (m2) |
Sub-category |
Prated < 1 kW |
A < 4.9 m2 |
Pico wind |
1 kW < Prated< 7 kW |
A < 40 m2 |
Micro wind |
7 kW < Prated< 50 kW |
A < 200 m2 |
Mini wind |
50 kW < Prated< 100 kW |
A < 300 m2 |
(Not defined) |
Table 3: Available small-scale wind turbines [12]
Techno-economic Feasibility: Power harnessed by the WECS can be expressed using expression as given below;
 (3) (3)
Where, P – Wind power  – Air mass density – Air mass density
A – Swept area (area of wind flow) V – Wind velocity
and Cp – Beltz constant ( maximum = 59.3%) taken as 0.4
Figure 5: Percentage occurrence of wind speeds
Wind potential available in the district is estimated using equation 3 and given in Table 4.
Table 4: Wind power potential estimation
Month |
Wind speed m/s |
Power harnessed at A= 30 m2 (kW) |
Power harnessed at A= 160 m2 (kW) |
|
Min |
Max |
Min |
Max |
Min |
Max |
January |
1.80 |
2.10 |
42.69 |
67.79 |
228.61 |
363.03 |
February |
2.10 |
2.37 |
67.79 |
97.44 |
363.03 |
521.83 |
March |
2.10 |
2.37 |
67.79 |
97.44 |
363.03 |
521.83 |
April |
2.45 |
2.67 |
107.65 |
139.33 |
576.48 |
746.14 |
May |
2.90 |
3.00 |
178.53 |
197.64 |
956.05 |
1058.40 |
June |
3.50 |
3.88 |
313.85 |
427.57 |
1680.70 |
2289.71 |
July |
3.60 |
3.93 |
341.52 |
444.31 |
1828.92 |
2379.38 |
August |
3.20 |
3.50 |
239.86 |
313.85 |
1284.51 |
1680.70 |
September |
2.40 |
2.50 |
101.19 |
114.38 |
541.90 |
612.50 |
October |
1.90 |
2.01 |
50.21 |
59.44 |
268.87 |
318.33 |
November |
1.90 |
2.07 |
50.21 |
64.93 |
268.87 |
347.69 |
December |
1.90 |
2.10 |
50.21 |
67.79 |
268.87 |
363.03 |
Total |
|
|
1611.49 |
2091.91 |
8629.85 |
11202.58 |
Estimation shows that Micro and Mini WEC systems are feasible for the district since minimum and maximum power can be harnessed ranges from 1611.49 kW to 2091.91 kW for the swept area of 30 m2 (micro model) and from 8629.82 kW to 11202.58 kW for swept area of 160 m2 (mini model).
Cost of the wind turbines depend on the size, since the transportation and installation difficulties increase with the size. Cost per kilowatt of typical wind turbine ranges from USD 1050 to 1350 in India [15]. As the capacity increases cost/kW decreases but the size of the turbine and blade length increases. Table 5 gives the cost estimation of WEC system.
Table 5: Cost estimation of WECS
Particulars |
Capacity of the turbine |
1.5 kW |
10 kW |
Manufacturing cost |
1950 |
13000 |
Battery bank |
237 |
1422 |
Civil work and installation |
105 |
702 |
Inverter |
79 |
527 |
Maintenance charge & others |
263 |
1756 |
Total cost |
2634 |
17407 |
Annual energy generated (kWh) |
3500 |
30000 |
Unit cost of electricity (USD/kWh) |
0.75 |
0.58 |
A typical 1 kW turbine can generate electrical energy of 1000- 3000 kWh per annum depending on the power density of wind [16]. About 70% of the total system cost is only for wind turbine followed by 9% for battery, 4% for civil work [17, 18]. Unit cost of electricity generated from WECS varies from USD 0.5 per kWh to USD 0.75 per kWh. However with the technology improvement and optimizing the system lower generation cost can be achieved.
Scope for renewable energy exploitation: Decentralised electricity generation through renewable sources is gaining importance due to environmental problems with the supply oriented approaches in planning driven by conventional centralized power generation and distribution. Dispersed generation based on renewable energy (RE) sources addresses the issues related with reliability, voltage profile management and associated economic aspects. Micro grids helps in exploiting locally available RE sources, which are also the fundamental units of the smart grid architecture. However, available energy potential of the region and seasonal variability assessment is the primary step to map the viable regions for power harvesting.
Decentralised generation (DG) is the electric energy production at the distribution side of the power supply network or closer to the load center itself. Distributed energy generation can play pivotal role to meet the electricity demand in a reliable and environmental friendly way. Dispersed generation exploits locally available energy resources which will reduce the exploitation of conventional energy resources and also the congestion of generating units. DG based on RE sources promotes higher penetration of RE resources in the grid. DG plants have the unique advantage of operating in islanded mode (grid isolation mode), during the outage of the central grid. Grid connection can be restored as the grid is energized and electricity can either be transferred to the grid or drawn from the grid. Micro grids are the building units of dispersed generation, which essentially exploits locally available RE resources. Micro grid is an emerging technology and has evolved as smart grid with higher reliability, limited greenhouse gas (GHG) emission, reduced transmission and distribution (T & D) losses. Smart grid architecture is in the infancy stage, which integrates renewable energy based distributed generation with the conventional system using control strategies over a two-way communication link.
As Karnataka State region is facing severe energy and peak power crisis, decentralised solar and wind energy integration to the grid would narrow down the supply demand gap. Micro grids needs to be promoted to meet the community level demand through locally available energy resources. Wastelands in the interior taluks are best suited for grid connected hybrid energy generation, while, micro grids and rooftop generation be promoted in metropolis and biodiversity rich Western Ghats taluks. Share of energy sources in installed capacity can be decided depending on the variability and the geographical location. Renewable energy exploitation with grid integration needs to be promoted through appropriate policy interventions to mitigate the GHG emission through reduced dependence on fossil fuels.
|