|
DATA AND METHODS
Synthesised wind data: Synthesised wind data available from various sources provide preliminary understanding of the wind regime of a region. Depending on the physiographical features and climatic conditions, these data help assess wind potential in the region of interest validated by long term surface wind measurements.
There many wind speed data sets are available of different time periods such as National Aeronautical and Space Agency (NASA) Surface Meteorology and Solar Energy (SSE), National Oceanic and Atmospheric Administration (NOAA-CIRES), Climate Research Unit (CRU) etc. However previous studies are evidently showed that CRU data are reliable and are closer to the Indian Meteorological Department (IMD) surface data and hence used in the present study [7]. CRU at the University of East Anglia maintains climatic average datasets of meteorological variables which contains wind speed data for the period of 1961~1990 compiled from different sources. Further, inter and intra variable consistency checks are performed to minimize data consolidation errors. The Global Land One-km Base Elevation Project (GLOBE) data of the National Geophysical Data Center (NGDC) were re-sampled to 10’×10’ (ten minute spatial resolution) elevation grids where every cell with more than 25% land surface (those below 25% being considered water bodies) represents the average elevation of 100~400 GLOBE elevation points. The climatic average of wind speeds measured at 2 to 20 m anemometer heights (assumed to be standardized during collection) collated from 3950 global meteorological stations together with the information on latitude, longitude and elevation were interpolated based on a geo-statistical technique called thin plate smoothing splines. Elevation as a co-predictor considers topographic influence on the wind speed and proximity of a region to the measuring station improves the reliability of the interpolated data. During interpolation inconsistent data were removed appropriately. This technique was identified to be steadfast in situations of data sparseness or irregularity [8]. The 10’×10’ spatial resolution wind speed data as climatic averages were available for all global regions (excluding Antarctica) [9].
Data from IMD stations located in the district are also acquired for respective locations and which gave the satisfactory results comparing with CRU data set. There are 4 IMD stations in the districts which are listed in Table 1. Cup counter anemometers with hemispherical cups measuring 7.62 cm in diameter were used in Indian Meteorological Department (IMD) observatories until 1973. During 1973-1979 these anemometers are replaced with 3 cup anemometers with 127 mm diameter conical cups, which are placed at l0 m above ground, over open terrain in conformity with international practice.
Table 1: IMD stations in Uttara Kannada
Location |
Latitude |
Longitude |
Elevation (m) |
Karwar |
14° 47' |
74° 08' |
4 |
Kumta |
14° 26' |
74° 25' |
8 |
Honnavar |
14° 17' |
74° 27' |
26 |
Shirali |
14° 05' |
74° 32 ' |
45 |
Sirsi* |
14° 62' |
74° 85' |
610 |
Data from the meteorological observatories at Karwar (for the period 1952-1989), Honnavar (for the period 1939-1989) and Shirali (for the period 1974-1989) obtained from the Indian Meteorological Department, Government of India, Pune, and daily wind data for the period 1990-1993 for these observatories, from the Indian Meteorology Department, Bangalore. The primary data obtained by installing a cup counter anemometer with mechanical counter fixed on 5 m tall guyed masts at Sirsi and Kumta. The anemometer readings were noted down every three hours during the day and mean wind speeds were obtained.
Anemometers at different meteorological stations are set at different height levels. The wind speed recorded at each station has to be adjusted to any constant height prior to analysis. The standard height according to the World Meteorological Organization is 10 m above the ground level which is used for the analysis [10]. The horizontal component of the wind velocity varies a great deal with height under the influence of frictional and impact forces on the ground. The most common model for the variation of horizontal velocity with height is given by the logarithmic wind profile equation 2 [11]
(V1/V2) = (HI/H2) α (2)
Where V1 is a wind speed at height H1 of 10m above ground level, V2 is a wind speed at height H2 above ground level, and α is the roughness factor which is determined by substituting the wind speed data obtained with anemometer height in various wind directions, and found to be 0.30. Table 2 gives the month wise average wind speed in the respective locations.
Table 2: Monthly variation in mean wind speed (km/hr) [3]
Month |
Karwar |
Kumta |
Honnavar |
Shirali |
Sirsi |
January |
5.96 |
5.95 |
5.95 |
6.78 |
6.92 |
February |
6.55 |
7.76 |
6.00 |
6.87 |
6.88 |
March |
8.15 |
9.09 |
6.10 |
7.03 |
7.20 |
April |
9.65 |
9.42 |
6.20 |
7.25 |
8.38 |
May |
11.82 |
9.87 |
7.21 |
7.84 |
9.09 |
June |
12.01 |
11.83 |
7.50 |
8.30 |
11.19 |
July |
15.27 |
13.03 |
7.72 |
8.50 |
18.17 |
August |
11.98 |
11.54 |
6.66 |
7.64 |
14.19 |
September |
7.44 |
6.71 |
4.87 |
5.56 |
11.14 |
October |
5.41 |
6.59 |
4.55 |
5.42 |
8.39 |
November |
4.75 |
6.29 |
5.04 |
6.76 |
7.72 |
December |
5.04 |
7.73 |
6.00 |
9.51 |
8.42 |
Figure 2 shows the comparison of mean wind speed in five IMD stations. At higher elevations in the district mean wind speed is comparatively higher and also in coastal region. Wind speed recorded at Honnavar and Shirali stations are lower which are placed at an elevation of 26 m and 45 m respectively.
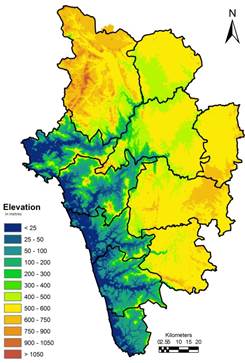
Figure 1: Digital Elevation Model of Uttara Kannada, Karnataka
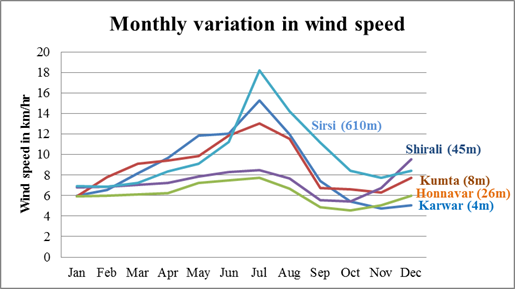
Figure 2: Monthly variation in wind speed
|