
Anaerobic Degradation Pattern of Urban Solid Waste Components

|
Anaerobic Degradation Pattern of Urban Solid Waste Components | |
|
Shwetmala1, Chanakya HN1, T.V. Ramachandra1,2 |
1Centre for Sustainable Technologies, Indian Institute of Science, Bangalore 560012, India
2Centre for Ecological Sciences, Indian Insitute of Science, Bangalore 560012, India
Corresponding Author: cestvr@ces.iisc.ac.in, chanakya@astra.iisc.ac.in
| RESULTS AND DISCUSSION |
Composition of waste substrate:
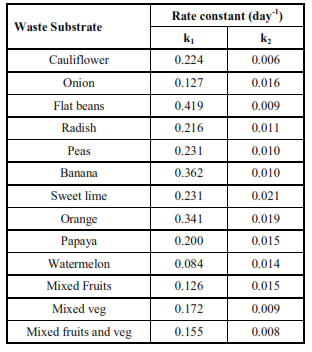
The TS content ranged from 14 to 29% except for onion peels (>90%) and watermelon (<10%; Table 2). Onion, hyacinth beans, peas, sweet lime and orange have a high concentration of VS (>90%; Fig 1), so these can be good substrates for biogas production. Cauliflower had the maximum content of ash indicating the presence of inorganic constituents which does not lead to gas production (Figure 1).
Biological methane production assay:
In this study BMP assay has been defined as a measure of substrate decomposability under typical anaerobic biomethanation conditions and also to estimate the gas production from different category of waste substrate under near ideal conditions of TS, inoculum and physicochemical conditions.
Figure 1: VS and Ash constituents of waste substrate

Table 3: First order rate constants for
decomposition of waste substrate
The result of BMP assay at a 0.5% concentration of feedstock is presented in Fig 2. The biogas production ranged from 205 to 616 ml/g of TS. Orange and Sweet lime showed low gas production levels. Citrus fruit peels have a tendency for rapid volatile fatty acid (VFA) formation which interrupts methanogenesis. Pea shells, flat bean (Vicia sp), cauliflower, onion and radish showed a high gas production whereas banana peel showed a moderate gas production level (≈465 ml/g TS). Mixed fruit, mixed vegetable and mixed fruit+vegetable had moderate gas production of 404, 407 and 446 ml/g TS, respectively
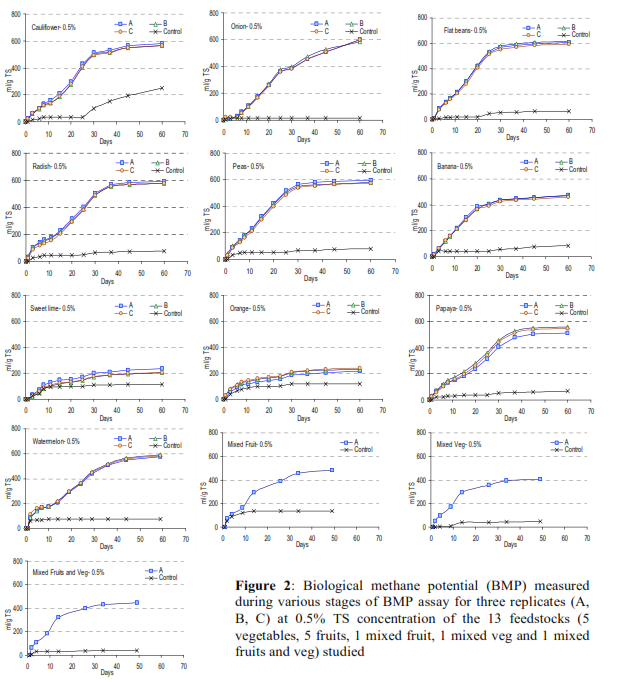
Figure 2: Biological methane potential (BMP) measured
during various stages of BMP assay for three replicates (A,
B, C) at 0.5% TS concentration of the 13 feedstocks (5
vegetables, 5 fruits, 1 mixed fruit, 1 mixed veg and 1 mixed
fruits and veg) studied
The gas composition measurements showed the presence of >50% of methane from most of the waste substrates. This indicates that the rate of acidogenesis and methanogenesis are well balanced. Cauliflower, peas, watermelon and flat beans showed a good methane content (>60%) and it is an indication of absence of VFA induced suppression of methanogenesis. Whereas onion, orange and sweet lime showed poor methane yield of 11%, 22% and 20%, respectively, due to accumulation of VFA and subsequent methanogenic inhibition.
Degradation pattern and rate kinetics:
The biogas evolution data revealed that
anaerobic decomposition of different organic
wastes occurred in two to three phases. The
results obtained are shown in Figure 2. Among
the feedstocks only banana peel and pea shells
showed two phase degradation whereas other
feedstocks showed three phase decomposition.
The extent of organic carbon evolved in phase 1
is expected to emerge from the easily
decomposable fractions of waste - pectin,
starches, etc., whereas phase 2 represents
breakdown of the slowly decomposing and/or
resistant fractions. Stationary phase is
considered as phase 3. Among the ten
feedstocks, banana peel, cauliflower leaves and
citrus peels had similar kinds of decomposition
patterns, involving a very rapid initial decay. In
most cases the phases 1 and 2 representing
decomposition of pectins and structural
materials were merged as phase-I and stationary
phase (phase 3) is considered as phase-II.
Usually, phase-II occurred between 20 to 30
days of incubation. Flat bean and banana show
a single degradation over a 20 to 25 days
period. Decomposition of only sweet lime and
orange waste occurred with a second phase
after 8-12 days of incubation.
BMP of waste degradation was assumed to
follow the first-order rate of decay, as solid
waste degradation in composting and landfill
also follows first order kinetics (Hamoda et al.,
1998; Qdais et al., 2008). The first-order rate
constant was determined using gas yield on
either 1 st day for different categories, whereas
3rd day is considered for sweet lime and
watermelon as gas production has started from
3rd day of incubation. For all kinetic constants,
the linear correlation of data was assessed by
the coefficient of determination (R2).
Decomposition rate constants k1 and k2
corresponding to phase-I and II were
determined for various waste substrate (Table
3). Among the ten feedstock, flat bean showed
a most rapid initial decay with k1 and k2 value
of 0.419 and 0.009 day-1.respectively, whereas
onion peels showed a very slow initial decay
with k1 value of 0.127 day-1, probably due to
high sulphur content (H2S). Thus kinetics
constants can be used to know the time required
to oxidize the readily and slowly degradable
fraction of organic waste substrates.