![]()
ConsequeNces
of catchment processes and climatE changes on the ecological status of large
shallow temperate lakes
Tiina Noges, Arvo Jarvet, Reet Laugaste,
Enn Loigu, Ulle Leisk, Ilmar Tonno, Peeter Noges
Institute of Zoology and Botany,
Estonian Agricultural University,
Vortsjarv Limnological Station, 61101 Rannu,
Tartumaa, Estonia. E-mail: tnoges@zbi.ee2
Institute of Geography & Institute of Zoology and Hydrobiology, University of Tartu, Vanemuise 46, 51014 Tartu,
Estonia. E-mail: ajarvet@ut.ee
Tallinn Technical University,
Department of Environmental Engineering,
Ehitajate tee 5, 19086, Tallinn,Estonia.
E-mail: ennloigu@edu.ttu.ee
Synopsis.
Watershed of L. Võrtsjärv (3 104 km2)
belongs to the basin of L. Peipsi (47 800 km2). Regular
investigation of these large, shallow, nonstratified lakes (L. Peipsi: area 3
555 km2, mean depth 7.1 m; L. Võrtsjärv: 270 km2,
2.8m) started in the 1960s. In the 1980s, the riverine nutrient discharge
increased drastically while in the early 1990s a sharp decrease occurred,
especially in the loadings of nitrogen. As nitrogen loading decreased faster
than phosphorus loading, the N/P loading ratio decreased. There has been an
increase in cyanobacterial dominance in the late 1960s and early 1970s, decline
in the late 1970s and 1980s, and a new increase in the late 1990s in both lakes.
Since the beginning of the 1990s, the biomass of N2-fixing species
has clearly increased in L. Võrtsjärv but much less in L. Peipsi. The
increase of cyanobacterial dominance and the occurrence of water blooms can be
caused by reduced N loading and decreased N/P ratio. The ecosystem of L. Võrtsjärv
is very sensitive to water level fluctuations, which follow the North Atlantic
Oscillation index refelecting climate changes in the northern hemisphere. In
deeper L. Peipsi the direct influence of the water level is not so obvious.
Regular investigation of two
large shallow nonstratified lakes Peipsi (3
555 km2, mean depth 7.1m)
and Võrtsjärv (270 km2,
mean depth 2.8 m) started in the 1960s and up to now about 35-year timeseries on
water chemistry and biology have been collected. L.
Peipsi is one of the most important lakes in Europe having the fourth
largest surface area after Ladoga, Onega, and Vänern. Being located on the
Estonian-Russian border, L. Peipsi is a transboundary waterbody and the
largest international lake in Europe. L. Võrtsjärv is the largest lake
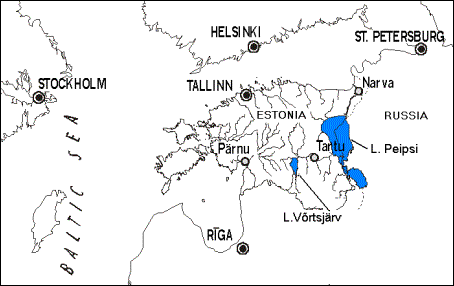
belonging entirely to Estonia (Fig. 1).
Watershed
of Lake Võrtsjärv (3 104 km2)
belongs to the basin of L. Peipsi (47 800 km2). Riverine
transport is the most important pathway for the input of nutrients into both
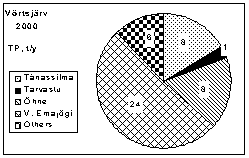
lakes. For L. Võrtsjärv four main inflows, the rivers Väike Emajõgi, Õhne,
Tarvastu and Tänassilma form 70–75% of the water discharge, and 80–85% of
the total load of substances. In case of L. Peipsi, the
majority of phosphorous and nitrogen compounds (> 80%) is carried into the
lake by the rivers Velikaya and Emajõgi (outflow from L. Võrtsjärv). The
first carrying biologically treated sewage from the Russian town Pskov (201 400
inhabitants), the latter transporting wastewater from the Estonian town Tartu
(101 200 inhabitants). The wastewater of Tartu remained untreated for a long
time; the treatment plant has been in operation since the end of 1998. The
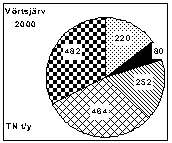
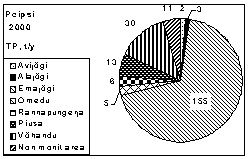
contribution of the R. Emajõgi in the loading of total nitrogen (TN) and
phosphorus (TP) into L. Peipsi from Estonian territory is ca. 70% (Fig.
2). The Russian R.
Velikaya is contributing about 65% of all nutrient loading into L. Peipsi (Stålnacke,
2001) and about 85% of that coming from the Russian territory.
Lake
Peipsi consists of three parts. The area of the largest northern part, L. Peipsi
sensu stricto, is 2,611 km2,
mean depth 8.4 m and the maximum depth 12.9 m. The southern part, L. Pihkva with
an area of 708 km2 and mean depth of 3.8 m is connected with L.
Peipsi by the narrow river‑shaped L. Lämmijärv having an area of 236 km2
and mean depth of 2.6 m. The catchment area (47,800 km2) involves
parts of Estonian, Russian and Latvian territories.
The volume of water in L. Peipsi is 25 km3
at the long-term mean water level (30.00 m above sea level) and the
mean residence time of water is about 2 years. The outflow, the River Narva,
runs its waters into the Gulf of Finland.
L.
Peipsi is an unstratified eutrophic lake, L. Lämmijärv has some dyseutrophic
features, while L. Pihkva is a eutrophic, or even hypertrophic water body (Tab.
1).
The
measurements of TP and TN in L. Peipsi started in 1985 and in the Estonian
rivers in 1984. In Russian rivers and waters of L. Peipsi mainly the mineral
forms of nutrients (ammonium, nitrites, nitrates, phosphates) have been tested.
The data series on mineral N and P compounds in L. Peipsi started in 1968 and in
the rivers in 1976. Regular biological data series date back to 1962.

Lake
Võrtsjärv is highly eutrophic (Table. 1) receiving nutrients from four main
rivers (Fig. 2). The outflow of L. Võrtsjärv, the River Emajõgi, has a small
slope, only 3.8 cm km-1. Opposite flow in the upper course of that
river occurs almost every spring, while during about a half month period the
lake has no outflow (Järvet, 1995).
Table
1. Indices reflecting trophic status of lakes Peipsi and Võrtsjärv (modified
from Haberman et al., 1998; Laugaste et al., 2001; Starast et al., 2001)
|
Parameter |
Units |
L. Peipsi mean |
L. Pihkva |
L.Lämmi-järv |
L. Peipsi s.s. |
L. Võrtsjärv |
|
TP |
mg P m-3 |
42 |
63 |
53 |
35 |
54 |
|
TN |
mg N m-3 |
768 |
1010 |
923 |
678 |
1600 |
|
Chlorophyll a |
mg m-3 |
18 |
26 |
25 |
14 |
24 |
|
Secchi depth |
m |
1.8 |
1.3 |
1.4 |
1.8 |
1 |
A
long-term sinusoidal fluctuation of the water level (WL) with a period of about
30 years is characteristic of both lakes (Fig. 3). A rather smooth continuous
decrease (1928-1940) or increase (1940-1957; 1965-1990) within the period
resembles a long-term trend and can be distinguished from it only in the context
of a longer time series. Apparent periodicity is probably associated with
large-scale fluctuations in solar activity and atmospheric processes, since it
appears in the same way in large geographic regions. Similar periodicities with
a spectral density maximum of 28-32 years have been found in the WL dynamics of
the lakes of Saimaa, Ilmen and Onega (Masanova and Filatova, 1985), as well as
for different hydrological elements of Lake Ladoga (20-30 years) (Malinina et
al., 1985) and Lake Müggelsee (Behrendt and Stellmacher, 1987). In
addition to visual analysis of water level series, occurrence of hidden
periodicity was studied with the help of the standard method of spectral
analysis. Using Fourier’s
transformation of the correlation function, spectral density can be determined (Järvet,
2000). Altogether three groups of periodicity were detected: 1) short periods
with a spectral peak at 3.6 years; 2) medium periods at 6.4 years; 3) long
periods with a length between 24 and 32 years. The spectral peak at 25.6 years
seems to have an exceptional position.
Shifts of the spectral behaviour of water level depends on the
amount of precipitation. The corrected time-series of spatial mean annual
precipitation in Estonia indicates a clear periodicity: cycles of 50–60,
25–33 and 5–7 years were detected (Jaagus, 1998). Temporal variability of
evaporation is much lower than that of the runoff of rivers and water level of
lakes. When annual precipitation in Estonia is less than 650 mm, then water
level will depend on precipitation, and evaporation is stable (Järvet, 1998).
When precipitation is higher, evaporation will increase with rising amount of
precipitation. Based on the comparison of water balance elements, it can be
concluded that the temporal variability of the water level of large lakes is
much higher than the variability of precipitation.
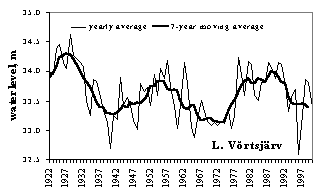
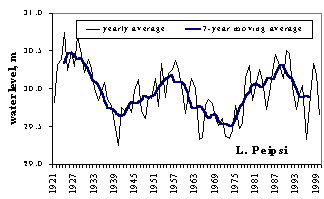
Figure
3. Long-term dynamics of the water level of lakes Võrtsjärv and Peipsi
In
present paper we address the questions, how the runoff, nutrient concentrations
and riverine loadings have been changed during the last four decades, and how
these changes have influenced the most sensitive part of the lake ecosystem –
phytoplankton. The consequences of global climate change are discussed as well.
2. Changes in riverine discharges
Significant
changes in the hydrological regime of rivers have taken place due to global
climate changes and also changes in land-use and agricultural practice.
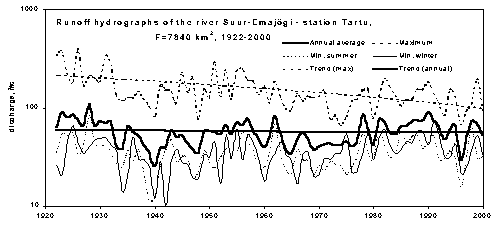
Statistical analysis indicated that annual runoff remained almost changeless,
however, the maximum and minimum discharges changed significantly. During the
last 80 years, the amplitude of seasonal fluctuation of the runoff of the R.
Emajõgi decreased - the shape of hydrographs became more flat (Fig. 4). The
values of maximum discharges have decreased by 0.05 - 0.7 m3/s per
year for most rivers, however, the trend was different for different years.
Analysis showed that the range and values of runoff were bigger in the beginning
of the 20th century and more levelling after the 1960s. The decrease
was most pronounced during the snowmelt period. It can be explained by
shortening of the snow cover period and by the fact that frozen periods in
winter often changed with thaw periods. Moreover, the beginning of spring
melt-time shifted to the earlier date and the break-up of ice-cover occurs now
on the average 15 days earlier than in three last centuries.
3. Changes of the river water chemistry
The present level of biological oxygen demand (BOD7) in most rivers of L. Peipsi basin is quite low if compared with the 1980s (Loigu et al.,2001) when the highest amount of wastewater was discharged into the rivers. The biochemical oxygen demand of natural river water, which is not directly influenced by human activity is, as a rule, less than 3.0 mgO2/l. BOD7 3-5 mgO2/l indicates moderate human impact and values generally more than 5 mgO2/l indicate obvious pollution. BOD7 level in rivers of L. Peipsi basin is generally classified as good (Class II) or moderate (Class III) during the last decade (Fig. 5). The fluctuation of annual 90% values is also quite low, which shows high efficiency of wastewater management in towns and villages in the
basin.

Figure
5. Variability
of annual BOD7 value (by 90-percentile) in rivers of L. Peipsi basin
in 1992-2001.
The
rather high BOD7 in the R. Emajõgi, especially at the outlet of L. Võrtsjärv
(Rannu-Jõesuu station) is caused by high content of organic matter in L. Võrtsjärv.
BOD7 at Rannu-Jõesuu station is the highest in summer during the
period of intensive photosyntesis due to the high amount of phytoplankton.
Rivers discharging into L. Võrtsjärv are rather nutrient-rich. Organic matter
produced in this highly eutrophic lake is the main factor causing relatively
high biochemical oxygen demand together with high organic nitrogen and
phosphorus concentrations in the R. Emajõgi. Therefore, the high level of BOD7
at Rannu-Jõesuu station does not indicate direct organic pollution. The content
of inorganic nitrogen and phosphorus at the outlet from L. Võrtsjärv is low
because it is transferred to organic nitrogen and phosphorus during the
photosyntesis process in the lake. As a result of phytoplankton degradation,
upstream biochemical oxygen demand in summer and autumn (5-7 mgO2/l)
can be even higher than downstream at Kavastu station, near the Tartu wastewater
outlet.
One
of the main issues of Estonian water protection is the eutrophication of surface
waters caused by the increased load of nutrients of anthropogenic origin. The
eutrophication level of lakes depends on the nutrient content in rivers. The
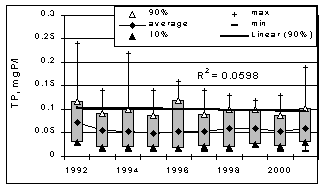
critical content of total nitrogen above which the eutrophication of rivers
starts is 2.5 mgN l-1 (Loigu 1992). In Estonian rivers considered as
background rivers, TN concentration was lower than the critical value in 98% of
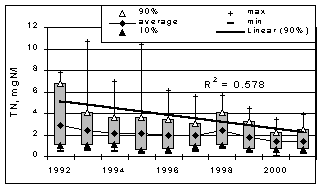
all samples, the mean concentration being 1.5 mgN l-1. The nitrogen
level in Estonian rivers is still quite high although the content of nitrogen
has decreased in most rivers in recent years due to decreased agricultural
pollution load. Concentration of nitrates was the highest in 1985-1987 when the
use of fertilisers was very intensive and the major part of them leached into
surface waters (Loigu & Leisk, 1996). The level of agricultural production
and also nitrate concentration was the highest in 1984-1988, while by 1995-1999,
which was the period of low agricultural production, the nitrogen concentration
in rivers decreased (Fig. 6).
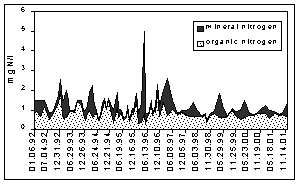
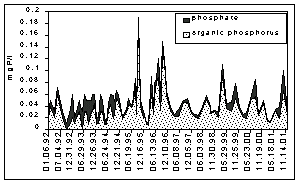
At
the beginning of the R. Emajõgi the percentage of organic nitrogen and
phosphorus is high and the content of mineral forms is low as mineral nutrients
are transformed to organic form in the process of photosyntesis taking place in
L. Võrtsjärv (Loigu & Leisk 1989). Organic N and P form on the average 72%
of TN and TP, the content of
mineral forms is higher only in spring flood periods (Fig. 7).
4.
Changes of nutrient loading
In
the 1980s, the riverine discharge of nutrients into lakes Peipsi and Võrtsjärv
increased while in the early 1990s a sharp decrease occurred, first of all in TN
loadings (Fig. 8). This change was caused mainly by the collapse of the
soviet-type agriculture characterised by heavy fertilization of fields often
accompanied by substantial nutrient leakage into water bodies. A significant
reduction in fertilizer use, typical for the transitional economy during recent
years, diminished nutrient losses from the catchment. Compared to the level of
the end of the 1980s, only 5–10% of N, P and K mineral fertilizers and 30% of
the manure were applied in the agricultural lands at the end of the 1990s (Järvet
et al.,2002). In addition to the
change of land use pattern and fertilization intensity, variation in
hydrological conditions plays an important role in nutrient and organic matter
runoff from rural catchments. However, this influence is specific and varies for
different nutrients. For instance, the annual water discharge correlated
positively with the runoff of BOD5, NO3–N and TIN
(p<0.05), but there was no statistically significant correlation between
stream discharge and NH4–N and PO4–P transport for
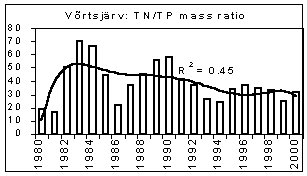
monthly time series. As TN loading decreased faster than TP loading, the TN/TP
ratio in the loadings decreased (Fig. 9).
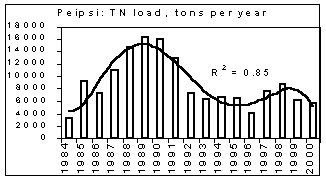
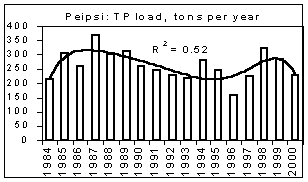
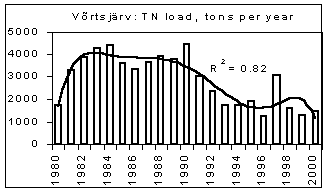
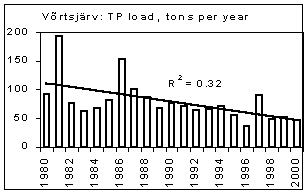
Figure
8. Annual runoff of total nitrogen (TN) and phosphorus (TP) into L. Peipsi from
Estonian side in 1984–2000, and into L. Võrtsjärv in 1980–2000
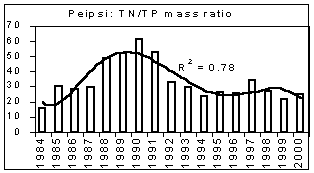
Figure
9. The ratio of total nitrogen and total phosphorus (TN/TP) in annual external
loading of L. Peipsi (from Estonian part) and of L. Võrtsjärv
5.
Consequences of the changed nutrient loading on the phytoplankton of lakes
In
L. Võrtsjärv average phytoplankton biomass
in May-October 1963-2001 was 20 gWW m-3 and it has varied from 1 to
100 gWW m-3; in L. Peipsi s.s.
the respective values in 1962-2001 were 10, 0.35 and 61 gWW m-3. Many
species of bloom-forming cyanobacteria are able to use molecular nitrogen at low
N/P ratio if N is the limiting nutrient. Observing the changes in cyanobacterial
dominance from the beginning of the 1960s in lakes Peipsi and Võrtsjärv, one
can notice the increase in the late 1960s and early 1970s, decline in late 1970s
and 1980s and a new increase in late 1990s in both lakes (Fig. 10). In L. Võrtsjärv
changes are much less pronounced than in L. Peipsi. In L. Võrtsjärv dominant
cyanobacterial species Limnothrix
planktonica, L. redekei,
Planktolyngbya limnetica are not able to fix N2, the main
N2-fixing species, Aphanizomenon
skujae, does not achieve
dominating status. In L. Peipsi N2-fixing
species Aphanizomenon flos-aquae and Gloeotrichia
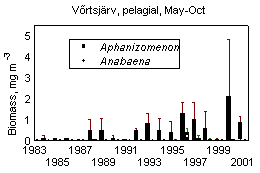
echinulata prevail in summer phytoplankton. Since the beginning of the
1990s, the biomass of N2 fixing species has increased in both lakes
(Fig. 11).
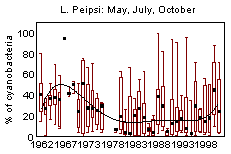
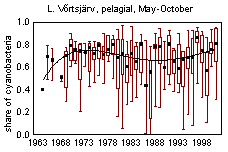
Figure
10. Changes in the dominance of cyanobacteria in phytoplankton biomass of
L. Peipsi and L. Võrtsjärv since the 1960s.
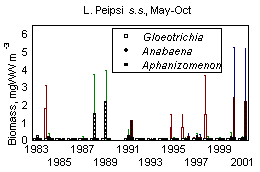
Figure
11. Biomass (median, quartiles, min, max) of N2-fixing cyanobacteria
in lakes Peipsi and Võrtsjärv in 1983-2001
Cyanobacterial
blooms are mainly attributed to the declining water quality. In lakes Peipsi and
Võrtsjärv cyanobacteria constituted a substantial part of summer phytoplankton
biomass already 40 years ago and their share declined in the conditions of
extremely heavy nitrogen loading in the 1980s (Fig. 10). In both lakes
cyanobacterial blooms have been documented since the beginning of the 20th
century (Mühlen & Schneider, 1920, Laugaste et
al., 2001). The increasing
dominance of cyanobacteria and the
occurrence of water blooms in both lakes can be caused by reduced nitrogen
loading and decreased TN/TP ratio. Present situation is, however, closer to that
of the 1960s when nitrogen load was lower and water blooms more common than in
the 1980s at the time of extensive development of agriculture. So, water
blooms may not always indicate eutrophication even if the blooms are heavy and
bring about fish-kill as it happened during the bloom of G. echinulata in August, 2002.
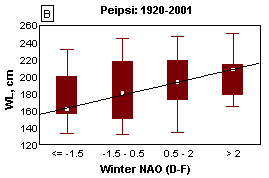
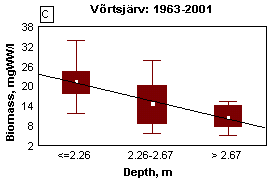
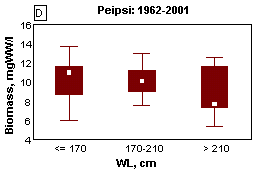
The North Atlantic Oscillation (NAO), which is defined through the variability of air pressure differences between the North (Iceland) and South (Azores), dictates climate variability over a large area of the Atlantic, North America and Europe, especially during winter (Hurrell et al., 2001). Variation in heat and moisture transport between the Atlantic and surrounding continents affect water balance components of lakes, such as precipitations, riverine inflow and evaporation, resulting in changes of the water level. In both lakes Peipsi and Võrtsjärv mild winters associated with high North Atlantic Oscillation index (NAO) bring about higher water level (Fig. 11A&B). In very shallow L. Võrtsjärv where the annual amplitude of WL is 1.4 m and the absolute range is 3.2 m, the fluctuations of water level (WL) have strong influence on the ecosystem. In low-water years, better water column illumination and increased release of phosphorus from resuspended bottom sediments result in substantially higher phytoplankton biomass than in high-water years (Fig. 11C). In deeper L. Peipsi where seasonal and absolute WL variation ranges approximately 1/5 and 1/2 of the mean depth, respectively, the direct influence of the WL is not so obvious (Fig. 11D).

Figure
11. Relationship between winter NAO, yearly
average water level (WL) or lake depth and phytoplankton biomass in lakes
Võrtsjärv and Peipsi (median, minimum, maximum, quartiles).
For
the ecosystem of L. Võrtsjärv warmer and wetter climate could bring about
higher water levels. The deeper the mixed water column, the lower is the average
light intensity causing reduced phytoplankton biomass (Nõges & Nõges,
1998). In the deeper water both resuspension and denitrification rates are
lower, the first reducing the phosphorus release from the bottom sediments and
causing lower P concentration while the second reasoning the increased
nitrogen concentration (Nõges & Nõges, 1999). Consequently, in
warmer world the N/P ratio in Lake Võrtsjärv would be higher and N2-fixing
cyanobacteria have less chances to develop (Fig. 12).
In
the watersheds shorter freezing time of the soils and the increased amount of
precipitation in warmer and wetter world can cause the higher nutrient leaching
from the soils and accelerate the eutrophication of water bodies. We have
noticed that in the 1990s, the spring peaks of the riverine nutrient discharges
have been shifted to the earlier period (from the beginning April to mid March)
than it used to be in the 1980s and earlier. Despite lower intensity of land
use, the wintertime nutrient losses are almost as high as during former years
because of increased water discharge and higher share of overland flow in
winter.
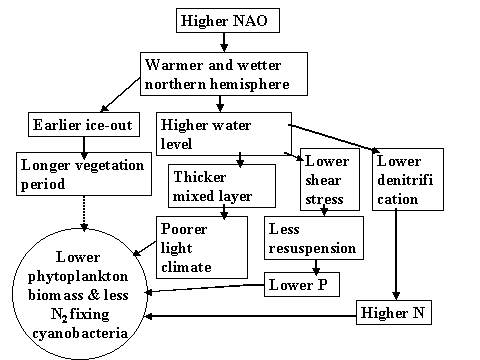
Figure 12. The assumed consequences of
the global warming on the phytoplankton of Lake Võrtsjärv
Acknowledgements
Funding
for this research was provided by the project No 0370208s98 of Estonian Ministry
of Education, by Estonian Science Foundation grant 4080, and by the European
Union project MANTRA-East (contract EVK1-CT-2000-00076). We also used data
obtained in frames of the State Monitoring Program of the Estonian Ministry of
Environment.
References
Behrendt,
H. & Stellmacher, R. 1987. Long-term changes in water quality parameters of
a shallow eutrophic lake and their relations to meteorologic and hydrologic
elements. The Influence of Climate Change and Climatic Variability on the
Hydrologic Regime and Water Resources (Proceedings of the Vancouver Symposium,
August 1987). IAHS Publ. 168: 535-544.
Hurrell,
J.W., Kushnir, Y. & Visbeck, M., 2001. The North Atlantic Oscillation.
Science. 291: 603-605.
Jaagus,
J. 1998. Climate fluctuations and trends in Estonia in the 20th century and
possible climate change scenarios. In Climate
Change Studies in Estonia (T. Kallaste and P. Kuldna, eds.), pp. 7-12.
Stockholm Environment Institute Tallinn Centre.
Järvet,
A., Mander, Ü., Kull, A., Kuusemets, V. Nutrient runoff change in a rural
catchment in South Estonia. – Large Rivers Vol. 13, No. 3–4. Arch.
Hydrobiol. Suppl. 141/3–4, p. 305–319, November 2002.
Järvet,
A. Water regime of Lake Võrtsjärv.
– Estonia, Geographical Studies 8
(Eds. Tiia Kaare and Jaan-Mati Punning). Estonian
Academy Publishers, Tallinn
2000, pp. 72–88.
Järvet,
A. 1998. Long-term changes in time series of water balance elements. In Country Case Study on Climate Change Impacts and Adaptation Assessments
in the Republic of Estonia (A. Tarand
and T. Kallaste, eds.), pp. 69-71. Stockholm Environment Institute Tallinn
Centre.
Laugaste,
R., Nõges, T., Nõges., P., Jastremskij, V.V., Milius, A., Ott, I., 2001.
Algae. In: Pihu&Haberman (Eds.), Lake Peipsi. Flora and Fauna. Tartu: 31-49.
Malinina,
T.I., Filatova, I.V. & Filatov, N.N. 1985. Long-term changes in the elements
of water budget of Lake Ladoga. In Problemy issledovaniya krupnyh ozer.
Leningrad: 79-81 (in Russian).
Masanova,
M.D. & Filatova, I.V. 1985. Probability structure of interannual water level
changes in North-Western lakes. In Problemy issledovaniya krupnyh ozer.
Leningrad: 81-84 (in Russian).
Mühlen,
M. von zur & Schneider, G. 1920. Der See Wirzjerw in Livland. Archiv für
die Naturkunde des Ostbaltikums, 14: 1-156.
Nõges,
P., Nõges, T. 1998. The
effect of fluctuating water level on the ecosystem of Lake Võrtsjärv, Central
Estonia. - Proc. Acad. Sci. Estonia. Ser.
Ecology. 47. 2: 98-113.
Nõges,
T. & P. Nõges. 1999. The effect of extreme water level decrease on
hydrochemistry and phytoplankton in a shallow eutrophic lake. Hydrobiologia, 408/409:
277-283.
Stålnacke,
P. (ed.) (2001) Nutrient Loads to Lake Peipsi. Environmental Monitoring of Lake
Peipsi/ Chudskoe 1998- 99. Subproject Report Phase 2, Jordforsk Report No. 4/01,
65 pp.