

Environmental Performance Indices: Taluk-wise assessment, Karnataka
T V Ramachandra, Aditya Joshi
IISc-EIACP,
Environmental Information System, CES TE15
Indian
Institute of Science, Bangalore 560012
E Mail:tvr@iisc.ac.in, envis.ces@iisc.ac.in, Tel:
91-080-22933099/23608661
1. Introduction
The natural world or the habitat in which an organism exists, and functions is known as the Environment. It consists of all the biotic and abiotic components in the surroundings. Activities of the biotic components, ranging from micro to macro scale, have an effect on the ecosystem. There is a delicate equilibrium among the biotic and abiotic components. The delicate equilibrium is being disturbed, due to unplanned anthropogenic activities, which have resulted in the catastrophic consequences evident from frequent floods and droughts. Escalated anthropogenic activities subsequent to the industrialization era have impacted the environment more severely than at any other time in the human history. Increased global temperature, extreme weather conditions, melting of icecaps, rising sea levels, extreme droughts and floods, water scarcity, high levels of pollution, poverty, hunger, extreme temperatures, deforestation, widespread diseases/infections, declining life quality are just few of the consequences. Therefore, it has become extremely important to assess the condition of the ecosystem in order to facilitate proper measures to enhance the quality of environment and prevent it from further deterioration. There has been a tremendous improvement in environmental assessment methods. Technology has advanced significantly which facilitates easy access and interpretation of data required in environmental research. Real-time data as well as historical data is available for various environmental parameters like Climate Indicators, Marine data, Atmospheric Chemistry Atmospheric Phenomena, Land-Surface data, Cryosphere data, Biosphere data, Terrestrial data, etc. There are numerous data sets available from a variety of sources, including experimentally acquired data to data obtained from satellite-based remote sensing. NASA's Giovanni, NASA's Earthdata search, and EU's Copernicus Climate Data Store are few of the web service providers. Numerous software applications are available that enable quick and accurate processing of huge volumes of data, allowing the researcher to obtain accurate results to base their decisions. MATLAB, QGIS, ARCGIS, Whitebox GAT, uDig, gVSIG, GeoDa, FalconView and MapWindow etc. are few of the software applications available for facilitating easy data processing. There are several indices which try to assess environmental performance and sustainability on various scales ranging from city level to country level. Air quality Index, Ecological Footprint, Material Footprint, Environmental Performance Indicator (EPI) are few examples of environmental indices.
1.1 Sustainable Development
Development must be ensured in environmental, social and economic sectors in order to have a sustainable future.Environment, Society and Economy are the 3 pillars of sustainability. Progress in all three sectors is necessary in order to ensure overall development and high quality of life. In the last 2 decades there has been substantial efforts by all countries and global institutions to preserve the environment and enhance social and economic life of all people. In order to ensure a better and more sustainable future for all, 17 interlinked global goals and 169 targets have been designed by UNGC in 2015, known as Sustainable Development Goals (SDGs), which are expected to be accomplished by 2030. The mission statement of SDGs is "A blueprint to achieve a better and more sustainable future for all people and the world by 2030". The 17 SDGs are:
| Goal | Theme | Goal | Theme |
| 1 | No Poverty | 10 | Reduced Inequality |
| 2 | Zero Hunger | 11 | Sustainable Cities and Communities |
| 3 | Good Health and Well-being | 12 | Responsible Consumption Production |
| 4 | Quality Education | 13 | Climate Action |
| 5 | Gender Equality | 14 | Life Below Water |
| 6 | Clean Water and Sanitation | 15 | Life on Land |
| 7 | Affordable and Clean Energy | 16 | Peace and Justice Strong Institutions |
| 8 | Decent Work and Economic Growth | 17 | Partnerships to achieve the Goal |
| 9 | Industry, Innovation and Infrastructure |
All countries, especially developing countries like India are striving to achieve a balance between socio-economic development and well-being without overusing existing biophysical resources. As such there are certain thresholds defined for biophysical factors within which humanity can survive, develop and thrive for generations to come. These thresholds/boundaries are known as Planetary Boundaries. Currently there are nine planetary boundaries defined and they are:
| Climate change | Biodiversity loss | Biogeochemical flows |
| Ocean acidification | Land use | Freshwater use |
| Ozone depletion | Atmospheric aerosol loading (Particle pollution) | Chemical Pollution |
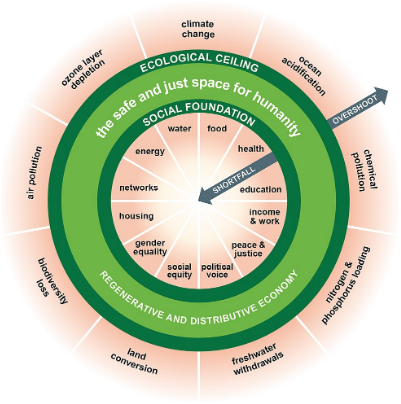
DOUGHNUT ECONOMICS
Integration of the concept of Planetary Boundaries and social boundaries for overall sustainable development leads to the concept of Doughnut economics.
Numerous studies are being conducted to assess the environment. The Bertelsmann Stiftung Foundation publishes the Sustainable Development Report [1] annually, which includes the SDG Index, which evaluates each country's progress towards achieving the Sustainable Development Goals. Yale university publishes the EPI [2] (Environmental Performance Index) annually, which at a national scale determines and measures the level of achievement of the established environmental targets. The EPI ranks 180 nations on climate change performance, environmental health, and ecosystem vitality using 40 performance indicators across 11 issue categories. The Government of India's NITI (NATIONAL INSTITUTION FOR TRANSFORMING INDIA) AAYOG publishes the SDG India Index[4] annually which measures and ranks the progress made by states and union territories on various economic, environmental, and social parameters. These assessments can be used to compare environmental conditions, sustenance and development of various regions. These assessments also help to infer the current conditions of individual regions and help in framing policies which will help in improving sectors which are lacking and underdeveloped and ensure overall development. The current study evaluates and ranks the taluks of Karnataka in order of their development and sustenance.
1.2 Need of taluk wise environment indices in Karnataka
There are several studies attempted to assess the environmental status. However, all these studies assess the environment on a larger scale, usually global and country-level like the EPI, SDG Index, Safe and Just Operating Space for India [5](Roy et al.) etc.
The environmental assessment is primarily done by measuring the present conditions of the region against the safe, sustainable conditions (or goals) set for the region. As the scale decreases it becomes difficult to assess the environment as the goals and conditions vary very distinctively from region to region. Indices like EPI and Sustainable Development Index needs to be assessed at decentralized levels considering smaller city/town scales for decentralized good governance[6].
Objective
The main objectives of the study is to
- provide a data-driven assessment of sustenance of natural resources for the taluks of Karnataka
- evaluate and rank the taluks of Karnataka in order of their development and sustenance
- provide separate environmental, social and economic scores
- provide an analytical assessment of sustenance/performance which can be helpful in framing policies to ensure overall inclusive development.
The main objective of computing EPI or environmental performance indices at taluk levels through integrated spatial approach considering environmental (17 parameters - Temperature, Normal Rainfall (2021), Forest Cover (2011), Forest Ecosystem Services, agriculture (Croplands and Horticulture), Ecosystem Services, Wetland Ecosystem Services, Percentage Uncultivable Land (2011), Stage of Ground Water Extraction, Amount of Carbon dioxide (CO2) in Atmosphere, Amount of Carbon monoxide (CO) in Atmosphere, Amount of Methane (CH4) in Atmosphere, Amount of Ozone (O3) in Atmosphere, Amount of Formaldehyde (HCHO) in Atmosphere, Amount of Nitrogen dioxide (NO2) in Atmosphere, Amount of Sulphur dioxide (SO2) in Atmosphere, Amount of Black Carbon (BC) in Atmosphere, Amount of PM2.5 in Atmosphere), social (14 parameters - Population Density (Projected 2022), Sex Ratio, Literacy Rate (2011), Total Workers Population (2011), Number of Hospitals per sq.km, Number of Medical Shops per sq.km, Percentage of Irrigated Land (2011), Pupil-Teacher Ratio (Schools), Student-Lecturer Ratio (PU Colleges), Number of Professional Degree Colleges per sq.km, Percentage of Households with Electricity, Percentage of Households with LPG/PNG connections, Number of Veterinary Hospitals per sq.km, Number of Internet Connections per sq.km) and economic (10 parameters: Per Capita Income, Number of Factories per sq.km, Number of employees in Factories per sq.km, Number of Small-scale Unit Registered District Industrial Centres per sq.km, Number of people working in Small-scale Unit Registered District Industrial Centres per sq.km, Number of Banks per sq.km, Number of Post Offices per sq.km, Length of Urban Roads per sq.km, Length of Rural Roads per sq.km, Number of Vehicles per sq.km) parameters to understand the current environmental status with respect to carrying capacity of a taluk considering safe environmental boundaries (i.e., biophysical ceiling) and proportion of the population meeting social aspects . The outcome of the current study aids in decision making through understanding of the present status of environmental performance and region’s ability to meet Sustainable Development Goals.
2. Materials and Method
2.1 Study Area: Karnataka State, India
2.2 Data, Sustainability Indicators and Spatial analysis
Environment, Society and Economy are the three pillars of sustainability. Overall progressive and inclusive development is achieved only when there is development in all three sectors. EPI is computed considering, 41 indicators (17 Environmental, 14 Social, 10 Economic) have been included and evaluated at the taluk level.
Acquiring Data
- Data from https://karnataka.data.gov.in/ is acquired in .csv format.
- Data from 1) District at a glance (DAG’s) pdf’s, 2) Valuation of Ecosystem Services, Karnataka State, India Report of the NCAVES Project (Ramachandra et al. 2021) and 3) Karnataka Groundwater Resource Assessment Report as on March-2020 is manually entered into excel sheet.
- Required geospatial satellite data is derived from https://giovanni.gsfc.nasa.gov/giovanni/ and the selection of data and download procedure are provided in the Annexure 1.
Table 2.5 lists parameters considered for computing EPI.
Table 2.5. Environmental, social and economic parameters chosen for EPI assessment
|
Environmental Parameters |
Social Parameters |
Economic Parameters |
|
Temperature |
Population Density (Projected 2022) |
Per Capita Income |
|
Normal Rainfall (2021) |
Sex Ratio |
Number of Factories per sq.km |
|
Forest Cover (2011) |
Literacy Rate (2011) |
Number of employees in Factories per sq.km |
|
Forest Ecosystem Services |
Total Workers Population (2011) |
Number of Small-scale Unit Registered District Industrial Centres per sq.km |
|
Croplands and Horticulture Ecosystem Services |
Number of Hospitals per sq.km |
Number of people working in Small-scale Unit Registered District Industrial Centres per sq.km |
|
Wetland Ecosystem Services |
Number of Medical Shops per sq.km |
Number of Banks per sq.km |
|
Percentage Uncultivable Land (2011) |
Percentage of Irrigated Land (2011) |
Number of Post Offices per sq.km |
|
Stage of Ground Water Extraction |
Pupil-Teacher Ratio (Schools) |
Length of Urban Roads per sq.km |
|
Amount of Carbon dioxide (CO2) in Atmosphere |
Student-Lecturer Ratio (PU Colleges) |
Length of Rural Roads per sq.km |
|
Amount of Carbon monoxide (CO) in Atmosphere |
Number of Professional Degree Colleges per sq.km |
Number of Vehicles per sq.km |
|
Amount of Methane (CH4) in Atmosphere |
Percentage of Households with Electricity |
|
|
Amount of Ozone (O3) in Atmosphere |
Percentage of Households with LPG/PNG connections |
|
|
Amount of Formaldehyde (HCHO) in Atmosphere |
Number of Veterinary Hospitals per sq.km |
|
|
Amount of Nitrogen dioxide (NO2) in Atmosphere |
Number of Internet Connections per sq.km |
|
|
Amount of Sulphur dioxide (SO2) in Atmosphere |
||
|
Amount of Black Carbon (BC) in Atmosphere |
||
|
Amount of PM2.5 in Atmosphere |
Data source
Environmental, social and economic parameters along with datya source are listed in Tables 2.6 to 2.8.
Tabe 2.6. Environmental Parameters
|
Environmental Parameter |
Source |
Environmental Parameter |
Source |
|
Temperature-2-meter Air Temperature |
https://giovanni.gsfc.nasa.gov/giovanni/ MERRA-2 instM_2d_asm_Nx: 2d,Monthly mean,Single-Level,Assimilation,Single-Level Diagnostics V5.12.4 (M2IMNXASM) Global Modeling and Assimilation Office (GMAO) (2015), MERRA-2 tavgM_2d_slv_Nx: 2d,Monthly mean,Time-Averaged,Single-Level,Assimilation,Single-Level Diagnostics V5.12.4, Greenbelt, MD, USA, Goddard Earth Sciences Data and Information Services Center (GES DISC), Accessed: [Data Accessed during-July 2022], 10.5067/AP1B0BA5PD2K |
Amount of Carbon dioxide (CO2) in Atmosphere |
https://giovanni.gsfc.nasa.gov/giovanni/ OCO-2 GEOS Level 3 daily, 0.5x0.625 assimilated CO2 V10r (OCO2_GEOS_L3CO2_DAY) Brad Weir, Lesley Ott and OCO-2 Science Team (2022), OCO-2 GEOS Level 3 daily, 0.5x0.625 assimilated CO2 V10r, Greenbelt, MD, USA, Goddard Earth Sciences Data and Information Services Center (GES DISC), Accessed: [Data Accessed during-July 2022], 10.5067/Y9M4NM9MPCGH |
|
Normal Rainfall (2021) |
Amount of Methane (CH4) in Atmosphere |
https://giovanni.gsfc.nasa.gov/giovanni/ AIRS/Aqua L3 Monthly Standard Physical Retrieval (AIRS-only) 1 degree x 1 degree V006 (AIRS3STM) AIRS Science Team/Joao Teixeira (2013), AIRS/Aqua L3 Monthly Standard Physical Retrieval (AIRS-only) 1 degree x 1 degree V006, Greenbelt, MD, USA, Goddard Earth Sciences Data and Information Services Center (GES DISC), Accessed: [Data Accessed during-July 2022], 10.5067/Aqua/AIRS/DATA321 |
|
|
Forest Cover (2011) |
Amount of Ozone (O3) in Atmosphere |
https://giovanni.gsfc.nasa.gov/giovanni/ OMI/Aura Ozone (O3) DOAS Total Column L3 1 day 0.25 degree x 0.25 degree V3 (OMDOAO3e) Pepijn Veefkind (2012), OMI/Aura Ozone (O3) DOAS Total Column L3 1 day 0.25 degree x 0.25 degree V3, Greenbelt, MD, USA, Goddard Earth Sciences Data and Information Services Center (GES DISC), Accessed: [Data Accessed during-July 2022], 10.5067/Aura/OMI/DATA3005 |
|
|
Forest Ecosystem Services |
Valuation of Ecosystem Services, Karnataka State, India Report of the NCAVES Project [10] (et al. Ramachandra T.V) |
Amount of Formaldehyde (HCHO) in Atmosphere |
https://giovanni.gsfc.nasa.gov/giovanni/ OMI/Aura Formaldehyde (HCHO) Total Column Daily L3 Weighted Mean Global 0.1deg Lat/Lon Grid V003 (OMHCHOd) Kelly Chance (2019), OMI/Aura Formaldehyde (HCHO) Total Column Daily L3 Weighted Mean Global 0.1deg Lat/Lon Grid V003, Greenbelt, MD, USA, Goddard Earth Sciences Data and Information Services Center (GES DISC), Accessed: [Data Accessed during-July 2022], 10.5067/Aura/OMI/DATA3010 |
|
Croplands and Horticulture Ecosystem Services |
Amount of Nitrogen dioxide (NO2) in Atmosphere |
https://giovanni.gsfc.nasa.gov/giovanni/ OMI/Aura NO2 Cloud-Screened Total and Tropospheric Column L3 Global Gridded 0.25 degree x 0.25 degree V3 (OMNO2d) Nickolay A. Krotkov, Lok N. Lamsal, Sergey V. Marchenko, Edward A. Celarier, Eric J.Bucsela, William H. Swartz, Joanna Joiner and the OMI core team (2019), OMI/Aura NO2 Cloud-Screened Total and Tropospheric Column L3 Global Gridded 0.25 degree x 0.25 degree V3, NASA Goddard Space Flight Center, Goddard Earth Sciences Data and Information Services Center (GES DISC), Accessed: [Data Accessed during-July 2022], 10.5067/Aura/OMI/DATA3007 |
|
|
Wetland Ecosystem Services |
Amount of Sulphur dioxide (SO2) in Atmosphere |
https://giovanni.gsfc.nasa.gov/giovanni/ OMI/Aura Sulfur Dioxide (SO2) Total Column L3 1 day Best Pixel in 0.25 degree x 0.25 degree V3 (OMSO2e) Can Li, Nickolay A. Krotkov, and Peter Leonard (2020), OMI/Aura Sulfur Dioxide (SO2) Total Column L3 1 day Best Pixel in 0.25 degree x 0.25 degree V3, Greenbelt, MD, USA, Goddard Earth Sciences Data and Information Services Center (GES DISC), Accessed: [Data Accessed during-July 2022], 10.5067/Aura/OMI/DATA3008 |
|
|
Percentage Uncultivable Land (2011) |
Amount of Black Carbon (BC) in Atmosphere |
https://giovanni.gsfc.nasa.gov/giovanni/ MERRA-2 tavgM_2d_aer_Nx: 2d,Monthly mean,Time-averaged,Single-Level,Assimilation,Aerosol Diagnostics V5.12.4 (M2TMNXAER) Global Modeling and Assimilation Office (GMAO) (2015), MERRA-2 tavgM_2d_aer_Nx: 2d,Monthly mean,Time-averaged,Single-Level,Assimilation,Aerosol Diagnostics V5.12.4, Greenbelt, MD, USA, Goddard Earth Sciences Data and Information Services Center (GES DISC), Accessed: [Data Accessed during-July 2022], 10.5067/FH9A0MLJPC7N |
|
|
Stage of Ground Water Extraction |
Karnataka Groundwater Resource Assessment Report as on March-2020 [11] |
Amount of PM2.5 in Atmosphere |
https://giovanni.gsfc.nasa.gov/giovanni/ MERRA-2 tavgM_2d_aer_Nx: 2d,Monthly mean,Time-averaged,Single-Level,Assimilation,Aerosol Diagnostics V5.12.4 (M2TMNXAER) Global Modeling and Assimilation Office (GMAO) (2015), MERRA-2 tavgM_2d_aer_Nx: 2d,Monthly mean,Time-averaged,Single-Level,Assimilation,Aerosol Diagnostics V5.12.4, Greenbelt, MD, USA, Goddard Earth Sciences Data and Information Services Center (GES DISC), Accessed: [Data Accessed during-July 2022], 10.5067/FH9A0MLJPC7N |
|
Amount of Carbon monoxide (CO) in Atmosphere |
https://giovanni.gsfc.nasa.gov/giovanni/ AIRS/Aqua L3 Monthly Standard Physical Retrieval (AIRS-only) 1 degree x 1 degree V006 (AIRS3STM) AIRS Science Team/Joao Teixeira (2013), AIRS/Aqua L3 Monthly Standard Physical Retrieval (AIRS-only) 1 degree x 1 degree V006, Greenbelt, MD, USA, Goddard Earth Sciences Data and Information Services Center (GES DISC), Accessed: [Data Accessed during-July 2022], 10.5067/Aqua/AIRS/DATA321 |
Table 2.7 Social Parameters
|
Social Parameter |
Source |
Social Parameter |
Source |
||
| 1 |
Population Density (Projected 2022) |
8 |
Pupil-Teacher Ratio (Schools) |
District at a glance (DAG’s) from the individual districts’ websites [12]. |
|
| 2 |
Sex Ratio |
9 |
Student-Lecturer Ratio (PU Colleges) |
||
| 3 |
Literacy Rate (2011) |
10 |
Number of Professional Degree Colleges per sq.km |
||
| 4 |
Total Workers Population (2011) |
District at a glance (DAG’s) from the individual districts’ websites [12]. |
11 |
Percentage of Households with Electricity |
|
| 5 |
Number of Hospitals per sq.km |
12 |
Percentage of Households with LPG/PNG connections |
||
| 6 |
Number of Medical Shops per sq.km |
13 |
Number of Veterinary Hospitals per sq.km |
District at a glance (DAG’s) from the individual districts’ websites [12]. |
|
| 7 |
Percentage of Irrigated Land (2011) |
14 |
Number of Internet Connections per sq.km |
||
Table 2.8 Economic Parameters
|
Economic Parameter |
Source |
|
1. Per Capita Income |
District at a glance (DAG’s) from the individual districts’ websites [12]. |
|
2. Number of Factories per sq.km |
|
|
3. Number of employees in Factories per sq.km |
|
|
4. Number of Small-scale Unit Registered District Industrial Centres per sq.km |
|
|
5. Number of people working in Small-scale Unit Registered District Industrial Centres per sq.km |
|
|
6. Number of Banks per sq.km |
|
|
7. Number of Post Offices per sq.km |
|
|
8.Length of Urban Roads per sq.km |
|
|
9. Length of Rural Roads per sq.km |
|
|
10. Number of Vehicles per sq.km |
2.3 Computation of EPI
Karnataka taluk wise geospatial satellite data of various parameters is obtained as discussed in the Annexure 1.
EPI mapping at disaggregated levels was done by considering the distinct environmental, social and economic which helped to the taluk wise assessment of EPI. The classification of the various attributes with their weights needs a deep understanding of the ecosystem and its negative impact due to the stressed condition of increasing human activity in the name of economy and growth. The weights were assigned based on expert advice and a sound literature review. Aggregated weightages (equation 11) were computed as
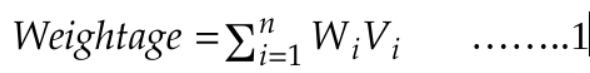
Where n is the number of data sets, Vi is the value associated with criterion i, and Wi is the weight / score associated with that criterion. Each theme is described by a group of factors mapped, which were normalized between 10 to 2.
Taluks were assigned a value of 10 for high priority / threshold, whereas 2 is converse to the above. The values 8, 6, and 4 correspond to high, moderate, and low levels of EPI based on the input factor values (Table 2.5 to 2.8). Weights/scores computed for each variable are aggregated for each taluk. In particular, the weights are based on an individual proxy and depend extensively on GIS techniques, which is the most effective method. Aggregation of environmental, social and economic score were provided a composite score for each taluk. Method adopted for computing EPI at taluk level for Karnataka is given in Figure 2.17.
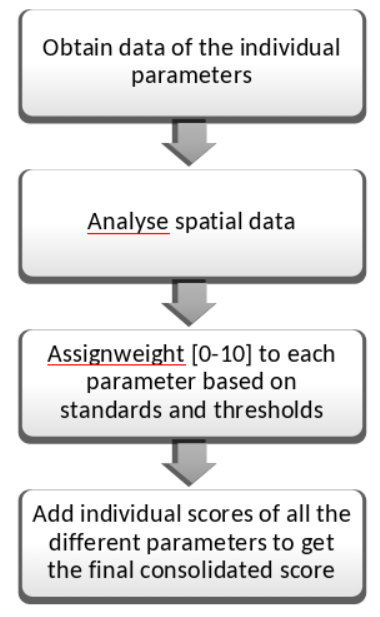
Fig 2.17. Method adopted for computing EPI at taluk level for Karnataka
Results & Discussion
3.1 Environmental parameters
- Temperature: Karnataka generally experiences summer season from
March
to May. April and May are the hottest months in Karnataka. The northeast part of Karnataka
experiences the highest temperature.
2 meter (maximum) temperature: 2 meter (maximum) temperature has been chosen as the temperature indicator. Bidar and Raichur districts experience the highest temperature in the state. Average value of 2m (maximum) temperature in the month of April 2022 has been obtained from GIOVANNI website. Average value of 2m (maximum) temperature in the month of April 2022 in Karnataka was found to be 35.63 ⁰C. Temperature of 34 ⁰C has been set as the threshold.
Average value of 2m (maximum)
temperature in the month of April 2022 in ⁰CScore
<30.25
10
30.25-31.5
8
31.5-32.75
6
32.75-34
4
>34
2
Weights were assigned to each taluk based on the average value of 2 m (maximum) temperature in the month of April 2022. Figure 3.1 depicts the temperature variability in Karnataka
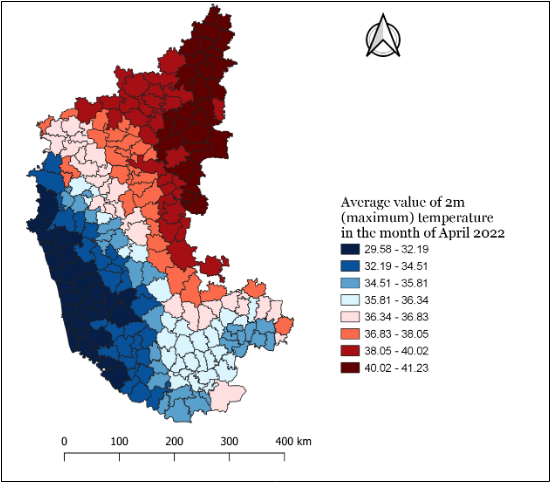
Figure 3.1. Maximum temperature variability during April 2022
- Normal Rainfall
Normal Rainfall is the average of the annual precipitation values over a 30-year period of a given specific area. The threshold has been set as 1200mm as Karnataka States’ normal rainfall (in 2021) was 1248mm (close to 1200mm).
Normal Rainfall (2021) in mm
Score
<1200
2
1200-2000
4
2000-3000
6
3000-4000
8
>4000
10
Normal rainfall (in 2021) versus weights are as follows:
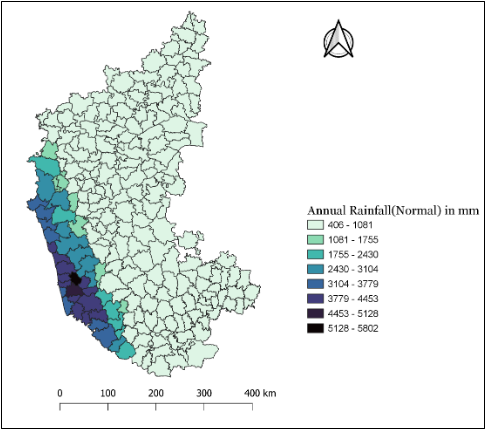
Figure 3.2. Annual rainfall variability across Karnataka
-
Forest Cover
Forest Cover is represented per taluk as the percentage of land covered by forests (forest area) to the total geographic land area. Weights were assigned based on the threshold as given in the following table. Even though the forest cover of State of Karnataka is 20.11% (Ramachandra et al., 2021a, 2021b), the threshold of 33%, is considered as per the norm and the goal set by Government of India set to achieve by 2030.
Forest Cover (%)
Score
<33
2
33-40
4
40-45
6
45-50
8
>50
10
Forest Cover (2011) versus score assigned is as follows:
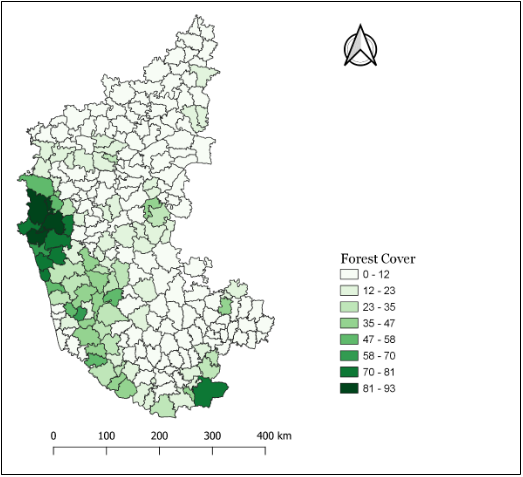
Figure 3.3. Forest cover (%) across Karnataka
-
Forest Ecosystem Services
Value of forest ecosystem services (district wise for the State of Karnataka) for the year 2019 is compiled from NCAVES report (Ramachandra et al., 2022c). Total Ecosystem Supply Value (TESV) is computed by aggregating provisional services, regulating services and cultural services.
TESV of forest ecosystem was 2841 billion INR in 2005;, which declined to 1835 billion INR by 2019 (35% decline). The degradation of the ecosystem is the main cause of the decline (Ramachandra et al., 2021a, 2021b). In Karnataka, average value of TESV of forest ecosystem in 2019 was 7.89 billion rupees per year. The threshold has been set at 7.89 billion rupees.
TESV of forest ecosystem in billion rupees
Score
<7.89
2
7.89-16
4
16-24
6
24-32
8
>32
10
TESV of forest ecosystem in billion rupees versus score assigned is as follows:
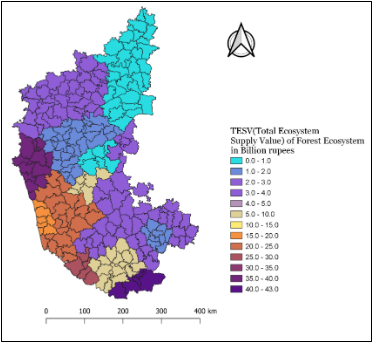
Figure 3.4. Total ecosystem services per year – tulukwise for Karnataka
- Agriculture (Croplands and Horticulture) Ecosystem Services
Data pertaining to agriculture (croplands and horticulture ecosystem services) has been obtained district wise as per NCAVES report (Ramachandra et al., 2022c; 2022d). Total Ecosystem Supply Value (TESV) is computed by aggregating provisional services, regulating services and cultural services. In Karnataka, average value of TESV of croplands and horticulture ecosystem was 1144 million rupees per taluk. The threshold has been set as 1150 million rupees.
TESV of croplands and horticulture ecosystem in million rupees
Score
<1150
2
1150-1450
4
1450-1750
6
170-2050
8
>2050
10
TESV of croplands and horticulture ecosystem in million rupees versus score assigned is as follows:
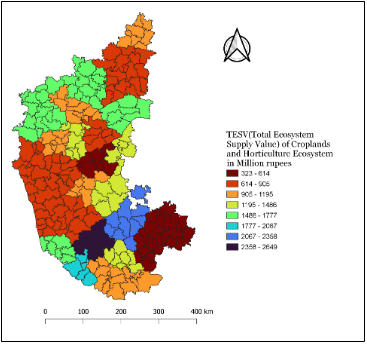
Figure 3.5: TESV of agriculture ecosystem
- Wetland Ecosystem Services
TESV of wetland ecosystem was 284.52 billion INR in 2019. Cultural, Regulating and Provisioning services contribute 13%, 69% and 18% to the TESV (Ramachandra et al., 2022e). In Karnataka, average value of TESV of wetland ecosystem in 2019 was 1.11 billion rupees per year per taluk. The threshold has been set as 1.11 billion rupees.
TESV of wetland ecosystem in billion rupees
Score
<1.11
2
1.11-2
4
2-3
6
3-4
8
>4
10
TESV of wetland ecosystem in billion rupees versus score assigned is as follows:
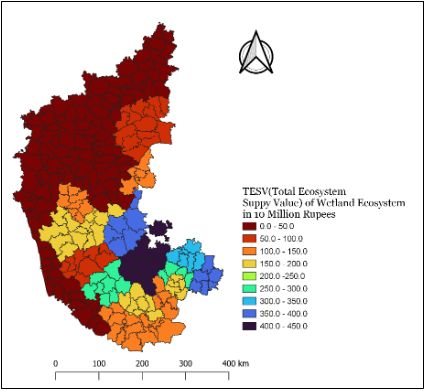
Figure 3.6. TESV of wetland ecosystem
-
Uncultivable Land
Barren land and other uncultivable land constitute the land not available for cultivation. Percentage of land not available for cultivation to the total geographic land has been evaluated for each taluk (Ramachandra et al., 2021a,b). The threshold has been set as 6% as about 6% of total land area of India comes under this category.
The percentage of uncultivable land
Score
<3
10
3-4
8
4-5
6
5-6
4
>6
2
Percentage of uncultivable (2011) land versus score assigned is as follows:
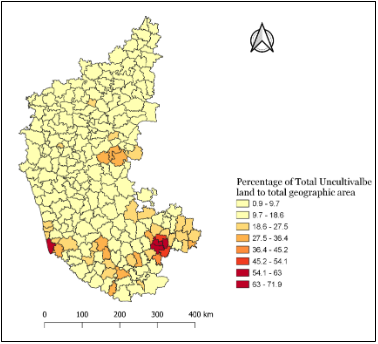
Figure 3.7 percentage of uncultivable land
-
Stage of Ground Water extraction
As per the Central Ground Water Board (CGWB), under Ministry of Jal Shakti, Department of Water Resources, River Development and Ganga Rejuvenation, Government of India (http://cgwb.gov.in/): ‘The significant rate of (ground) water level decline are taken between 10 to 20 cm per year depending upon the local hydrogeological conditions. There are four categories, namely - 'Safe’ (<=70%) areas which have ground water potential for development; 'Semi-critical’ (70%-90%) areas where cautious groundwater development is recommended; 'Critical’ (90%-100%) areas; and 'Over-exploited’ (>=100%) areas, where there should be intensive monitoring and evaluation and future ground development be linked with water conservation measures.’.
Stage of Ground Water extraction (%)
Score
0-40
10
40-70
8
70-80
6
80-90
4
>90
2
In this work. stage of Ground Water extraction (2011) versus score/weight assigned is as follows:
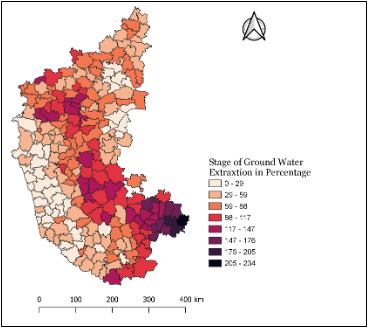
Figure 3,8. Status of groundwater extraction
-
Amount of Carbon dioxide (CO2) in Atmosphere
Unit: Column averaged dry mole fraction of CO2 in atmosphere
Concentration of carbon dioxide is higher in the winter season as there is reduced photosynthesis activity of plants due to shedding of their leaves. In Karnataka, concentration of CO2 was found to be highest in January 2022.
In Karnataka, average concentration of CO2 in January 2022 was 414 ppm (parts per million). Threshold of 413 ppm has been set for assigning weights.
Concentration of CO2 in ppm (01-2022)
Score
<410
10
410-411
8
411-412
6
412-413
4
>413
2
Concentration of CO2 in ppm vs score assigned is as follows:
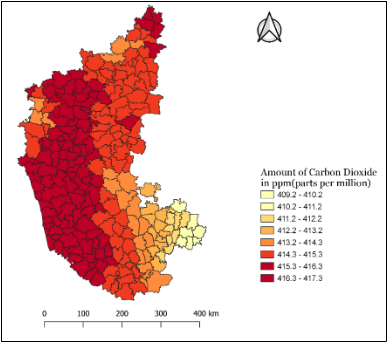
Figure 3.9. Carbon concentration
-
Amount of Carbon monoxide (CO) in Atmosphere
Unit: Carbon Monoxide mole fraction in air
Concentration of carbon monoxide is generally higher in the winter season as people are more likely to opt for space heating. In Karnataka, concentration of CO was found to be highest in March. In Karnataka, average concentration of CO in March 2022 was 146.7 ppbv (parts per billion by volume). Threshold of 144 ppbv has been considered for assigning weights.
Concentration of COin ppbv(03-2022)
Score
<135
10
135-138
8
138-141
6
141-144
4
>144
2
Concentration of CO in ppbv vs score assigned is as follows:
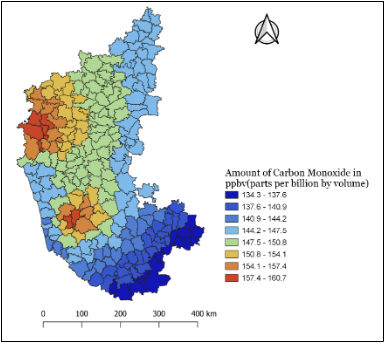
Figure 3.10. CO concentration in Karnataka (taluk wise)
-
Amount of Methane (CH4) in Atmosphere
Unit: Methane mole fraction in air
Concentration of methane is generally higher in the winter season. In Karnataka, concentration of CH4 was found to be highest in February month in 2022 and average concentration of CH4 in February 2022 was 1859.9 ppbv (parts per billion by volume). 1860 ppbv has been set as the threshold.
Concentration of CH4 in ppbv (02-2022)
Score
<1836
10
1836-1848
8
1848-1854
6
1854-1860
4
>1860
2
Concentration of CH4 in ppbv vs score assigned is as follows:
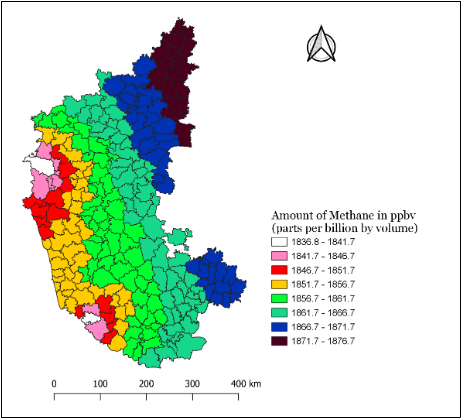
Figure 3.11. methane concentration in Karnataka
-
Amount of Ozone (O3) in
Atmosphere
Unit: Total column of ozone in the atmosphere
The concentration of ozone is higher in the summer season. It is due to the fact that the reactions that create ozone are catalyzed by heat and sunlight and there is more heat and sunlight in summer. In Karnataka, concentration of O3 was found to be highest in May month in 2022. In Karnataka, average concentration of O3 in May 2022 was 279.93 DU (Dobson units), which is considered as threshold for assigning weights.
Concentration of O3 in DU (05-2022)
Score
<275.5
10
275.5-277
8
277-278.5
6
278.5-280
4
>280
2
Concentration of O3 in DU vs score assigned is as follows:
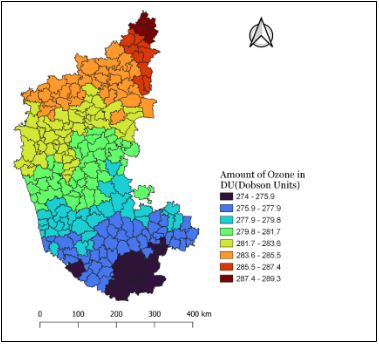
Figure 3.12. Ozone concentration in Karnataka
-
Amount of Formaldehyde (HCHO) in Atmosphere
Unit: Column averaged concentration of formaldehyde in the atmosphere
The concentration of HCHO is higher in the winter season. In Karnataka, concentration of HCHO was found to be highest in February month in 2022. In Karnataka, average concentration of HCHO in February 2022 was 7.26E+15 molecules per sq.cm, which was considered as threshold for assigning weights.
Number of molecules per sq.cm (02-2022)
Score
<5.16E+15
10
5.16E+15-5.86E+15
8
5.86E+15-6.56E+15
6
6.56E+15-7.26E+15
4
>7.26E+15
2
Concentration of HCHO in (number of) molecules per sq.cm vs score assigned is as follows:
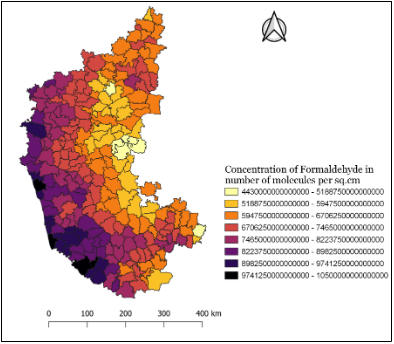
Figure 3.13. Amount of formaldehyde during February in Karnataka
-
Amount of Nitrogen dioxide (NO2) in Atmosphere
Unit: Total column of nitrogen dioxide in the atmosphere
Concentration of nitrogen dioxide is generally higher during the winter season. It is due to heavier use of combustion power plants for wintertime home heating, as well as the fact that NO2 stays longer in the air during winter. In Karnataka, concentration of NO2 was found to be highest in the month of March in 2022. In Karnataka, average concentration of NO2 in March 2022 was 3.79E+15 molecules per sq.cm, which was considered as the threshold.
Concentration of NO2 in (number of) molecules per sq.cm (03-2022)
Score
<3.2E+15
10
3.2E+15-3.4E+15
8
3.4E+15-3.6E+15
6
3.6E+15-3.8E+15
4
>3.8E+15
2
Concentration of NO2 in (number of) molecules per sq.cm vs score assigned is as follows:
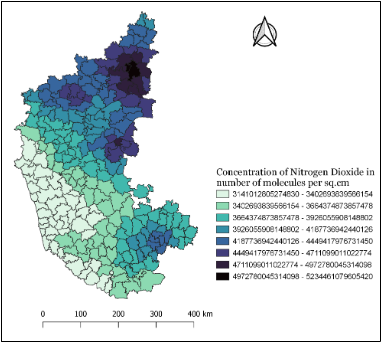
Figure 3.14. NO2 concentration in atmosphere
-
Amount of Sulphur dioxide (SO2) in Atmosphere
Unit: Total column of Sulphur dioxide in the atmosphere
Concentration of Sulphur dioxide is generally higher in the winter season due to low temperature and low wind speeds. In Karnataka, concentration of SO2 was found to be highest in January month in 2022. In Karnataka, average concentration of SO2 in January 2022 was 0.113 DU (Dobson units) and 0.12 DU is considered as the threshold.
Concentration of SO2 in DU (01-2022)
Score
<0.06
10
0.06-0.08
8
0.08-0.1
6
0.1-0.12
4
>0.12
2
Concentration of SO2 in DU vs score assigned is as follows:
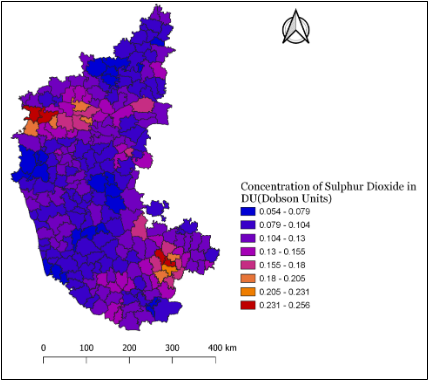
Figure 3.15. Concentration of SO2 in Karnataka
-
Amount of Black Carbon (BC) in Atmosphere
Unit: Surface mass concentration of black carbon
Concentration of black carbon is generally higher during the pre-monsoon season (February, March and April). In Karnataka, concentration of BC was found to be highest in February month in 2022. In Karnataka, average concentration of BC in February 2022 was 1.69E-09 kg per cubic meter. 1.7E-09 kg per cubic meter has been set as the threshold.
Concentration of BC in kg per cubic meter (02-2022)
Score
<1.52E-09
10
1.52E-09-1.58E-09
8
1.58E-09-1.64E-09
6
1.64E-09-1.7E-09
4
>1.7E-09
2
Concentration of BC in kg per cubic meter vs score assigned is as follows:
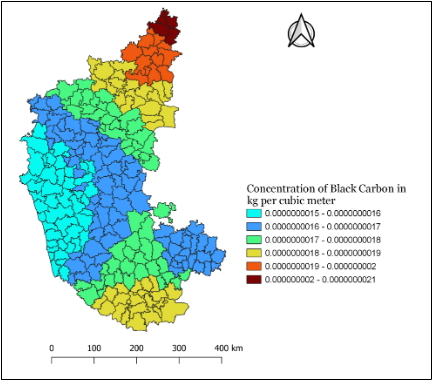
Figure 3.16 Concentration of Black carbon in Karnataka
-
Amount of Particulate Matter-2.5 (PM2.5)
in Atmosphere
Unit: Surface mass concentration of PM2.5
Concentration of PM2.5 is generally high in the winter season. It is due to photooxidation, high concentration of nitric oxide and higher hydrocarbon emissions to the atmosphere due to cold temperature. In Karnataka, concentration of PM2.5 was found to be highest in December month in 2021. In Karnataka, average concentration of PM2.5 in December 2021 was 2.84E-08 kg per cubic meter. PM2.5 of 2.84E-08 kg per cubic meter is considered as the threshold.
Concentration of PM2.5 in kg per cubic meter (12-2021)
Score
<2.24E-08
10
2.24E-08-2.44E-08
8
2.44E-08-2.64E-08
6
2.64E-08-2.84E-08
4
>2.84E-08
2
Concentration of PM2.5 in kg per cubic meter vs score assigned is as follows:
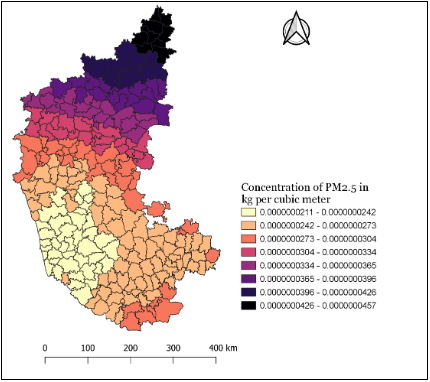
Figure 3.17. Concentration of PM2.5
3.1.1 Total Environmental Score (TEnS)
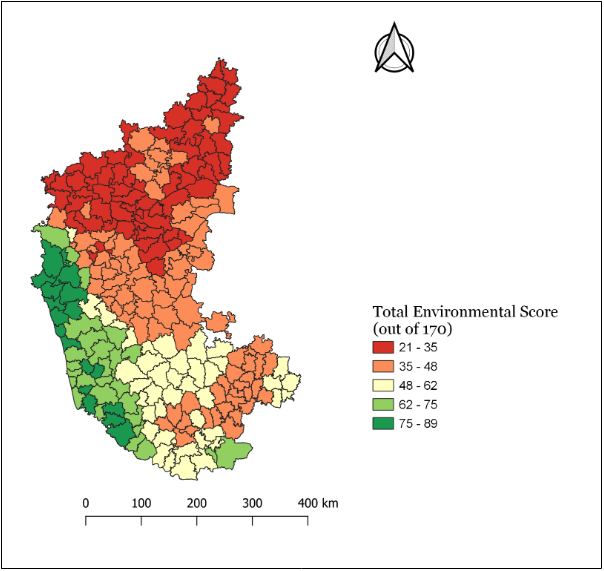
Figure 3.18. Total environment score -taluk wise for Karnataka
Aggregation of 17 environmental (Eni) parameters was done (equation 2) to compute TEnS, total environmental score (equation 2). Figure 3.18 gives the aggregate environment score and Table 3.1.1 lists taluk wise composite environment score.
Table 3.1.1 Composite environment score (taluk wise) for Karnataka
3.2 Social Parameters
-
Population Density
Population density is the concentration of individuals in a specific geographic locale. Numerically it is the ratio of number of individuals to the geographic area. The threshold has been set as 400 considering mean population density of Karnataka is 382.
Population density per sq.km
Score
0-100
10
100-200
8
200-300
6
300-400
4
>400
2
Population density (2022) versus score assigned is as follows:
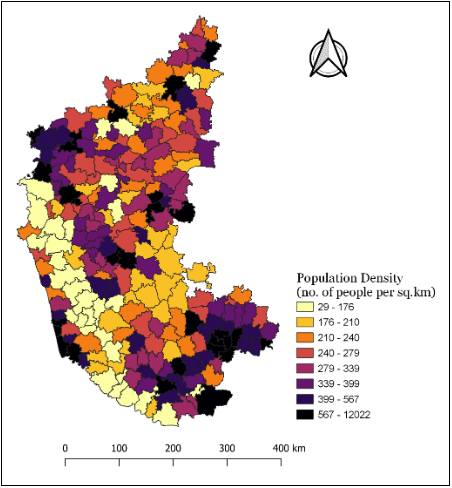
Figure 3.19. Population density across taluks, Karnataka
-
Sex Ratio
Sex ratio is the ratio of number of females to males in a population. The threshold has been set as 0.950.
Sex Ratio
Score
<0.950
2
0.950-0.9625
4
0.9625-0.975
6
0.975-0.9875
8
>0.9875
10
Sex ratio (2022) versus score assigned is as follows:
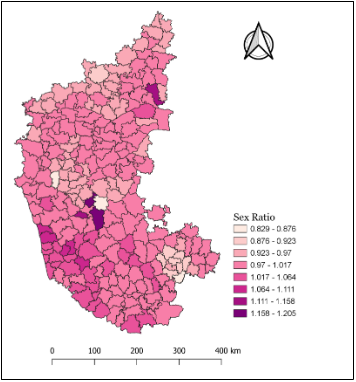
Figure 3.20. Taluk wise sex ratio in Karnataka
-
Literacy Rate
Literacy rate is defined as the percentage of population aged 15 and over that can read and write. The threshold has been set as 75% considering average literacy rate of 75.36% in Karnataka State.
Literacy Rate
Score
<75
2
75-81.25
4
81.25-87.5
6
87.5-93.75
8
93.75-100
10
Literacy rate (2011) versus score assigned is as follows:
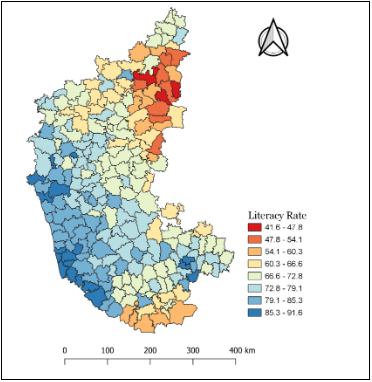
Figure 3.21. Literacy rate in Karnataka
-
Total Workers Percentage
Percentage of total (main workers+marginal workers) workers to the total population is evaluated. The average is 46.83% and threshold has been set as 50%.
Total Workers Percentage
Score
<50
2
50-60
4
60-70
6
70-80
8
80-100
10
Total workers percentage (2011) versus score assigned is as follows:
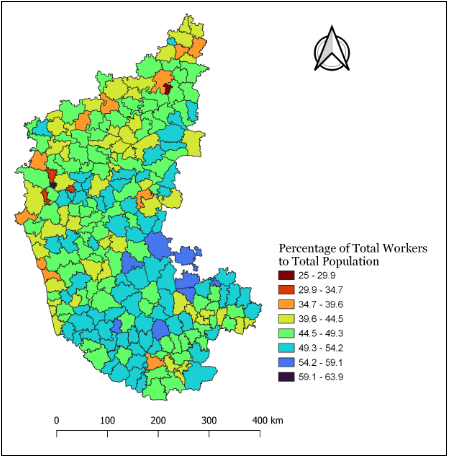
Figure 3.22 workers (%) in Karnataka
-
Total Workers Percentage
Percentage of total (main workers+marginal workers) workers to the total population is evaluated. The average is 46.83% and threshold has been set as 50%.
Total Workers Percentage
Score
<50
2
50-60
4
60-70
6
70-80
8
80-100
10
Total workers percentage (2011) versus score assigned is as follows:
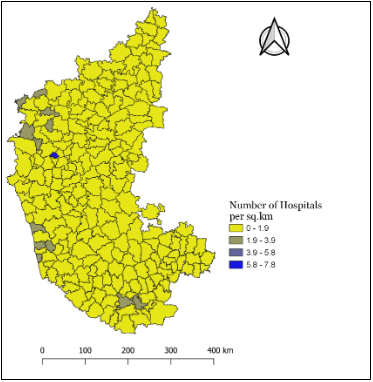
Figure 3.23 number of hospitals per sq.km in Karnataka
-
Number of Medical Shops per sq.km
Total number of medical shops/stores per sq.km of the total geographic area of each taluk has been calculated. Number of medical shops per sq.km in Karnataka is about 0.21, and the threshold considered is 0.2.
Number of medical shops per sq.km
Score
<0.2
2
0.2-0.6
4
0.6-1
6
1-2
8
>2
10
Number of medical shops per sq.km versus score assigned is as follows:
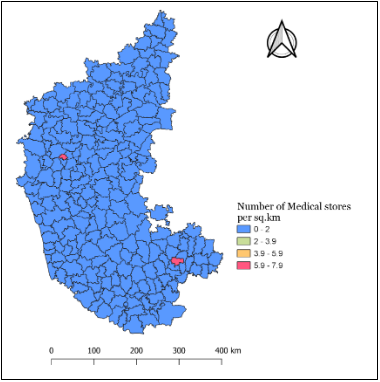
Figure 3.24 Number of medical shops per sq.km in Karnataka, taluk wise
-
Percentage of Irrigated Land (2011)
Irrigated Lands refer to the agricultural lands that are provided with supplemental water from various sources like canals, tube wells, bore wells etc. in order to optimize and enhance crop production and yield. Percentage of irrigated land (2011) to the total net sown area has been evaluated for each taluk. The average percentage of irrigated land to the total net sown area is about 26.5%, and the threshold considered is 26.5%.
Percentage of Irrigated land(2011)
Score
<26.5
2
26.5-40
4
40-60
6
60-80
8
80-100
10
Percentage of irrigated land versus score assigned is as follows:
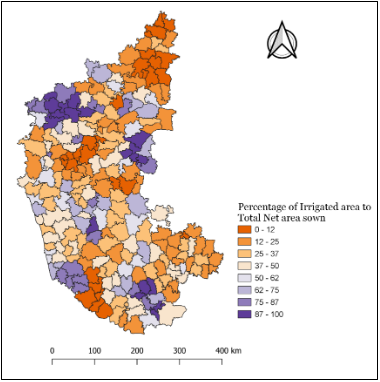
Figure 3.25 percentage of irrigated lands in Karnataka
-
Pupil-Teacher Ratio (Schools)
Pupil-Teacher ratio (primary & high school) is the ratio of total number of students to the total number of teachers. Ideal Pupil-Teacher ratio is 30. Pupil-Teacher ratio in Karnataka is about 25.5 and the threshold considered is 25.
Pupil-Teacher ratio
Score
<17.5
10
17.5-20
8
20-22.5
6
22.5-25
4
>25
2
Pupil-Teacher ratio versus score assigned is as follows:
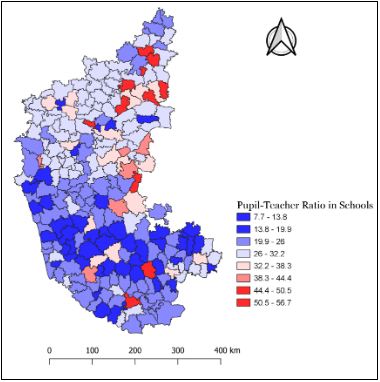
Figure 3.26 Pupil to teacher ratio in Karnataka
-
Student-Lecturer Ratio (PU Colleges)
Student-Lecturer Ratio is the ratio of total number of students to the total number of lecturers in PU colleges. Student-Lecturer Ratio in Karnataka is about 27 and the threshold of 22.5 is considered in the current analyses.
Student-Lecturer Ratio
Score
<15
10
15-17.5
8
17.5-20
6
20-22.5
4
>22.5
2
Student-Lecturer ratio versus score assigned is as follows:
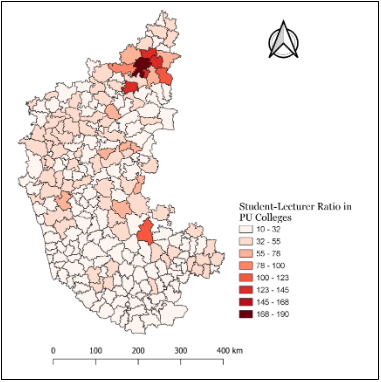
Figure 3.27 student to lecturer ratio in Karnataka
-
Number of Professional Degree Colleges per sq.km
Total number of professional degree colleges (including polytechnic colleges) per sq.km of the total geographic area of each taluk has been calculated. These include General Degree Colleges, Medical Colleges, Dental Colleges, Engineering Colleges and Polytechnic Colleges. These consist of both government and private colleges. Number of professional degree colleges per sq.km in Karnataka is about 0.0116, and the threshold considered is 0.012.
Number of Professional Degree Colleges per sq.km
Score
<0.012
2
0.012-0.03
4
0.03-0.05
6
0.05-0.07
8
>0.07
10
Number of professional degree colleges per sq.km versus score assigned is as follows:
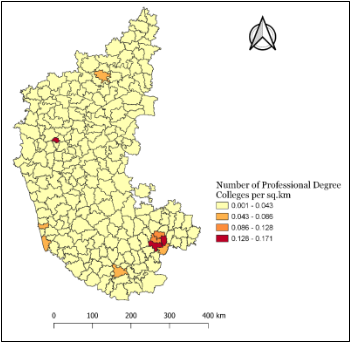
Figure 3. 28 number of professional degree colleges in Karnatka
-
Percentage of Households with Electricity
Percentage of households with electricity (in 2011) has been obtained for each
taluk. Percentage of households with electricity in Karnataka is 88.52 and a threshold of 90% is considered for assigning weights.
Percentage of households with electricity
Score
<90
2
90-93
4
93-96
6
96-99
8
<99
10
Percentage of households with electricity vs score assigned is as follows:
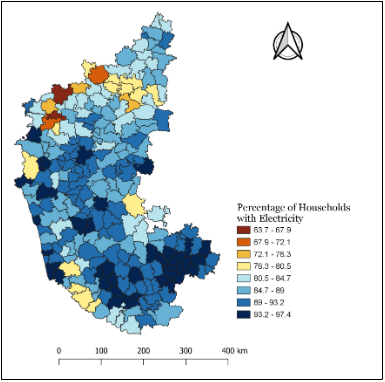
Figure 3.29 percentage of households with electricity in Karnataka
-
Percentage of Households with LPG/PNG connections
Percentage of households with LPG/PNG connections (in 2011) has been obtained for each taluk. Percentage of households with LPG/PNG connections in Karnataka is 19.83 and a threshold of 20% is considered for assigning weights.
Percentage of households with LPG/PNG connections
Score
<20
2
20-40
4
40-60
6
60-80
8
>80
10
Percentage of households with LPG/PNG connections vs score assigned is as follows:
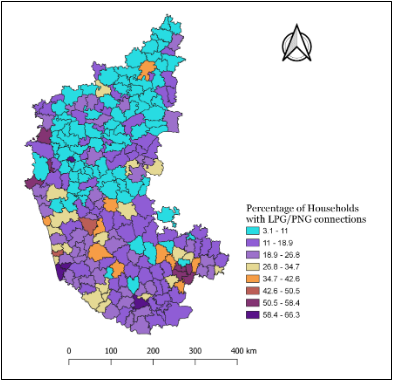
Figure 3.30 Percentage of households with LPG/PNG connections
-
Number of Veterinary Hospitals per sq.km
Number of veterinary hospitals per 100 sq.kms of the total geographic area of each taluk has been calculated. Number of veterinary hospitals per 100sq.kms in Karnataka is about 2.85, and the threshold of 3 was considered for assigning weights.
Number of veterinary hospitals per 100 sq.km
Score
<3
2
3-5
4
5-7
6
7-9
8
>9
10
Number of veterinary hospitals per 100 sq.km versus score assigned is as follows:
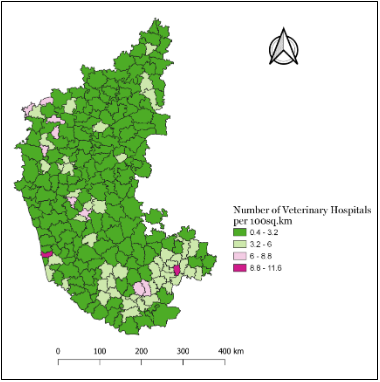
Figure 3.31 Number of veterinary hospitals per sq.km. in Karnataka
-
Number of Internet Connections per sq.km
Number of internet connections per sq.km of the total geographic area of each taluk has been obtained. The average number of internet connections per sq.km in Karnataka is about 3.65, and the threshold of 3.65 is considered for assigning weights.
Number of internet connections per sq.km
Score
<3.65
2
3.65-10
4
10-50
6
50-100
8
>100
10
Number of internet connections per sq.km versus score assigned is as follows:
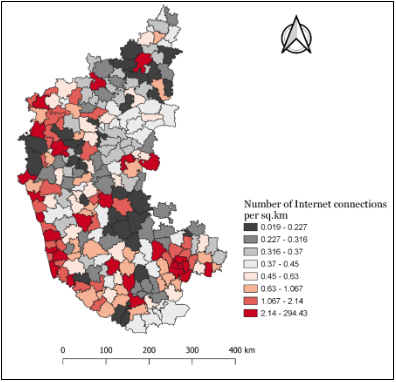
Figure 3.32 Number of internet connections per sq.km in Karnataka
3.2.1 Total Social Score (TSS)
Aggregation (as per equation 3) of social variables (Si) for each taluk provided total social score (TSS). Figure 3.33 depicts the aggregated social score taukwise for Karnataka. Table 3.2.1 lists aggregated social score taluk-wise for Karnataka.
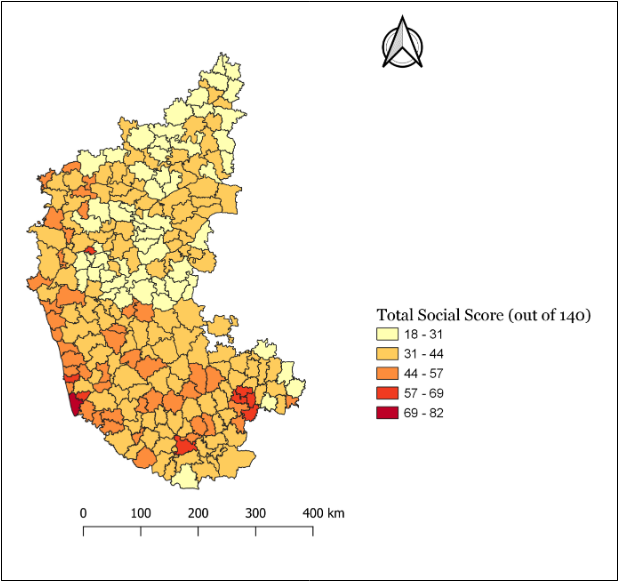
Figure 3.33 The aggregated social score taukwise for Karnataka
Table 3.2.1 Aggregate social score - taluk wise for Karnataka
3.3 Economic Parameters
-
Per Capita Income
Per capita income is the average income earned per person in a given specific area in a specific annual year. Numerically per capita income is the total income of the region divided by total population of the region. The per capita income at constant prices (in the fiscal year 2018-19) was 1.67 lakhs (nearer to 1.5lakhs) in Karnataka and the threshold of 1.5 lakh rupees is considered for assigning weights.
Per Capita Income(at constant prices)(2018-19) in lakh rupees
Score
<1.5
2
1.5-2.5
4
2.5-3.5
6
3.5-4.5
8
>4.5
10
Per capita income (at constant prices) (2018-19) versus score assigned is as follows:
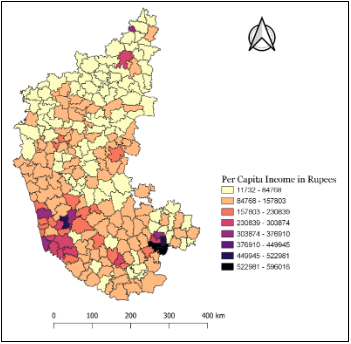
Figure 3.34 Taluk wise per capita income in Karnataka
-
Number of Factories per sq.km
Number of factories per sq.km of the total geographic area of each taluk has been calculated. Number of factories per sq.km in Karnataka is 0.265, and the threshold of 0.25 is considered for assigning weights.
Number of Factories per sq.km
Score
<0.25
2
0.25-1.5
4
1.5-2.75
6
2.75-4
8
>4
10
Number of factories per sq.km versus score assigned is as follows:
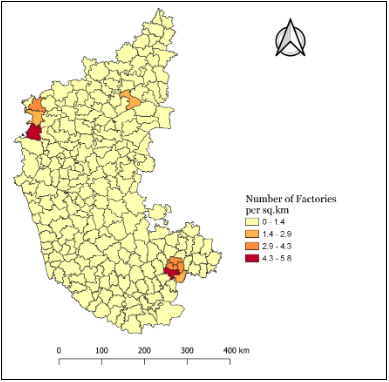
Figure 3.35 Number of factories per sq.km in Karnataka
-
Number of employees in Factories per sq.km
Number of people working in factories per sq.km of the total geographic area of each taluk has been calculated. Number of employees in factories per sq.km in Karnataka is about 16.8, and the threshold of 17 is considered for assigning weights.
Number of employees in Factories per sq.km
Score
<17
2
17-50
4
50-100
6
100-200
8
>200
10
Number of people working in factories per sq.km versus score assigned is as follows:
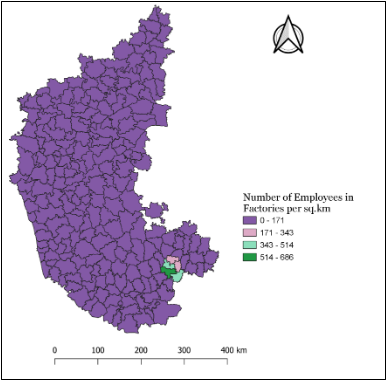
Figure 3.36 Number of employees in factories per sq.km in Karnataka
-
Number of Small-scale Unit Registered at District Industrial Centres per sq.km
Number of small-scale unit registered DICs per sq.km of the total geographic area of each taluk has been calculated. Number of small-scale unit registered DICs per sq.km in Karnataka is 4.65, and the threshold of 4 was considered for assigning weights.
Number of small scale unit registered DICs per sq.km
Score
<4
2
4-10
4
10-15
6
15-20
8
>20
10
Number of small-scale unit registered DICs per sq.km versus score assigned is as follows:
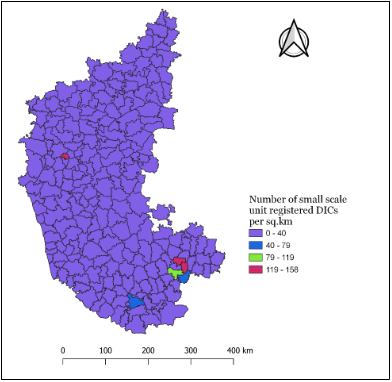
Figure 3.37 Number of Small-scale Unit Registered at District Industrial Centres per sq.km in Karnataka
-
Number of people working in Small-scale Unit Registered at District Industrial Centres per
sq.km
Number of people working in small scale unit registered at DICs per sq.km of the total geographic area of each taluk has been calculated. Number of people working in small scale unit registered DICs per sq.km in Karnataka is about 31.69, and the threshold of 30 is considered
Number people working in DICs per sq.km
Score
<30
2
30-100
4
100-250
6
250-500
8
>500
10
Number of people working in small scale unit registered DICs per sq.km versus score assigned is as follows:
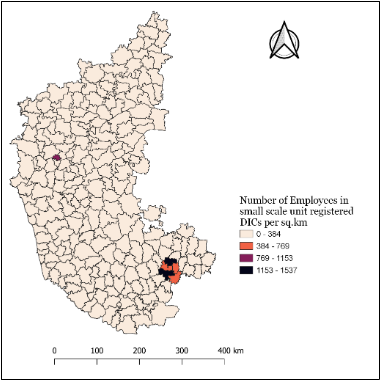
Figure 3.38 Number of people working in Small-scale Unit Registered at District Industrial Centres per sq.km in Karnataka
-
Number of Banks per sq.km
Total number of banks/bank branches per sq.km of the total geographic area of each taluk has been calculated. These include all the commercial banks i.e., Public, Private, District and Foreign banks. Number of banks per sq.km in Karnataka is about 0.061, and the threshold of 0.06 is considered.
Number people working in DICs per sq.km
Score
<30
2
30-100
4
100-250
6
250-500
8
>500
10
Number of banks per sq.km versus score assigned is as follows:
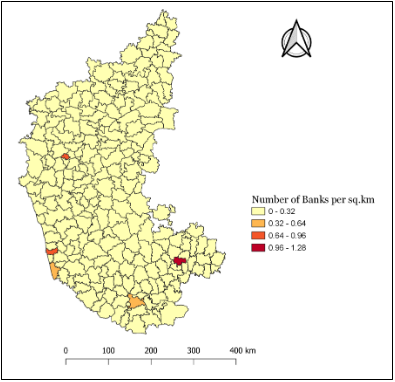
Figure 3.39 Number of Banks per sq.km in Karnataka (taluk wise)
-
Number of Post Offices per sq.km
Total number of post offices per sq.km of the total geographic area of each taluk has been calculated. Number of post offices per sq.km in Karnataka is about 0.06, and the threshold of 0.06 so the threshold has been set as 0.06.
Number of post offices per sq.km
Score
<0.06
2
0.06-0.1
4
0.1-0.15
6
0.15-0.2
8
>0.2
10
Number of post offices per sq.km versus score assigned is as follows:
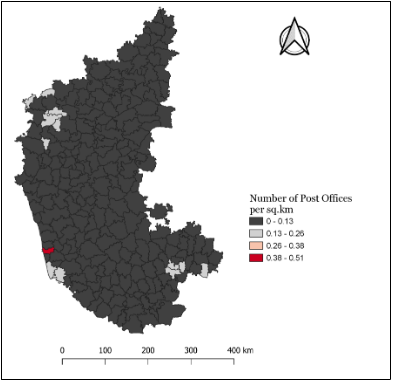
Figure 3.40 Number of Banks per sq.km in Karnataka
-
Length of Urban Roads per sq.km
Total length of Urban roads (in km) per sq.km of the total geographic area of each taluk has been calculated. Urban roads include National Highways, State Highways and Major District Roads. Length of urban roads per sq.km in Karnataka is 0.484, and the threshold of 0.48 is considered for assigning weights.
Length of urban roads per sq.km
Score
<0.48
2
0.48-0.75
4
0.75-1
6
1-1.25
8
>1.25
10
Length of urban roads per sq.km versus score assigned is as follows:
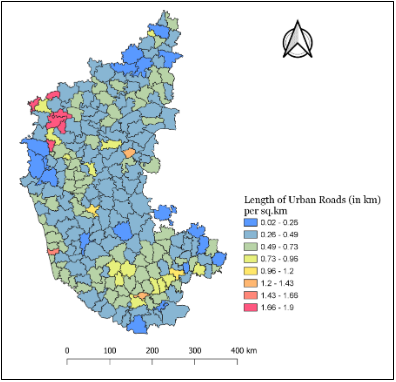
Figure 3.41 Length of Urban Roads per sq.km in Karnataka
-
Length of Rural Roads per sq.km
Total length of Rural roads (in km) per sq.km of the total geographic area of each taluk has been calculated. Length of rural roads per sq.km in Karnataka is 1.116, and the threshold of 1.12 is considered for assigning weights.
Length of rural roads per sq.km
Score
<1.12
2
1.12-2.4
4
2.4-3.6
6
3.6-4.8
8
>4.8
10
Length of rural roads per sq.km versus score assigned is as follows:
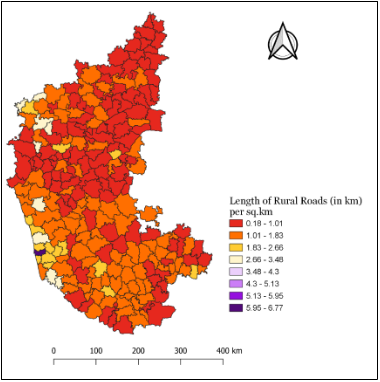
Figure 3.42 Length of Rural Roads per sq.km in Karnataka
-
Number of Vehicles per sq.km
Total number of vehicles per sq.km of the total geographic area of each taluk has been calculated. Mean number of vehicles per sq.km in Karnataka is about 214.65, and the threshold of 215 is considered for assigning weights.
Number of vehicles per sq.km
Score
<215
2
215-500
4
500-750
6
750-1000
8
>1000
10
Number of vehicles per sq.km versus score assigned is as follows:
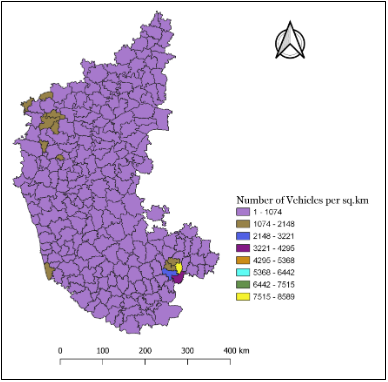
Figure 3.43 Number of Vehicles per sq.km in Karnataka
3.3.1 Total Economic Score (TEcS)
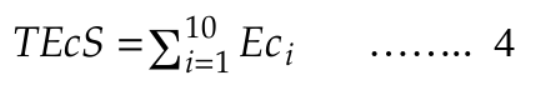
Total economic score (TEcS) is computed taluk wise for Karnataka by aggregating weights 10 economic (Eci) variables (equation 4) which are depicted in Figure 3.44 and Table 3.4.1 lists total economic score for taluks in Karnataka.
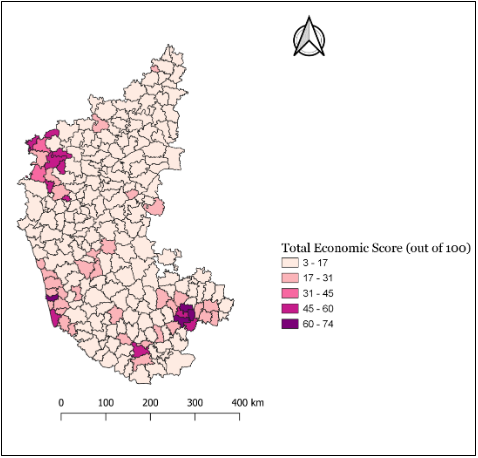
Figure 3.44 Total economic score - taukwise for Karnataka
Table 3.3.1 Taluk wise, total economic score
3.4 Environmental Performance Indices
EPI is computed for each taluk as per equation 5,
EPI = TEnS+TSS+TEcS ….5
EPI computed taluk-wise is depicted in Figure 3.45 and listed taluk wise in Table 3.4.1
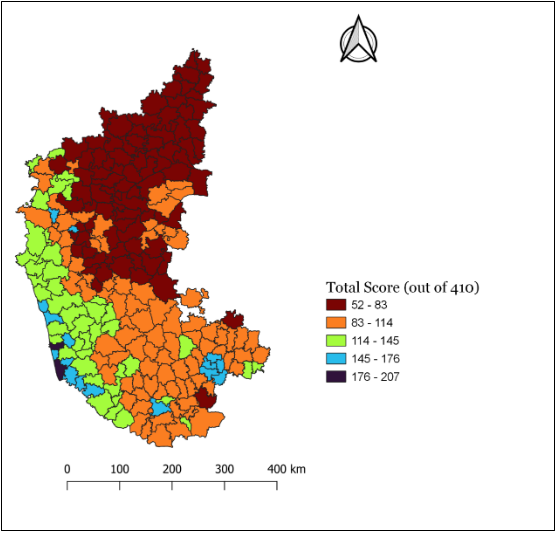
Figure 3.45 Talukwise EPI for Karnataka
Table 3.4.1 EPI (taluk wise for Karnataka)
EPI computed considering environmental (17 variables, Eni), Social (14 variables, Si) and economic (Eci) show wide variability indicating skewed developmental and environmental conservation path being practiced in Karnataka. Highest EPI being 207 (Mangalore), Udupi (199), Moodbidri (169), while lowest are Gurumithakala (51.6) and Afzalpur (53).
Taluks in the Western Ghats region have better environmental score (Bhatkal, 88.8; Sulya 88.5; Ankola, 85.1; Hebri, 82.3; Kumta, 81.8; Siddapur, 81.6; Sringeri 81.1, siris, 81, Yellapur, 81, Madikeri 79.3) compared to taluks in the northern Karnataka (mudhol 21.3; Chadchana 21.7; Bagalkote 22.3; Chittapur 22.5; Dadami 23.8; Athani 24.7; Sedam 25.3; Bhalki 25.5).
Considering Social parameters, Mangalore (82.3), Udupi (67.9), Huballi nagara (67.1), Bangalore east (64.4), Mysore (63.6), Mudbidri (60.9) are relatively better compared to northern Karnataka taluks (Gurumithakala 18.2; Afzalpur 19.3; Aland 19.8; Basavakalyan 204; Kundgol 22.1; Shiggaon 22.4; Aurad 22.4, etc.
Taluks such as Bangalore-South (74), Yelahanka (67.8), Bangalore-East (65.1), Udupi (61.5), Anekal (57.4), Bangalore (North) 57.3, Gokak (51.8) are economically vibrant taluks, while Hosadurga (5.8), Saraguru (5.6), Bhalki (5.3), Kushtagi (5.3), Aland (5.2), Chincholi (4.8), Kollegala (4.7), Afzalpur (4.6), Joida (2.6), etc. in Northern Karnataka are economically very backward taluks
Conclusions
EPI computed considering environmental (17 variables, Eni), Social (14 variables, Si) and economic (Eci) show wide variability indicating skewed developmental and environmental conservation path being practiced in Karnataka. Highest EPI being 207 (Mangalore), Udupi (199), Moodbidri (169), while lowest are Gurumithakala (51.6) and Afzalpur (53).
Taluks in the Western Ghats region have better environmental score (Bhatkal, 88.8; Sulya 88.5; Ankola, 85.1; Hebri, 82.3; Kumta, 81.8; Siddapur, 81.6; Sringeri 81.1, siris, 81, Yellapur, 81, Madikeri 79.3) compared to taluks in the northern Karnataka (mudhol 21.3; Chadchana 21.7; Bagalkote 22.3; Chittapur 22.5; Dadami 23.8; Athani 24.7; Sedam 25.3; Bhalki 25.5).
Considering Social parameters, Mangalore (82.3), Udupi (67.9), Huballi nagara (67.1), Bangalore east (64.4), Mysore (63.6), Mudbidri (60.9) are relatively better compared to northern Karnataka taluks (Gurumithakala 18.2; Afzalpur 19.3; Aland 19.8; Basavakalyan 204; Kundgol 22.1; Shiggaon 22.4; Aurad 22.4, etc.
Taluks such as Bangalore-South (74), Yelahanka (67.8), Bangalore-East (65.1), Udupi (61.5), Anekal (57.4), Bangalore (North) 57.3, Gokak (51.8) are economically vibrant taluks, while Hosadurga (5.8), Saraguru (5.6), Bhalki (5.3), Kushtagi (5.3), Aland (5.2), Chincholi (4.8), Kollegala (4.7), Afzalpur (4.6), Joida (2.6), etc. in Northern Karnataka are economically very backward taluks
Highlights of the current analyses are:
|
Highest |
lowest |
|
|
Environmental Score (out of 170) |
Bhatkal (89) |
Mudhol (21) |
|
Social Score (out of 140) |
Mangalore (82) |
Gurumithakala (18) |
|
Economic Score (out of 100) |
Bengaluru-South (74) |
Joida (03) |
|
EPI (out of 410) |
Mangalore (207) |
Gurumithakala (52) |
- Southwestern part of Karnataka outperforms the rest of the state. It excels in the environmental sector and performs reasonably well in the other two sectors. There is still considerable potential for economic and social growth.
- Northern Karnataka lags in all sectors. It performs lower in the Economic sector.
- Southeastern region of Karnataka performs reasonably well in the economic and social sectors but falls short in the environmental sector.
- Bengaluru, the state capital, excels in economic and social sectors. However, policies must be made to prevent overpopulation and vehicle congestion. The environmental sector needs more attention.
Policies and initiatives must be formulated with the objective of ensuring a long-term sustainable future. Adaptations in the regional policies (environmental, social and economic) for prudent management of natural resources (land, water, energy, etc.) are crucial to accomplish sufficiency in biophysical resources while bestowing social equity in access and overall economic progress.
Annexure
- Go to https://giovanni.gsfc.nasa.gov/giovanni/
. Click on the Login option present in the right side or click Login
on the ‘Welcome to Giovanni’ dialog box which appears as soon as the page
is loaded.
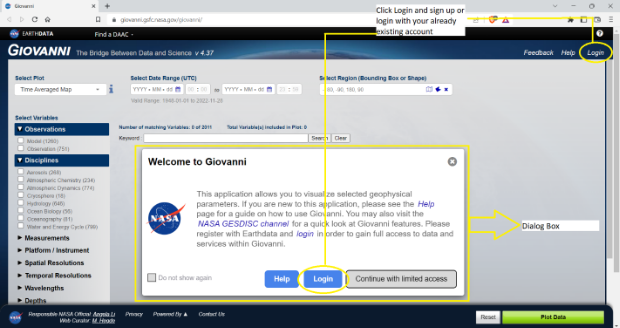
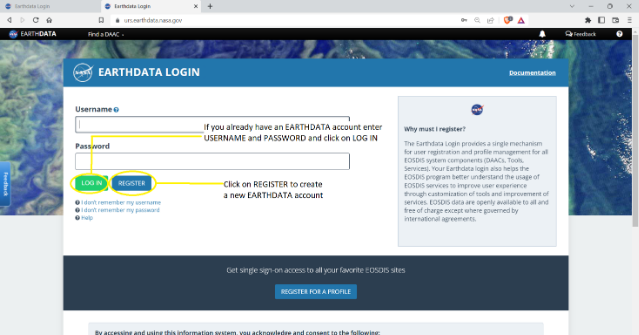
- Then will be redirected to https://urs.earthdata.nasa.gov/. Sign up by
clicking on Register i.e., create a new account or login using an already existing EARTHDATA account.
After creating your account enter your credentials and click on LOG IN.
- After clicking on login, will be redirected to https://giovanni.gsfc.nasa.gov/giovanni/
.
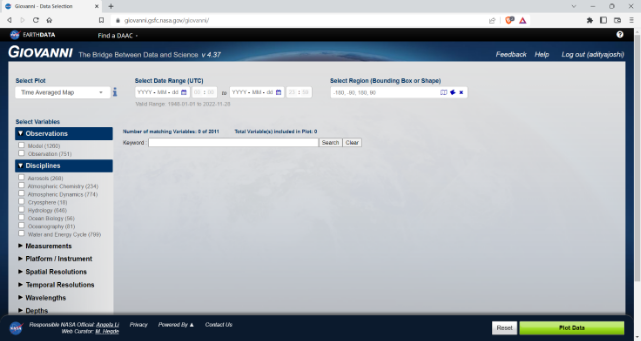
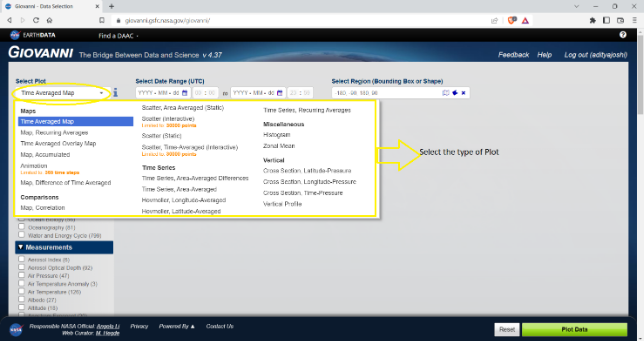
- Select the type of map to be plotted by clicking on the drop-down box present below Select
Plot.
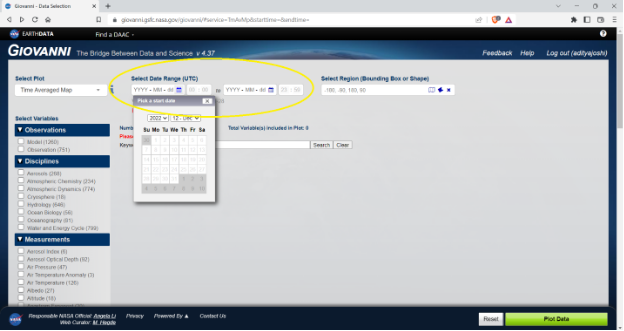
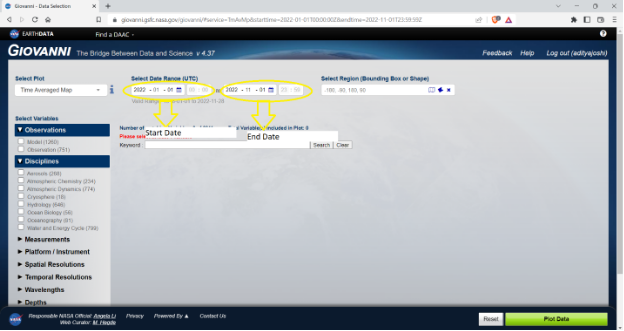
- Select the Date Range (start date and end date) by clicking on the calendar icon or
enter the date range manually.
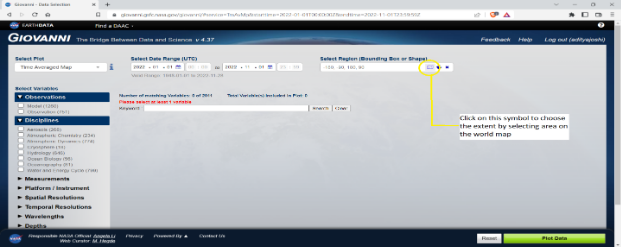
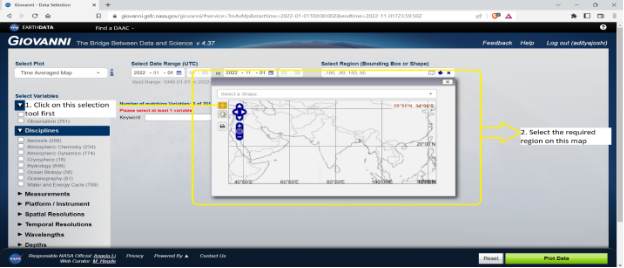
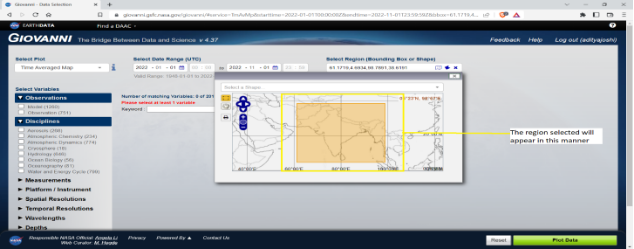
- Select the Region for which data is required, either by manually entering the
latitude and longitude extents or by selecting the area on the map which occurs on clicking the Map
symbol.
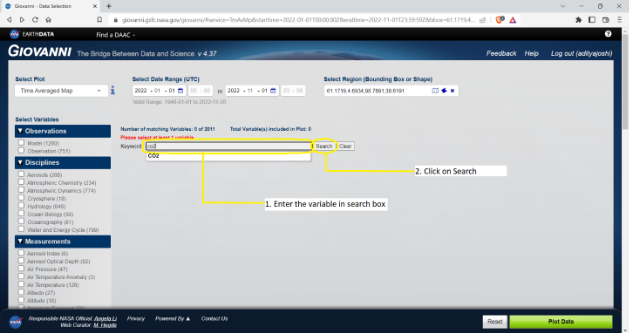
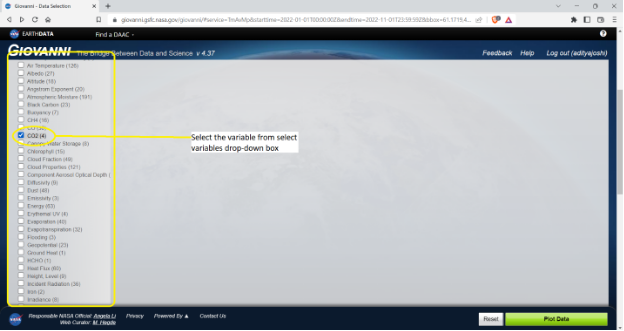
- Enter the variable/parameter to be acquired either by a) manually entering in the search box and
clicking on search, or b) by selecting the variable from Select Variables drop-down
box.
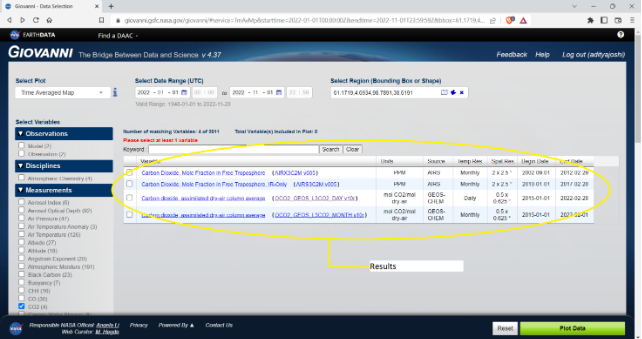
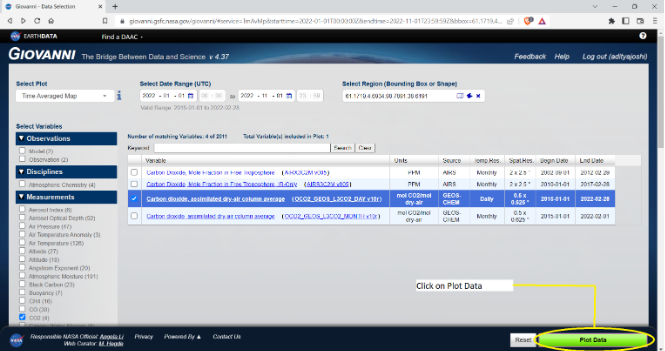
- The results appear after the page loads.
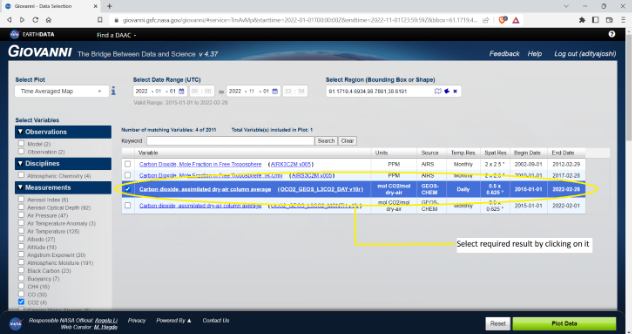
- Select by clicking on it.
- After selecting the required result, click on Plot Data present at the bottom.
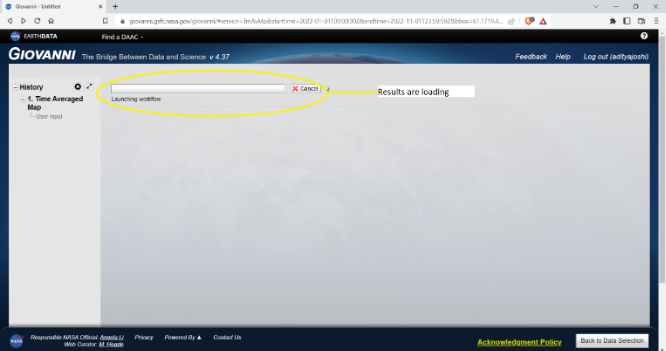
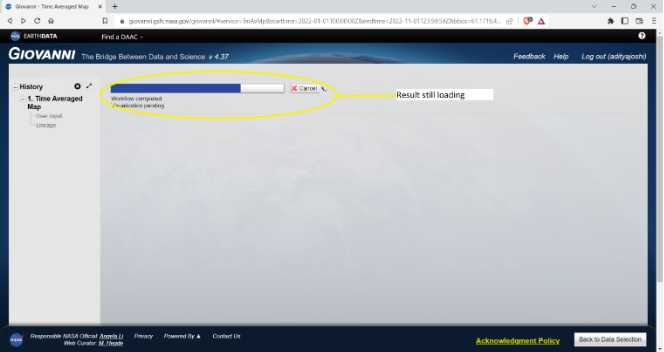
- The page starts to load. The result appears after a short duration.
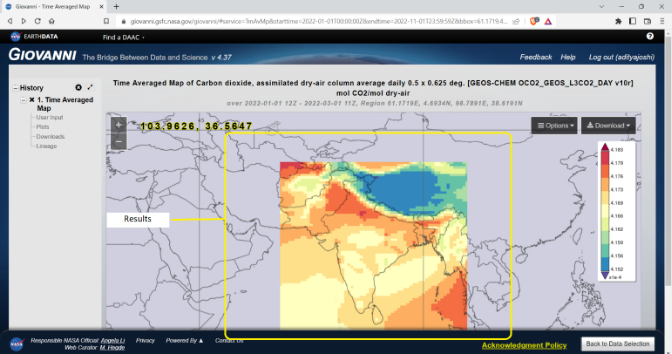
- Click on the Download option present on the upper-right side of the screen.
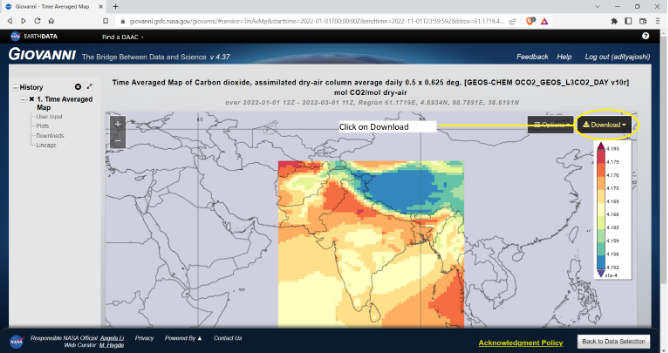
- A drop-sown menu appears. Select the format of the download.
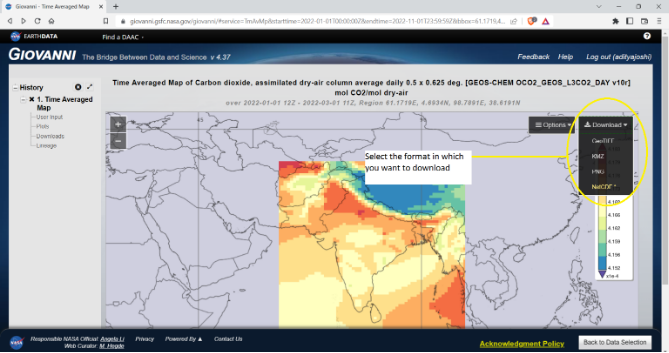
- The required file gets downloaded.
- The downloaded file is converted to .csv or .xslx format either using an online converter or through the use of a programming language[13].
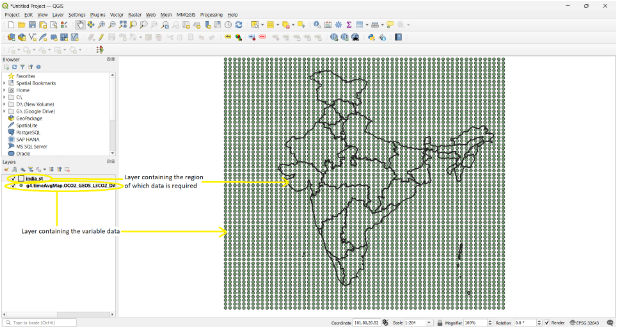
- The .csv file is loaded in (a geospatial data processing software like) QGIS.
- Load .shp file with a clear boundary of the region of which data is required.
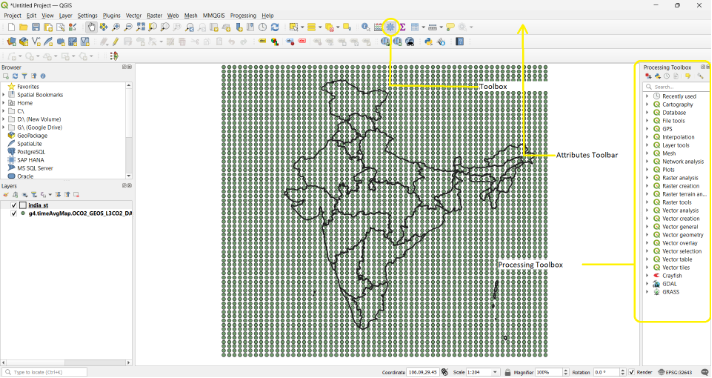
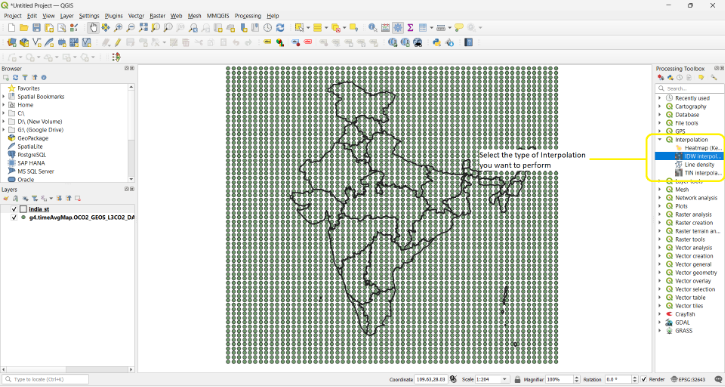
- Click on the Toolbox option present in the Attributes Toolbar or
use the shortcut Alt+Ctrl+T. Processing Toolbox window appears on
the right side of the screen.
- Click on Interpolation in Processing Toolbox. A drop-down menu appears and select
the type of interpolation to perform. Here IDW (Inverse Distance Weighing)
Interpolation is selected.
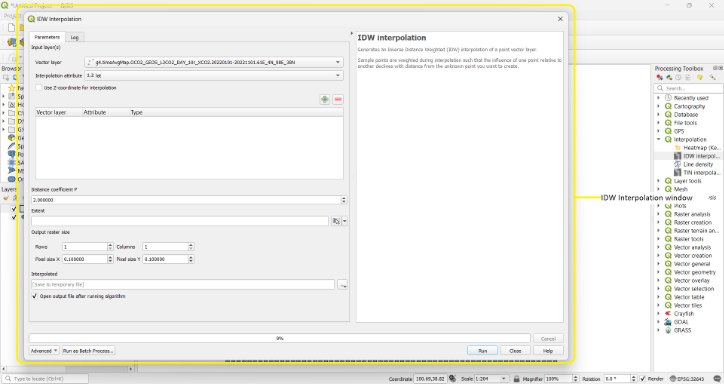
- Double click on the selected (IDW) interpolation operation. A new IDW Interpolation window appears.
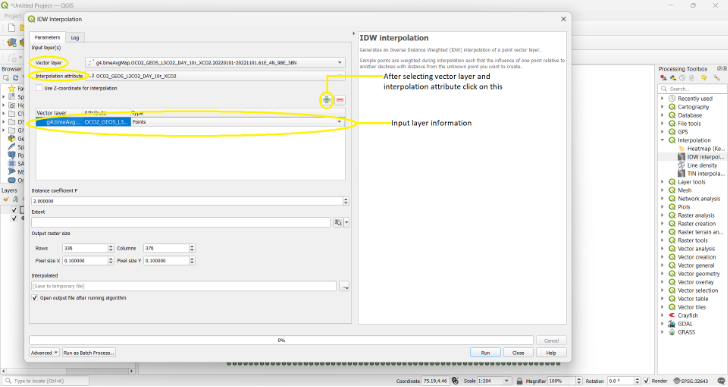
- Select the 1) Vector Layer 2) Interpolation Attribute and click on
the ‘+’ symbol. The input layer information (vector layer, attribute and
type) appears on the window.
- Choose 1) Distance coefficient 2) Extent of interpolation region and 3) the location where the interpolated must be saved. (While choosing the location a new window appears and you can also choose the format in which the interpolated file is saved)
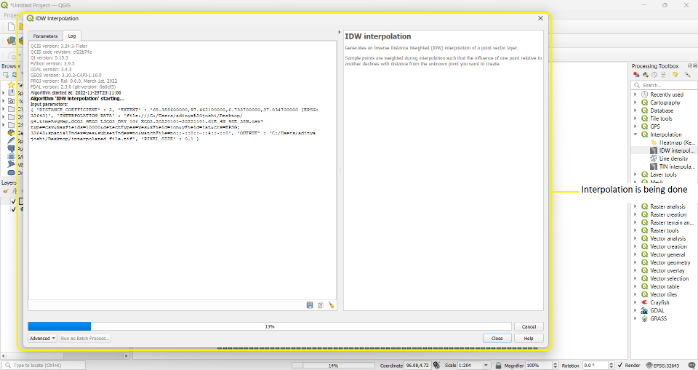
- Click on the Run option.
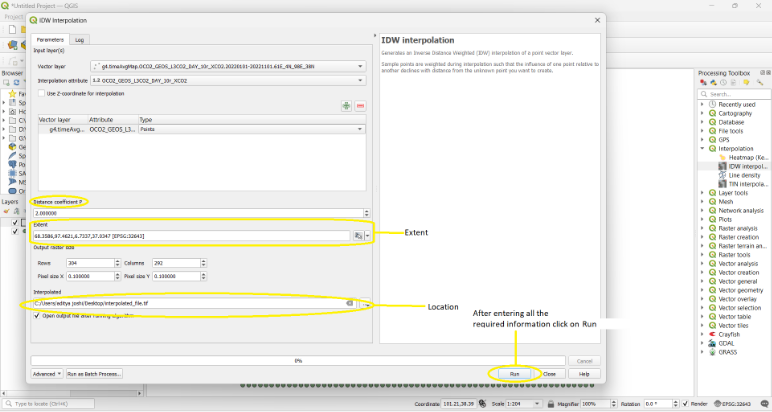
- The interpolation process begins. After the process is completed, the interpolated layer is
obtained.
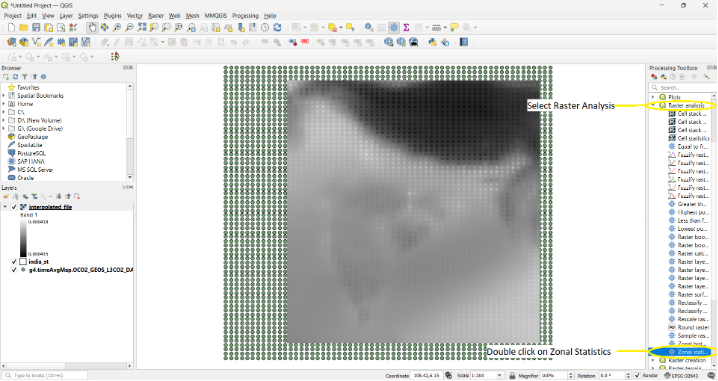
Zonal Statistics is performed to obtain(convert) the interpolated data in .csv format.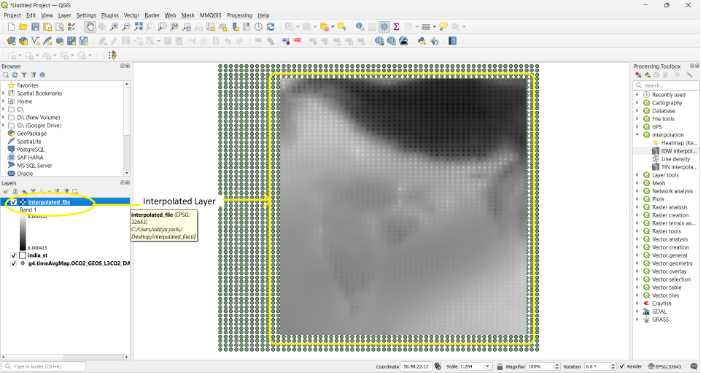
- After the interpolated layer is obtained, select Raster Analysis option present in
the Processing Toolbox. A drop-down menu appears and double click on Zonal
Statistics.
- Zonal Statistics window appears.
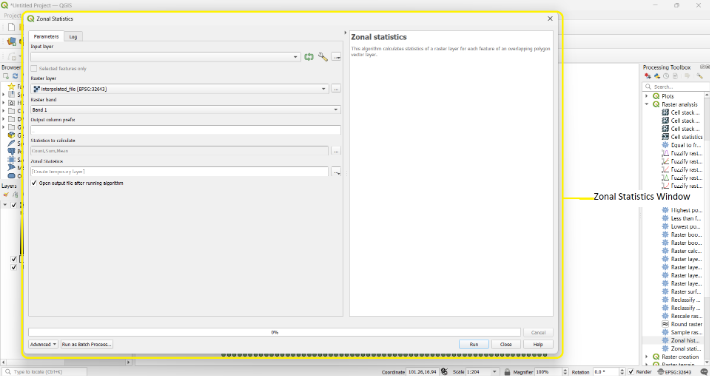
- Select 1) Input Layer 2) Raster Layer 3) Output column prefix 4) Statistics to calculate [count, sum, mean, median, standard deviation, minimum, maximum etc.] and 5) Location where .csv file is to be stored.
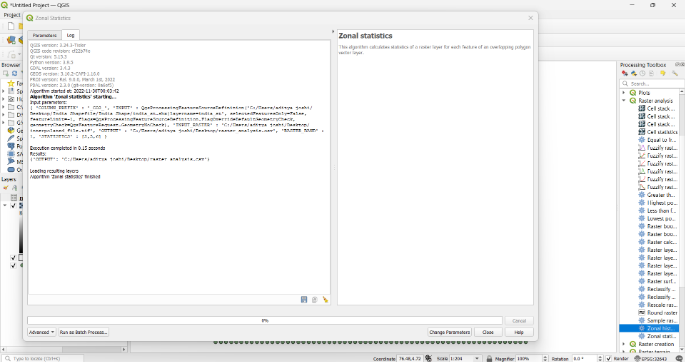
- Click on the Run option.
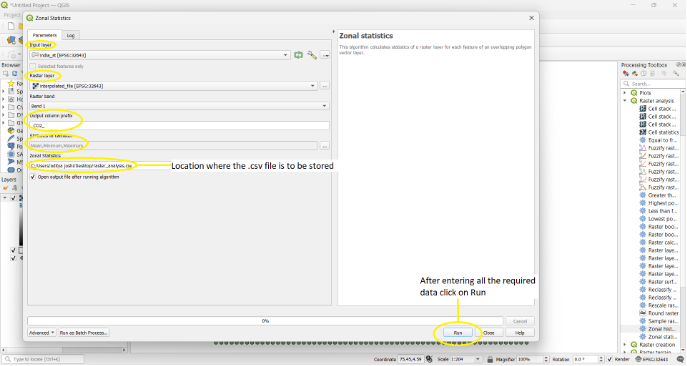
- The zonal statistics process begins. After the process is completed, the .csv file is obtained in
the provided location.
- Result-
The obtained .csv file: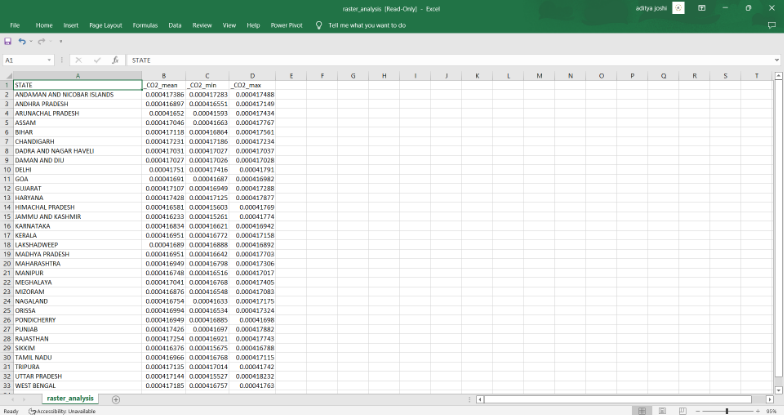
References
- https://www.sdgindex.org/
- https://epi.yale.edu/
- Image source-https://en.wikipedia.org/wiki/File:Doughnut_(economic_model).jpg
- https://sdgindiaindex.niti.gov.in/#/ranking
- https://www.researchgate.net/publication/339645265_Safe_and_Just_Operating_Space_for_India
- https://www.e3s-conferences.org/articles/e3sconf/abs/2018/16/e3sconf_iims2018_02003.html
- https://en.wikipedia.org/wiki/Geography_of_Karnataka
- https://www.kla.kar.nic.in/karnataka.htm
- https://prsindia.org/budgets/states/karnataka-budget-analysis-2020-21
- https://wgbis.ces.iisc.ac.in/energy/NCAVES/IISc_Ecosystemservices_2JUNE2022%5b2227%5d.pdf
Ramachandra, T.V., Vinay, S., Bharath, Setturu, and Bharath, H. Aithal (2022).
Valuation of Ecosystem Services, Karnataka State, India. Available at:
https://wgbis.ces.iisc.ac.in/energy/NCAVES/00_IISc_3_Ecosystemservices_2JUNE2022.pdf - https://antharjala.karnataka.gov.in/storage/pdf-files/Karnataka
Ramachandra, T.V., Bharath Setturu, Vinay S and Bharath H Aithal. 2021a. Ecosystem Extent Account for Karnataka. Available at:
https://wgbis.ces.iisc.ac.in/energy/NCAVES/00_IISc_1_TVR_Ecosystem-extent_F_31July22.pdf
Ramachandra, T.V., Bharath Setturu, Vinay S, Rakesh D.R. and Bharath H Aithal. 2021b. Ecosystem Condition Account for Karnataka State, India. Available at:
https://wgbis.ces.iisc.ac.in/energy/NCAVES/00_IISc_2_Ecosystem_conditions.28July22.pdf
Ramachandra, T.V., Vinay, S., Bharath, Setturu, and Bharath, H. Aithal (2022a).
Valuation of Ecosystem Services, Karnataka State, India. Available at:
https://wgbis.ces.iisc.ac.in/energy/NCAVES/00_IISc_3_Ecosystemservices_2JUNE2022.pdf
Ramachandra, T.V., Bharath Setturu, Vinay S, Chandan M C and Bharath H Aithal,
(2022c). Scenario-based assessment of policy interventions in Karnataka State, India. Available at: https://wgbis.ces.iisc.ac.in/energy/NCAVES/00_IISc_4_REV_MODELING_27july22.pdf
Ramachandra T V, Sincy V, Asulabha K S, Aishwarya B H and Bharath H Aithal, 2022d. Natural Capital Accounting and Valuation of Lentic Aquatic Ecosystem Services in Karnataka, Strategy Paper 3, Published by Karnataka Science and Technology Academy, Bangalore - Data is obtained from the following Districts at a
glance (DAGs):
The data for districts whose DAGs are not available is taken from Karnataka at a glance 2020-21(source-https://des.karnataka.gov.in/storage/pdffiles/PTC/KAG%20FINAL%202020-21.pdf ).
.jpg)
Data from the above websites pertains to following mentioned years for the corresponding mentioned places as data is not uniformly available for one particular year.