Accounting of ecosystem services from ichthyofauna in wetlands of Uttara Kannada district, Karnataka
Sincy V. 1,4 Jaishanker R.4 Asulabha K.S. 1,4and Ramachandra
T.V.1, 2, 3
1Energy & Wetlands Research Group [CES TE15], Centre for Ecological Sciences,
2Centre for Sustainable Technologies (ASTRA)
3Centre for infrastructure, Sustainable Transportation and Urban Planning (CiSTUP)
4Indian Institute of Information Technology and Management-Kerala (IIITM-K),
Thiruvananthapuram,
Kerala
Indian Institute of Science, Bangalore - 560 012, India.
envis.ces@iisc.ac.in
tvr@iisc.ac.in Phone:
080 22933099/22933503 (extn 107, 114)
Materials and Methods
Study Area
Uttara Kannada is the 5th largest district in Karnataka State, located between north latitudes 13o55'02" to 15o31'01" and east longitudes 74o0'35" to 75o10'23". It is bordered by Goa state and Belgaum district to the north, Dharwad district and Haveri district to the east, Shivamogga district and Udupi district to the south, and the Arabian Sea to the west. The district has forests (dry deciduous, moist deciduous, evergreen to semi evergreen forests), perennial rivers, abundant flora and fauna, and a long coastal line of about 140 km in length (Ramachandra et al., 2016). The study region (Karnataka State) is divided into 5'x5' equal area grids (2597) covering approximately 9 km x 9 km of 1:50,000 topographic maps of the Survey of India, from which we extracted grids of Uttara Kannada district for ecosystem service valuation. The wetland area (grid-wise) of Uttara Kannada district in Karnataka is shown in figure 1.
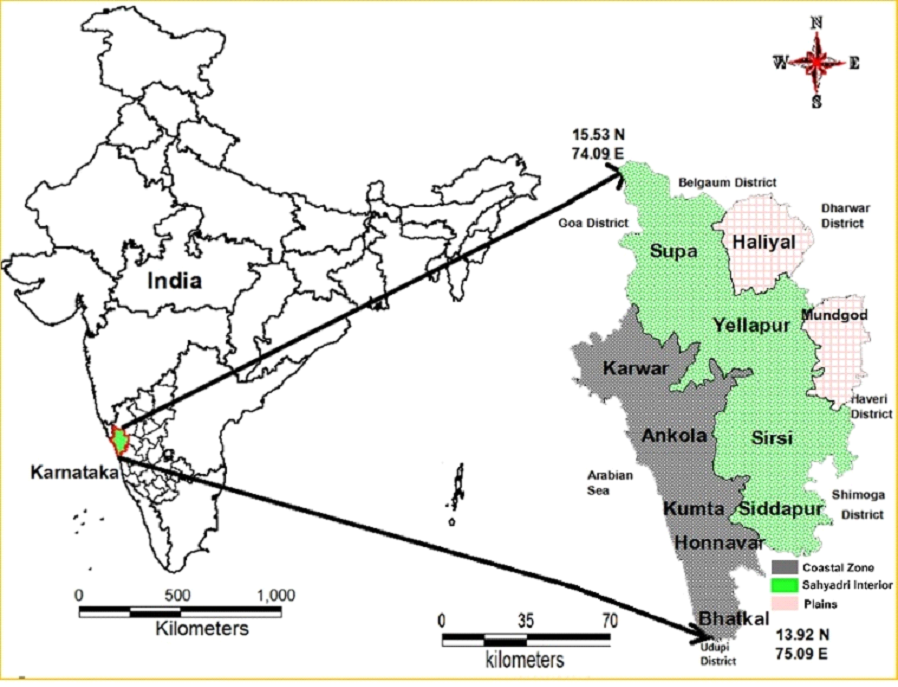
The district has a geographical area of 10,277 sq. km with the district headquarters located at Karwar town. The district is divided into four subdivisions: (a) Karwar subdivision, which includes Haliyal, Karwar, and Supa taluks; (b) Bhatkal subdivision, which includes Bhatkal and Honnavar taluks; (c) Kumta subdivision, which includes Kumta and Ankola taluks; and (d) Sirsi subdivision, which includes Sirsi, Yellapura, Siddapur, and Mundgod taluks. The total population of the district is 14,37,169 (as per the 2011 census) with a density of 140 persons per km2. The important rivers in the district are Sharavathi, Aghanashini, Kali, and Gangavali, which flow in a westerly direction to join the Arabian Sea. The major crops grown are paddy, maize, pulses, spices, oil seeds, fruits, vegetables, sugarcane, cotton, and coconut. The temperature ranges from 16oC to 37oC.
The benefit transfer method, as well as residual value and resource rent methods, are used in this study. The benefit transfer method involves transferring monetary values of ecosystem services from previous studies focusing on a different region or time period (Ramachandra et al., 2019). The total ecosystem supply value (TESV) was calculated by summing up the values of total provisioning, regulating, and cultural services. The residual value and resource rent methods estimate a value for an ecosystem service by taking the gross value of the final marketed good to which the ecosystem service provides an input and then deducting the cost of all other inputs, including labour, produced assets and intermediate inputs (SEEA, 2021). In the international System of Environmental-Economic Accounting (SEEA, 2014), ecosystem assets are generally valued on the basis of the net present value (NPV) of the expected flow of ecosystem services. NPV (for 50 years at a discount rate of 3%) was calculated for the ichthyofauna from wetland ecosystems in the Uttara Kannada district of Karnataka.
The equation for Residual value method used for provisioning services is as follows:
Σni=1 Qi x (Pi-Ci) --------- (1)
where Qi represents quantity, Pi is the price, Ci is the cost involved in the harvest of ith product
The equation for Benefit transfer method:
Σni=1 Vix Ai ---------- (2)
where Vi represents the monetary values per hectare and Ai represents the area
Total ecosystem supply value (TESV) is calculated as follows:
i = 1,2,3 (1: provisioning, 2: regulating and 3: Cultural)
Σ E Vi ---------(3)
where, NPV = net present value of wetland assets; R = net cash flow in year t; T = discount period (50 year); and r = discount rate (3%).
The values adopted for valuation of ecosystem service from ichthyofauna of wetlands in Uttara Kannada district are shown in table 1. QGIS open-source GIS software was used to generate maps of various ecosystem services provided by ichthyofauna. This study helps in the conservation and management of wetlands, biodiversity, and sustainable use of resources.
Table 1: Values adopted for valuation of ecosystem service from ichthyofauna
ES |
Services |
Unit Value (Rs/ha/yr) |
Provisioning Services |
Food |
32175 |
Genetic resources |
476 |
|
Medicinal resources |
786 |
|
Ornamental resources |
905 |
|
Regulating Services |
Nutrient recycling |
13604 |
Regulation of food dynamics |
918 |
|
Disease regulation |
1941 |
|
Water purification |
16225 |
|
Carbon sequestration |
234716 |
|
Nursery service |
10221 |
|
Cultural Services |
Spiritual experience |
8 |
Opportunities for recreation and tourism |
12111 |
|
Education |
29144 |
|
Inspiration for culture, art and design |
905 |
|
Species appreciation |
1954 |
|
Source: Ramachandra et al., 2022; ESVD, 2020; Clarkson et al., 2013 |
||