
 Sahyadri ENews Issues: I - LXXVIII

Rejuvenation & Sustainable Management of Gokarna Temple Pond - KotiteerthaCite
Ramachandra T V, Durga Madhab Mahapatra, Subash Chandran M D, Sincy V, Asulabha K S, Rao, G R, Vishnu D. Mukri, Akhil C A
ENVIS[RP], Environmental Information System, Energy and Wetlands
Research Group,
Centre for Ecological Sciences, Indian Institute of Science -
560012
envis.ces@iisc.ac.in
tvr@iisc.ac.in Phone:
080 22933099/22933503
Materials and Methods
Gokarna temple pond - Kotiteertha is located in Gokarna of Kumta taluk, in Uttara Kannada, Karnataka spans at 14o32'27.55' to 14o32'31.62" N and 74o19'10.60" to 74o19'17.85" E (Figure 1). Figures 2.1 and 2.2 show the inlet and outlet of the temple pond. Many locations in the shoreline of the pond are earmarked for conducting rituals of pithru karma for paying homage to forefathers or pitrupurushas.
Study area
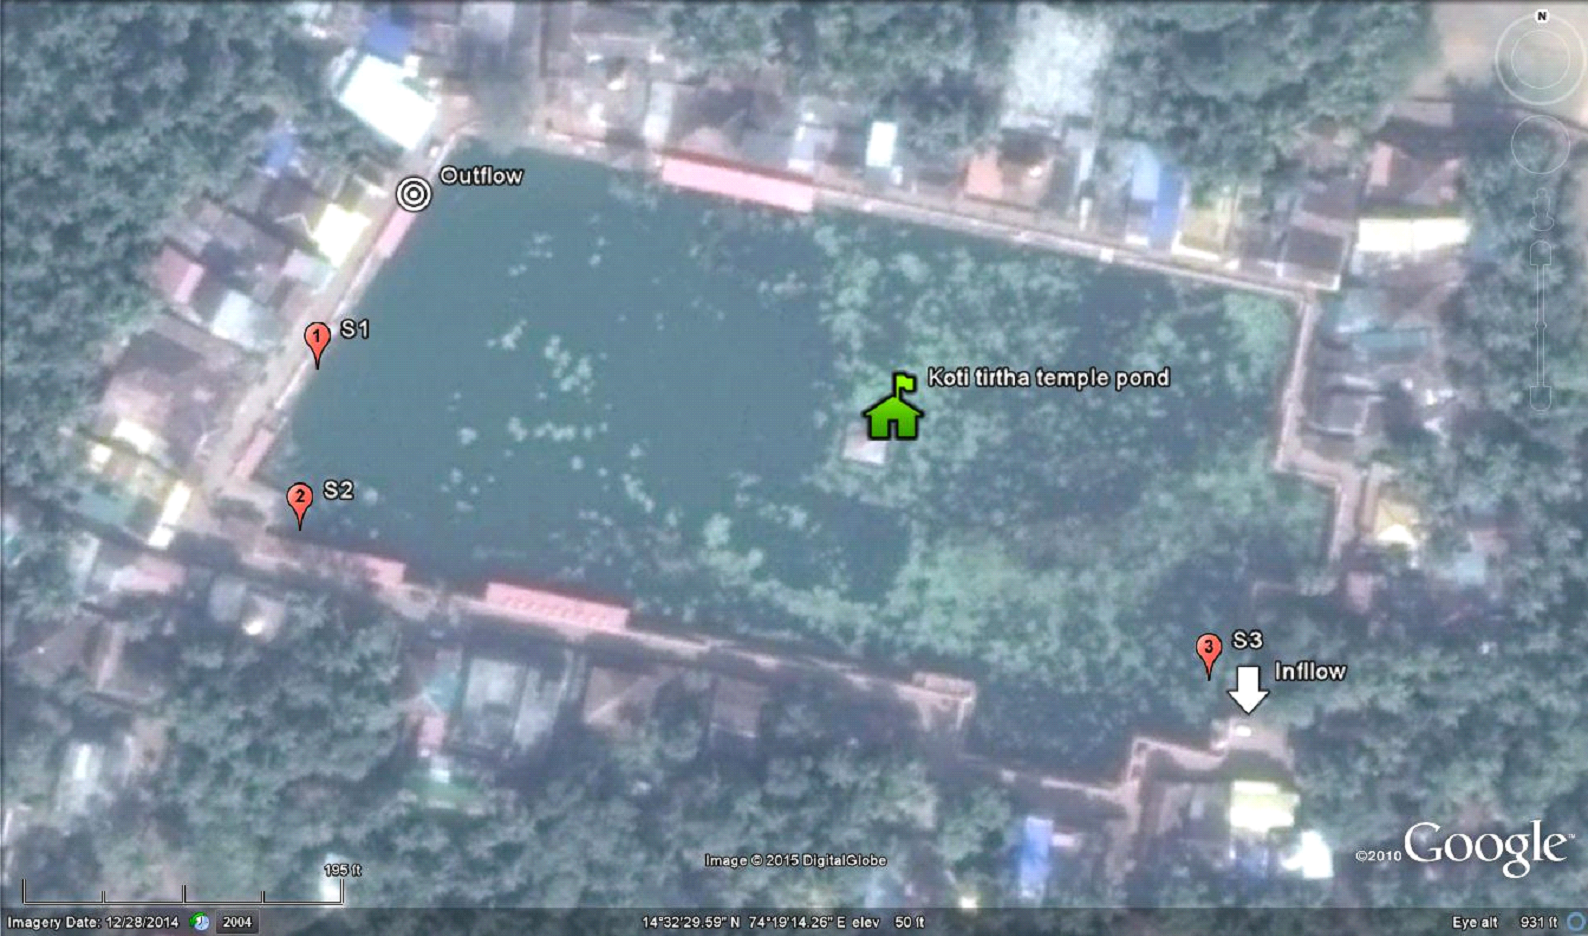
Figure 1. Kotiteertha pond
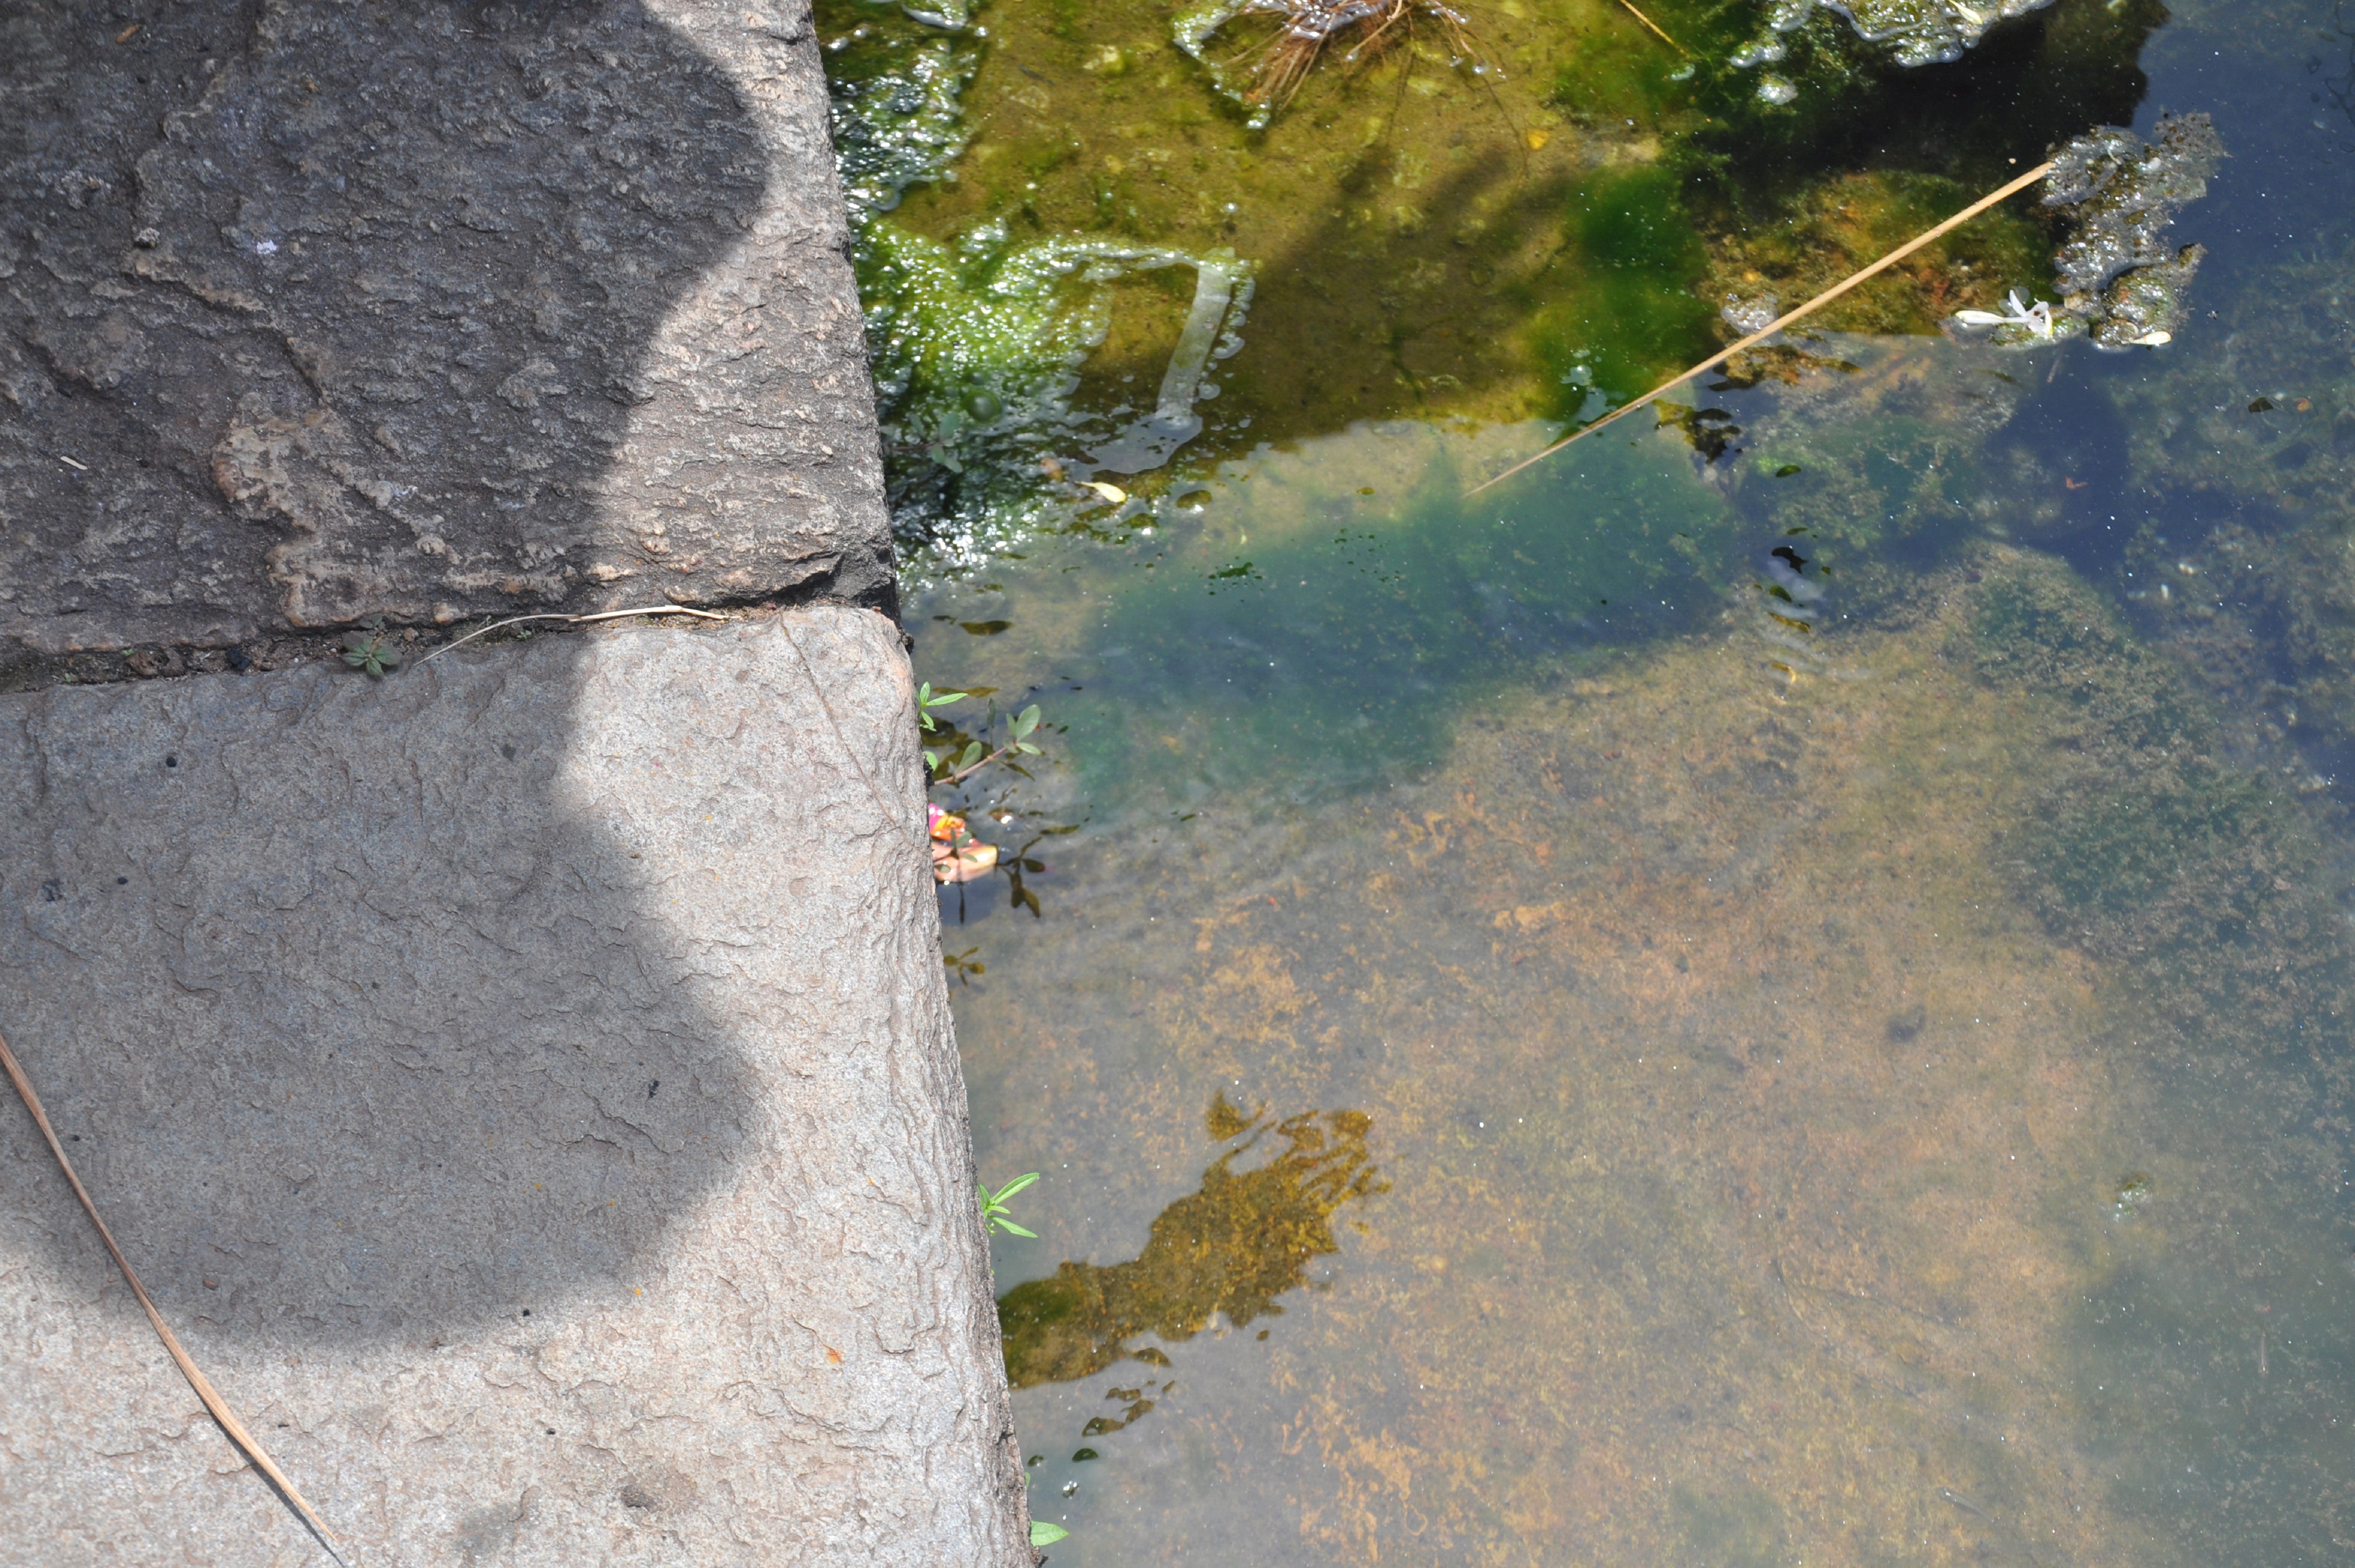
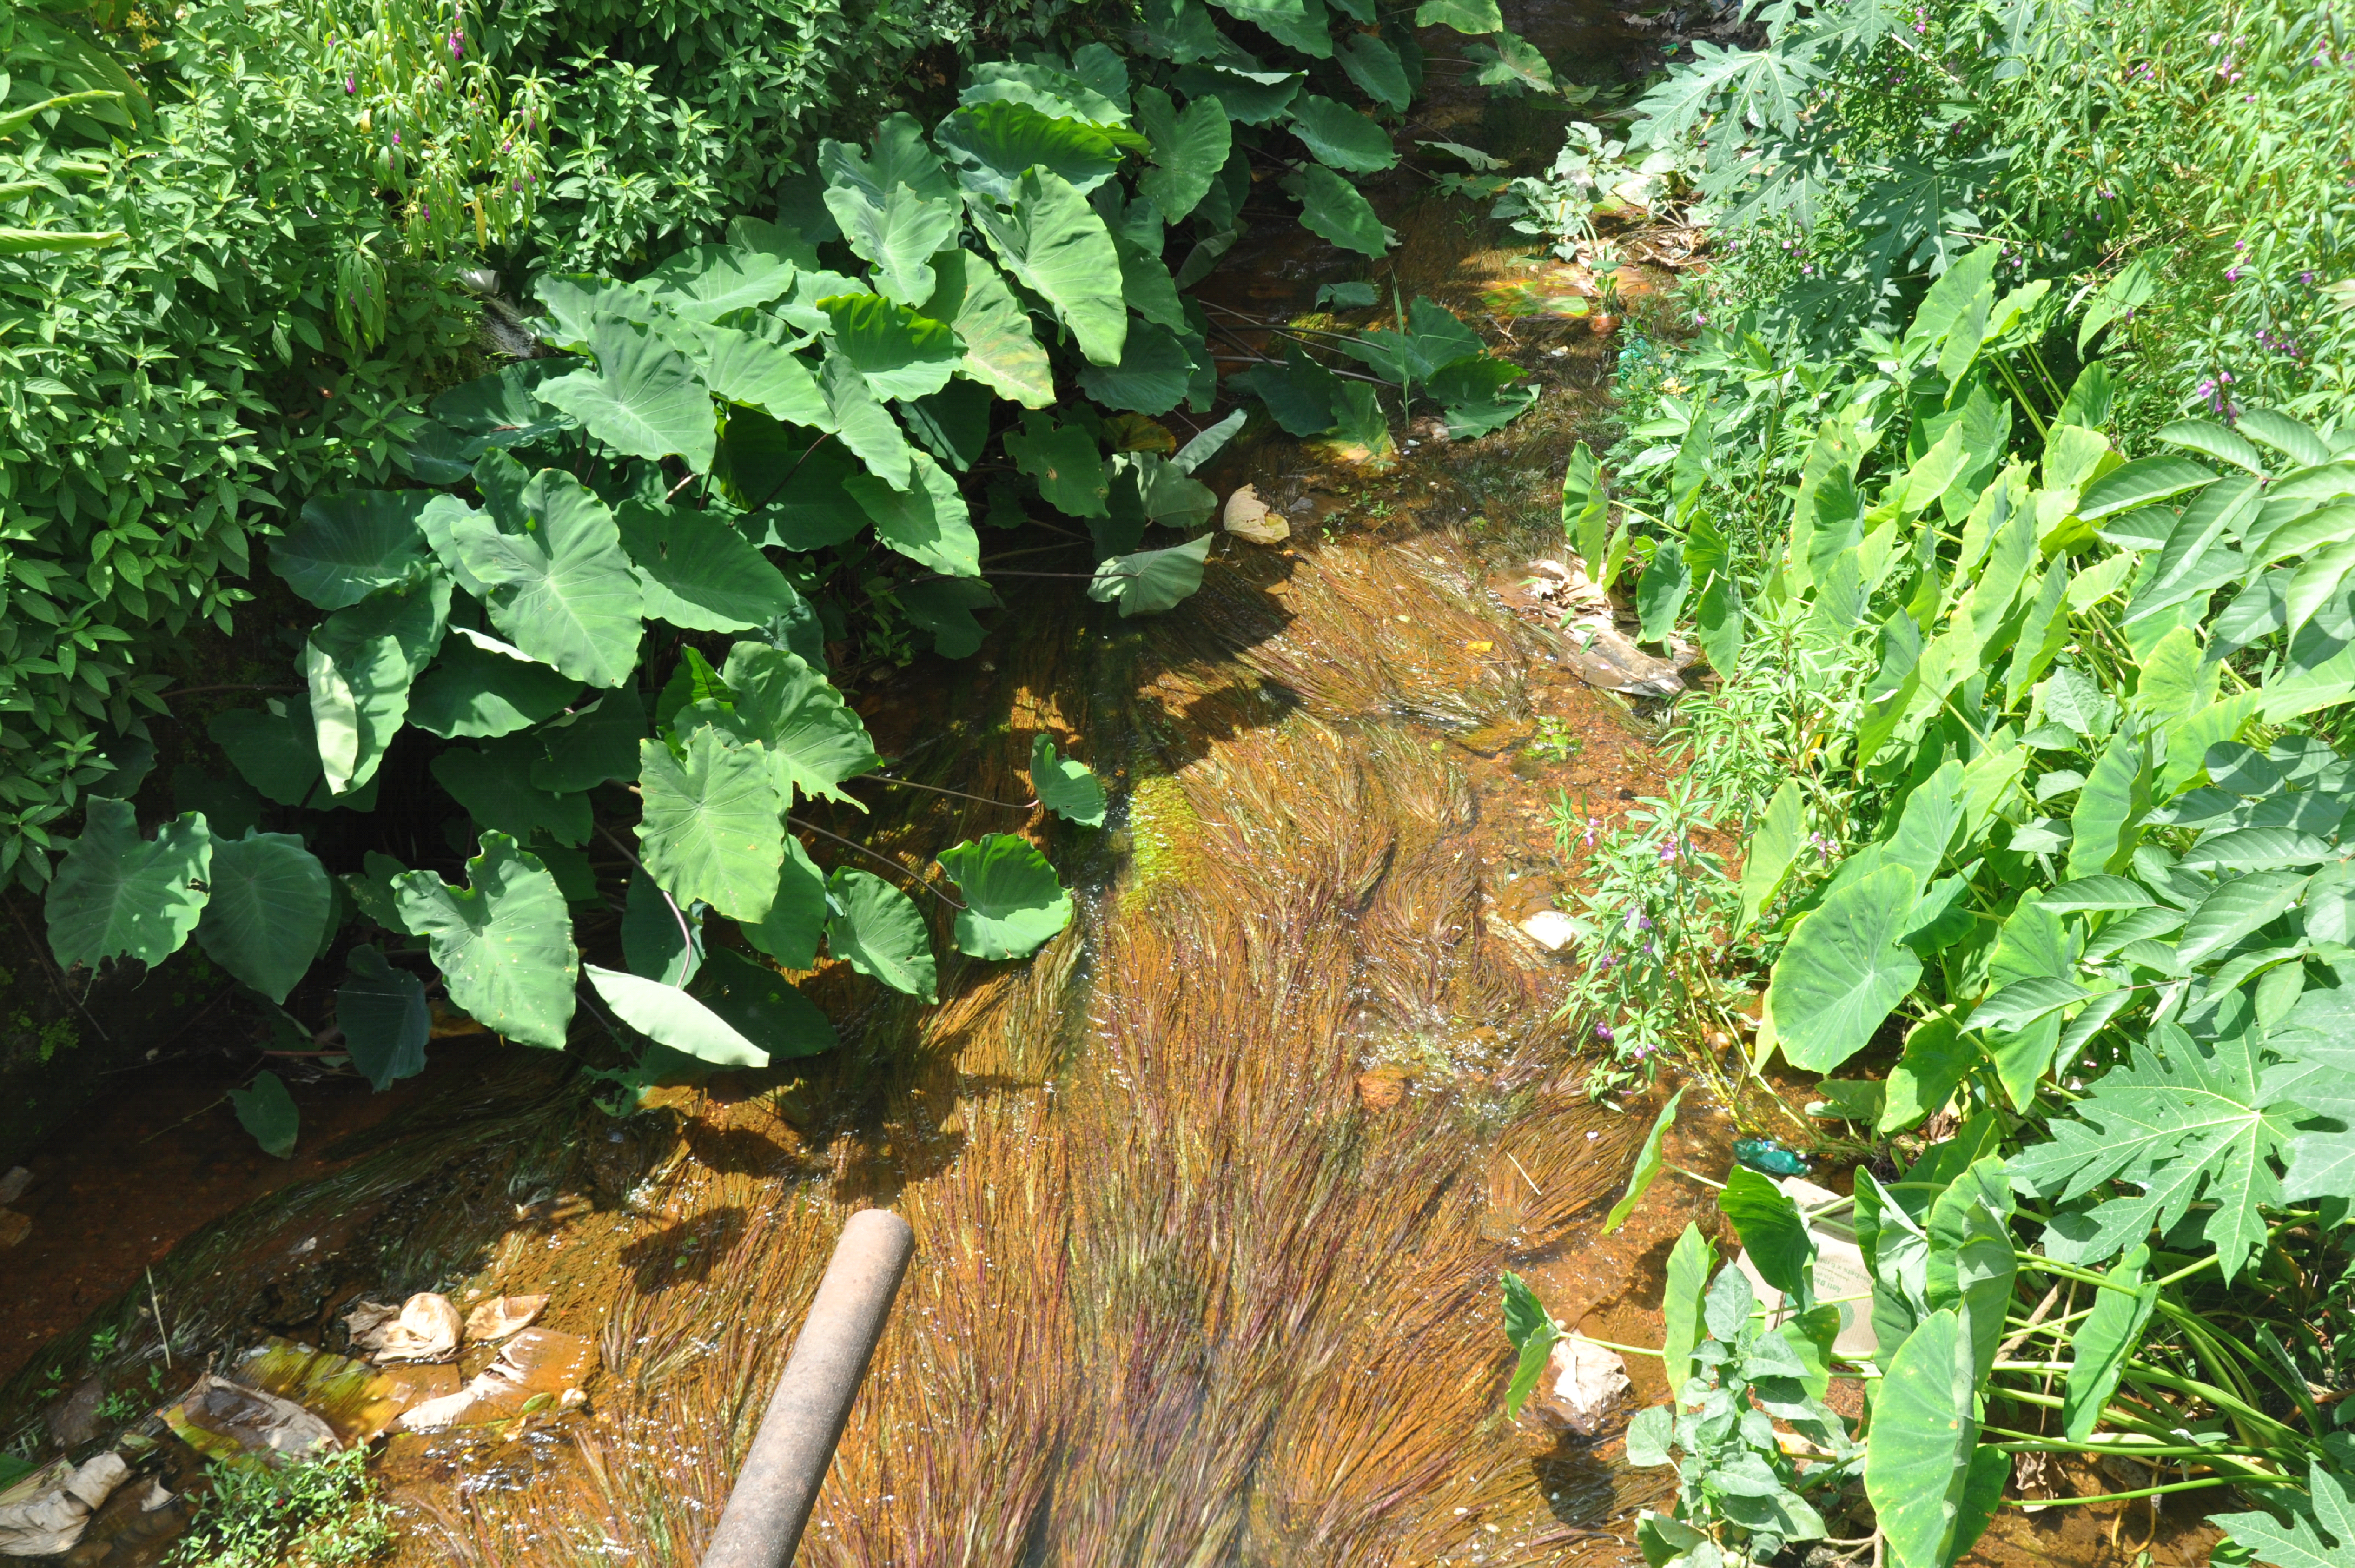
Figure 2.1) Inflow to the pond(east) and 2.2) Outflow from the pond
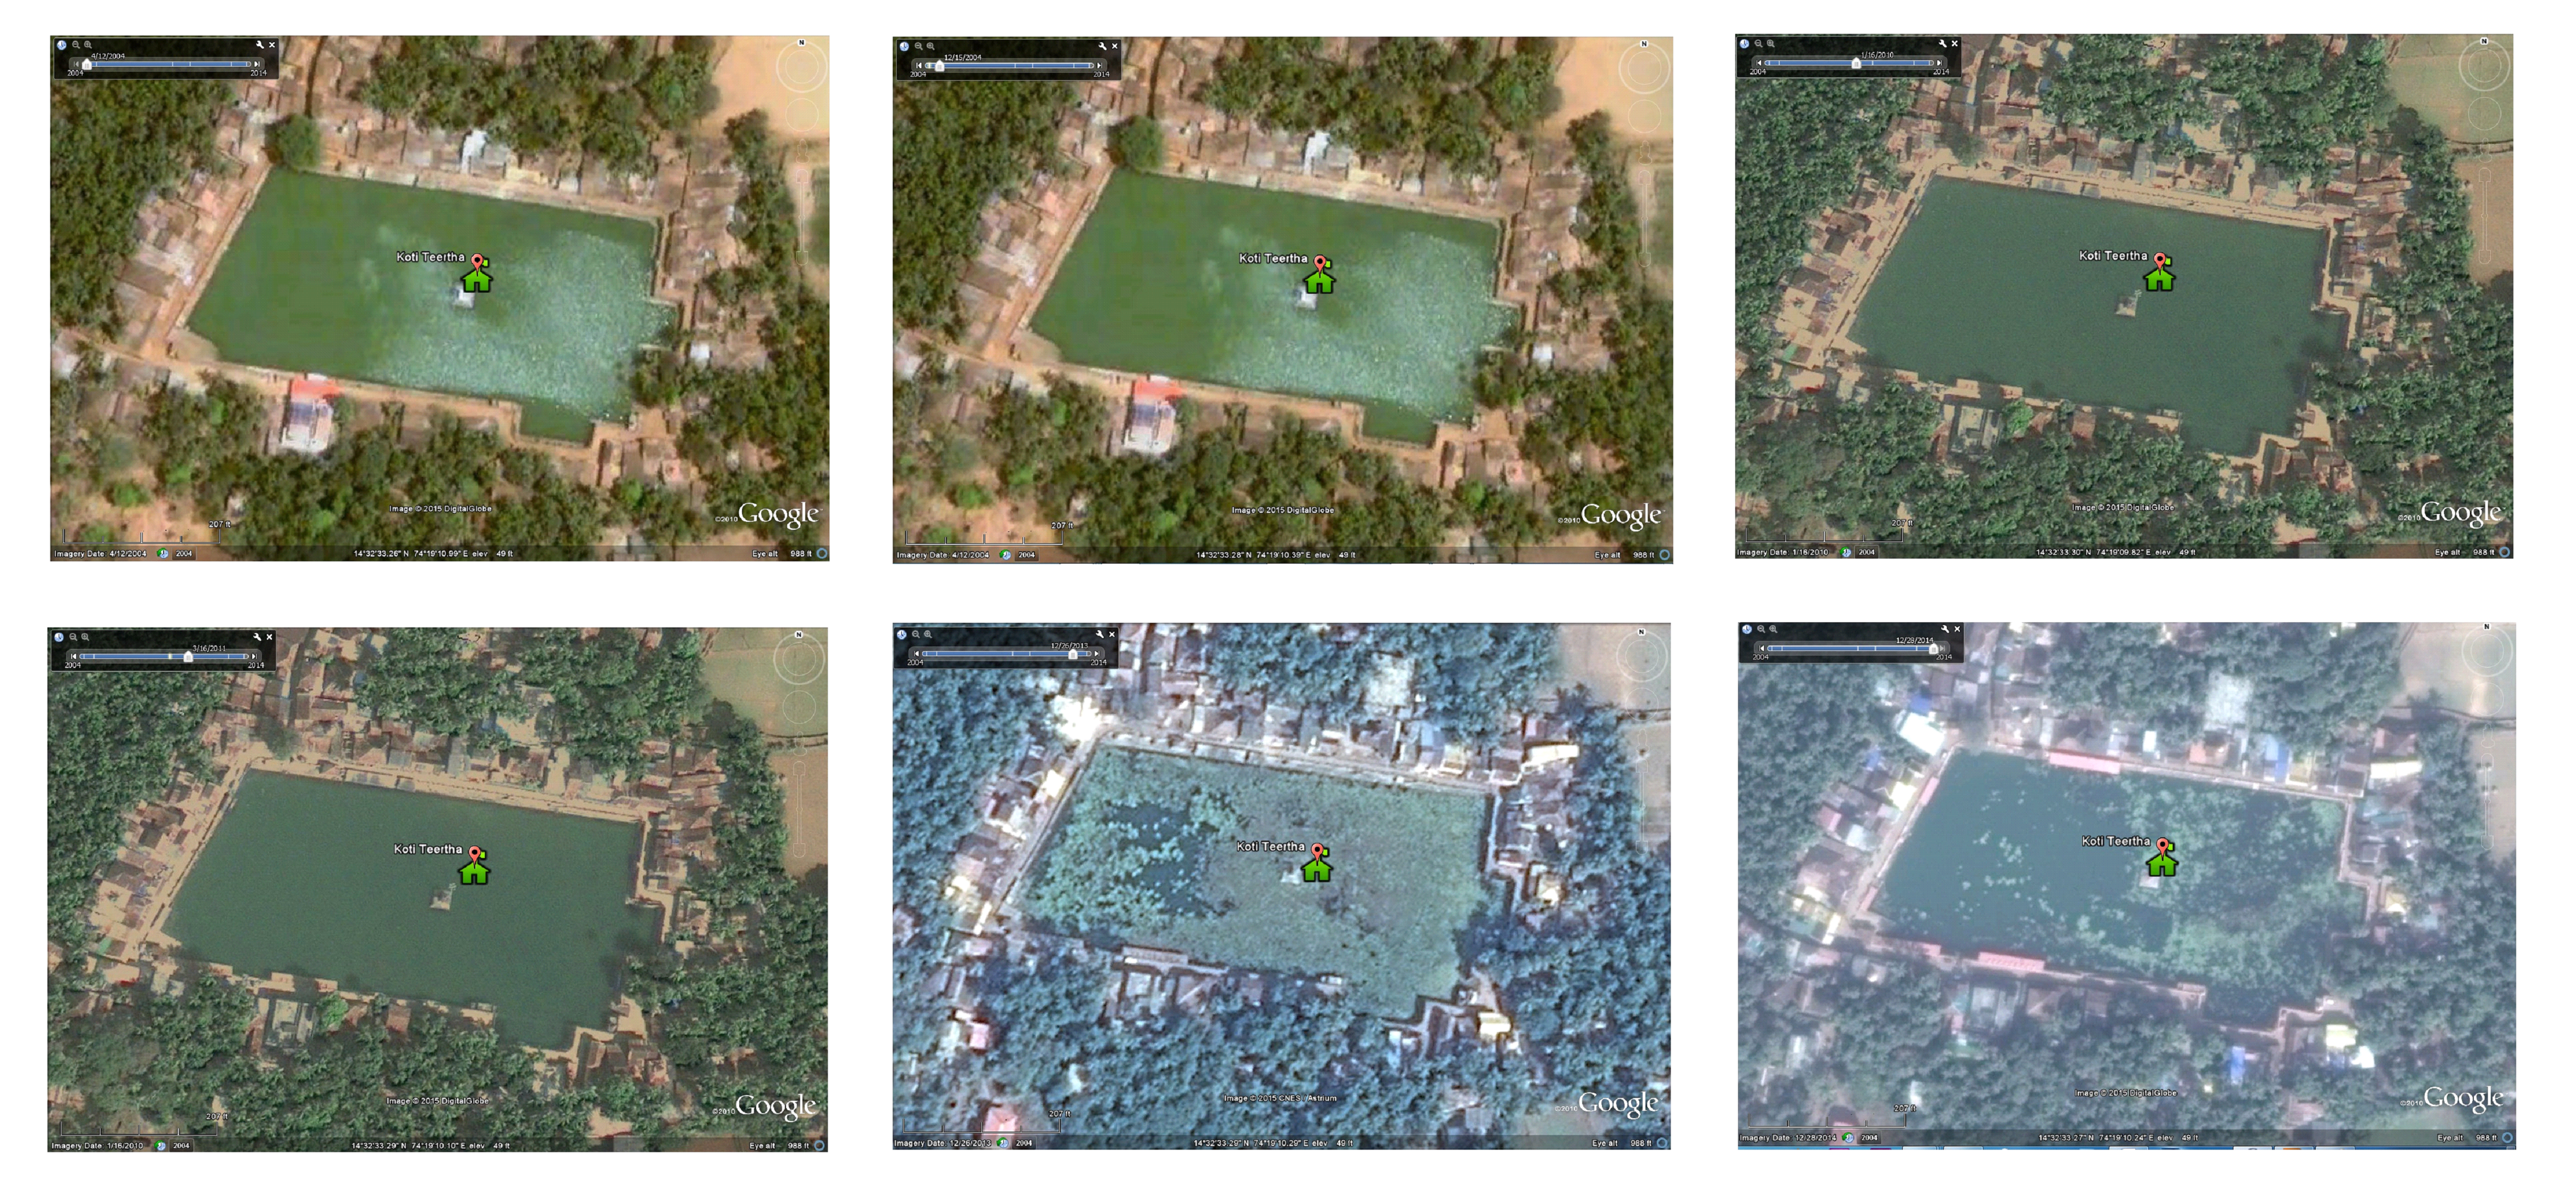
Figure 2.3 Temporal changes in surface cover of the temple pond from 2004-14
The pond (170m X 90m) has an area of ~1.53 hectares. The depth of the pond varies from ~5 m (at west) to 1.5 m (on eastern side). The estimated volume of the temple pond is >50,000 m3. The temple pond is surrounded by priest houses. The architecture of the temple pond highlight of historical design. Such deeper pond were constructed to store rainwater for meeting the water demand throughout the year. Several locations were earmarked on the bank of the pond, for performing rituals of pithru karma - Pitrupurusha shraddh, paying homage to the departed ancestor souls. During the field investigations on 27th September, it was observed (i) large number of devotees taking bath, ii) washing cloth with detergents, iii) washing utensils and iv) disposing organic matter (flowers, rice balls -pinda, grains, etc.) after rituals of pithru karma in the pond. Estimates indicate on an average about 200-250 families perform rituals of pithru karma every day. This means about 750 to 1000 gms of rice and other organic matters are disposed in the pond. These constitutes are rich in C (crabon) and N (nitrogen) and sustained disposal has enriched the pond with nutrients evident from the growth of filamentous algae and macrophytes. Figure 2.3 depicts further substantiates the temporal changes during 2004 to 2014, with the earlier events of siltation, algal blooms (2004, 2010 and 2011) and progressive increase in macrophytes cover (2013 onwards).
-
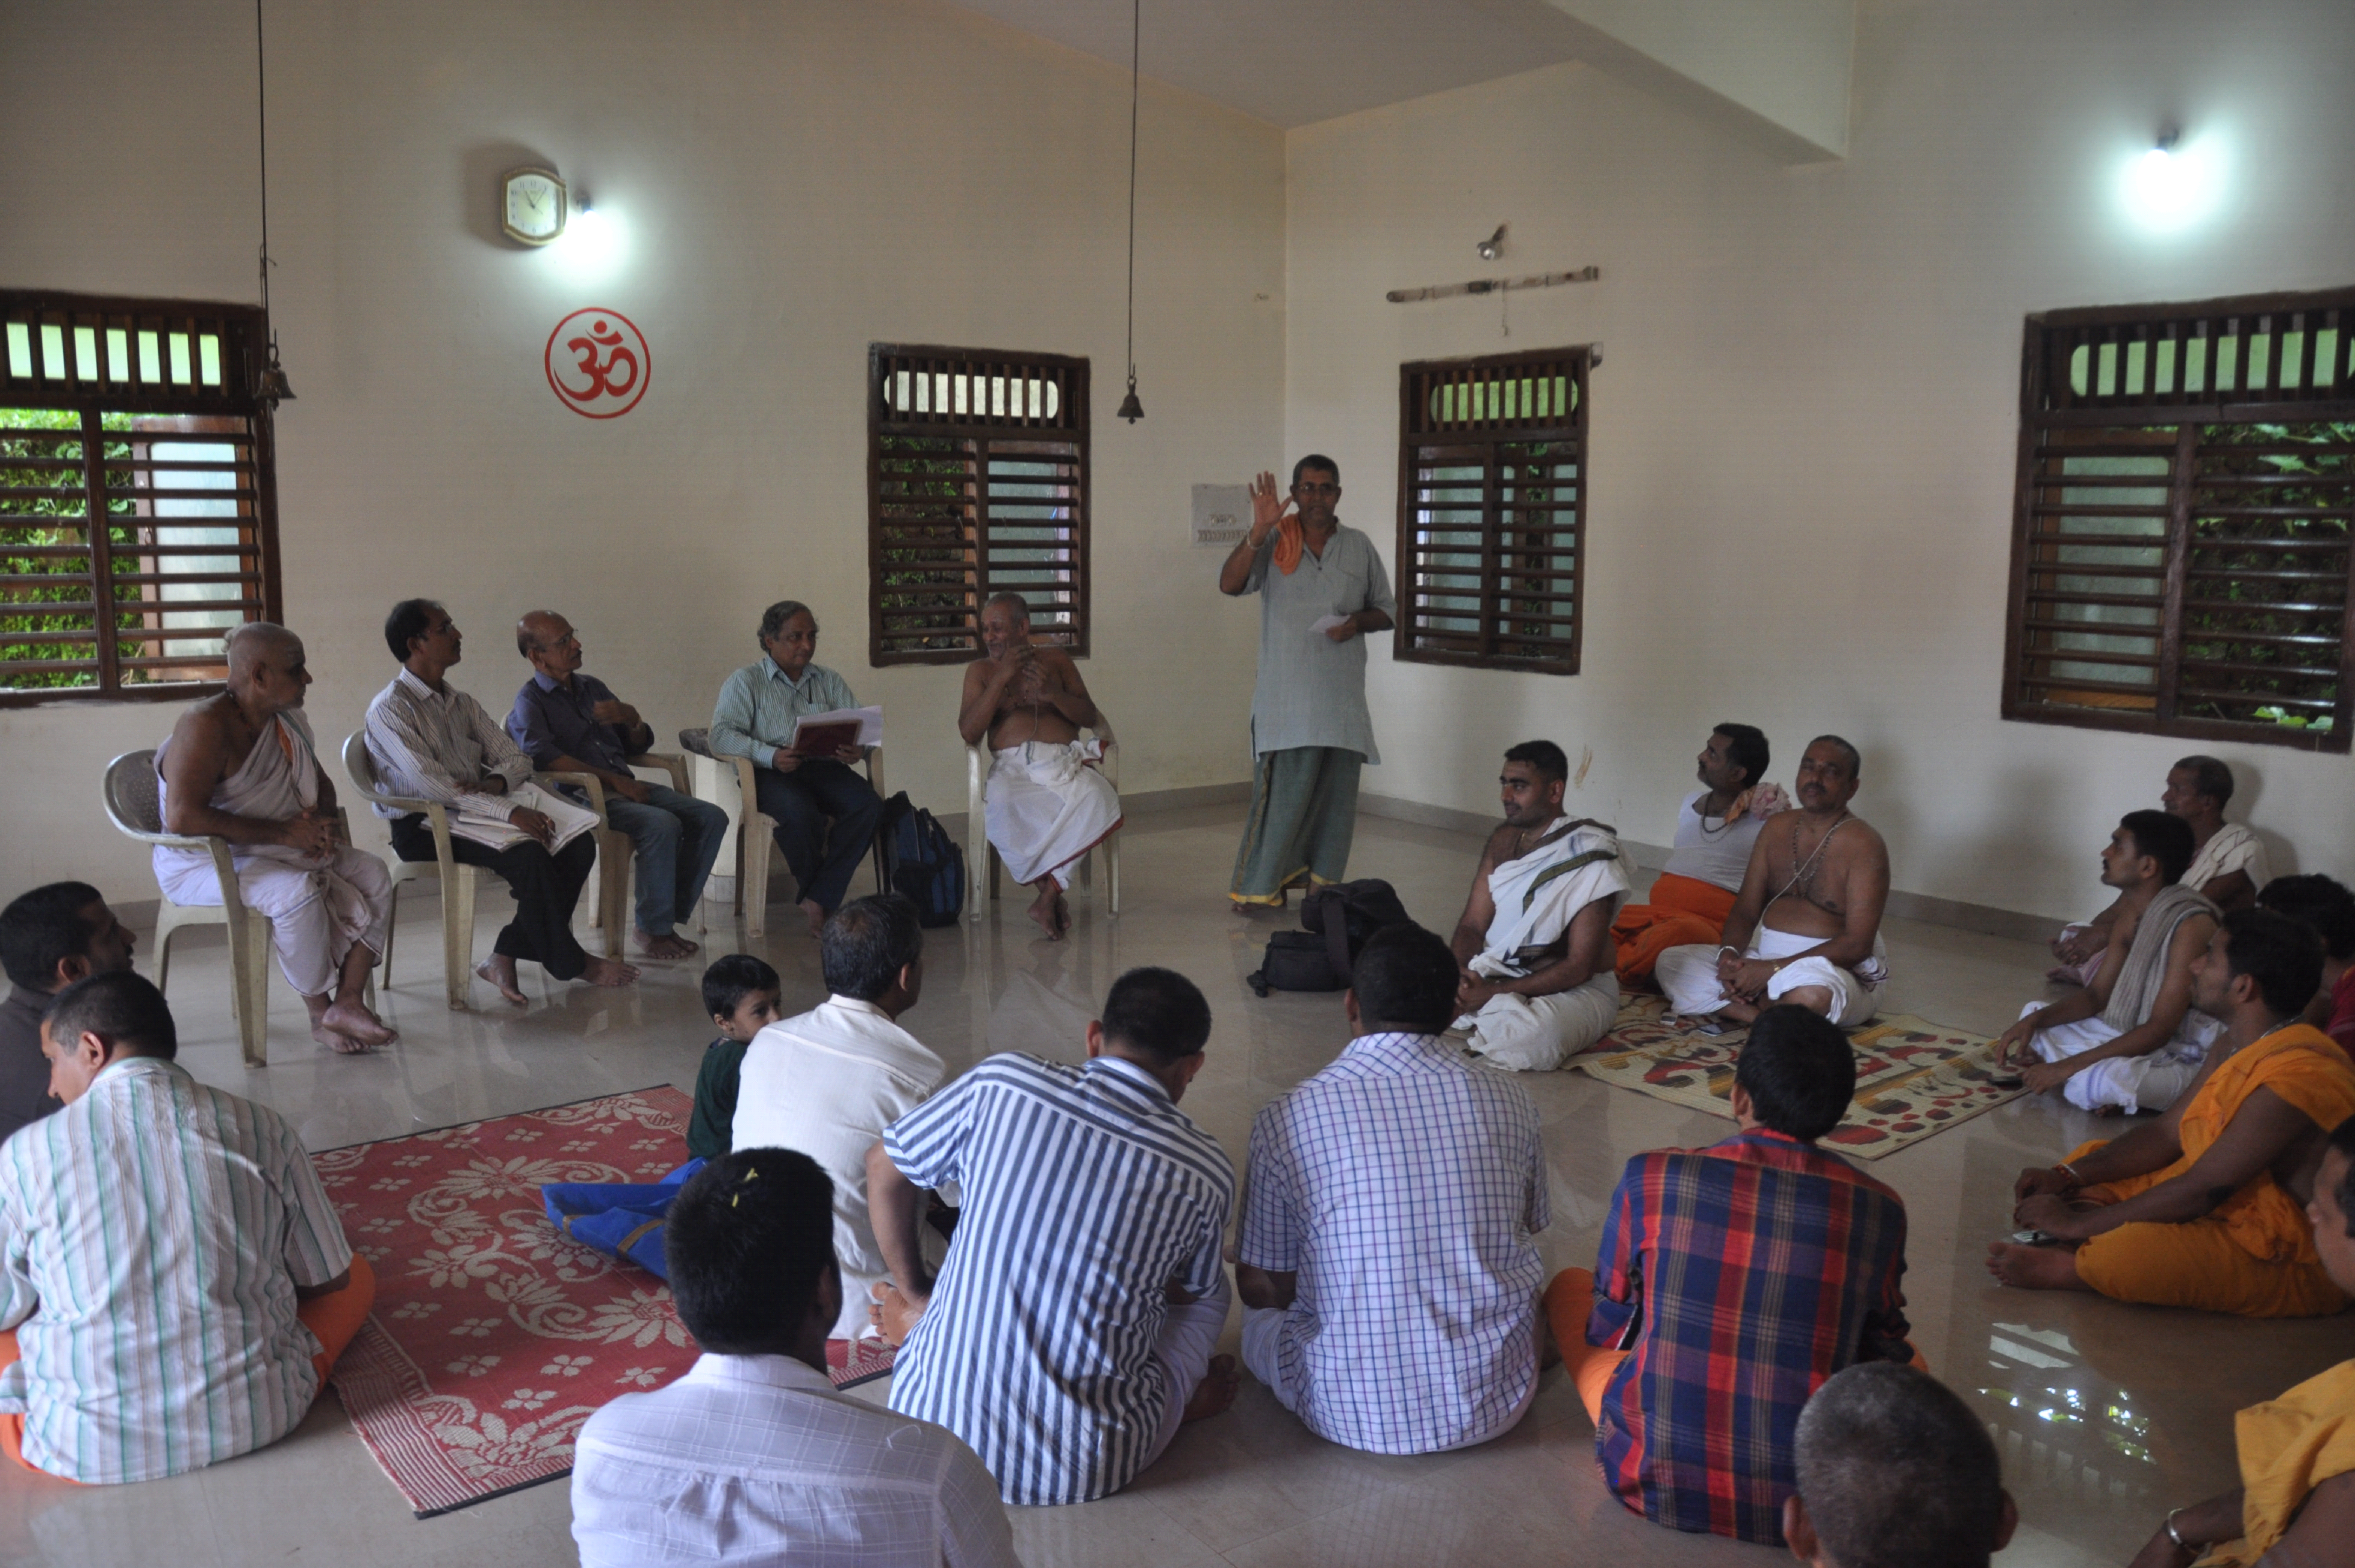
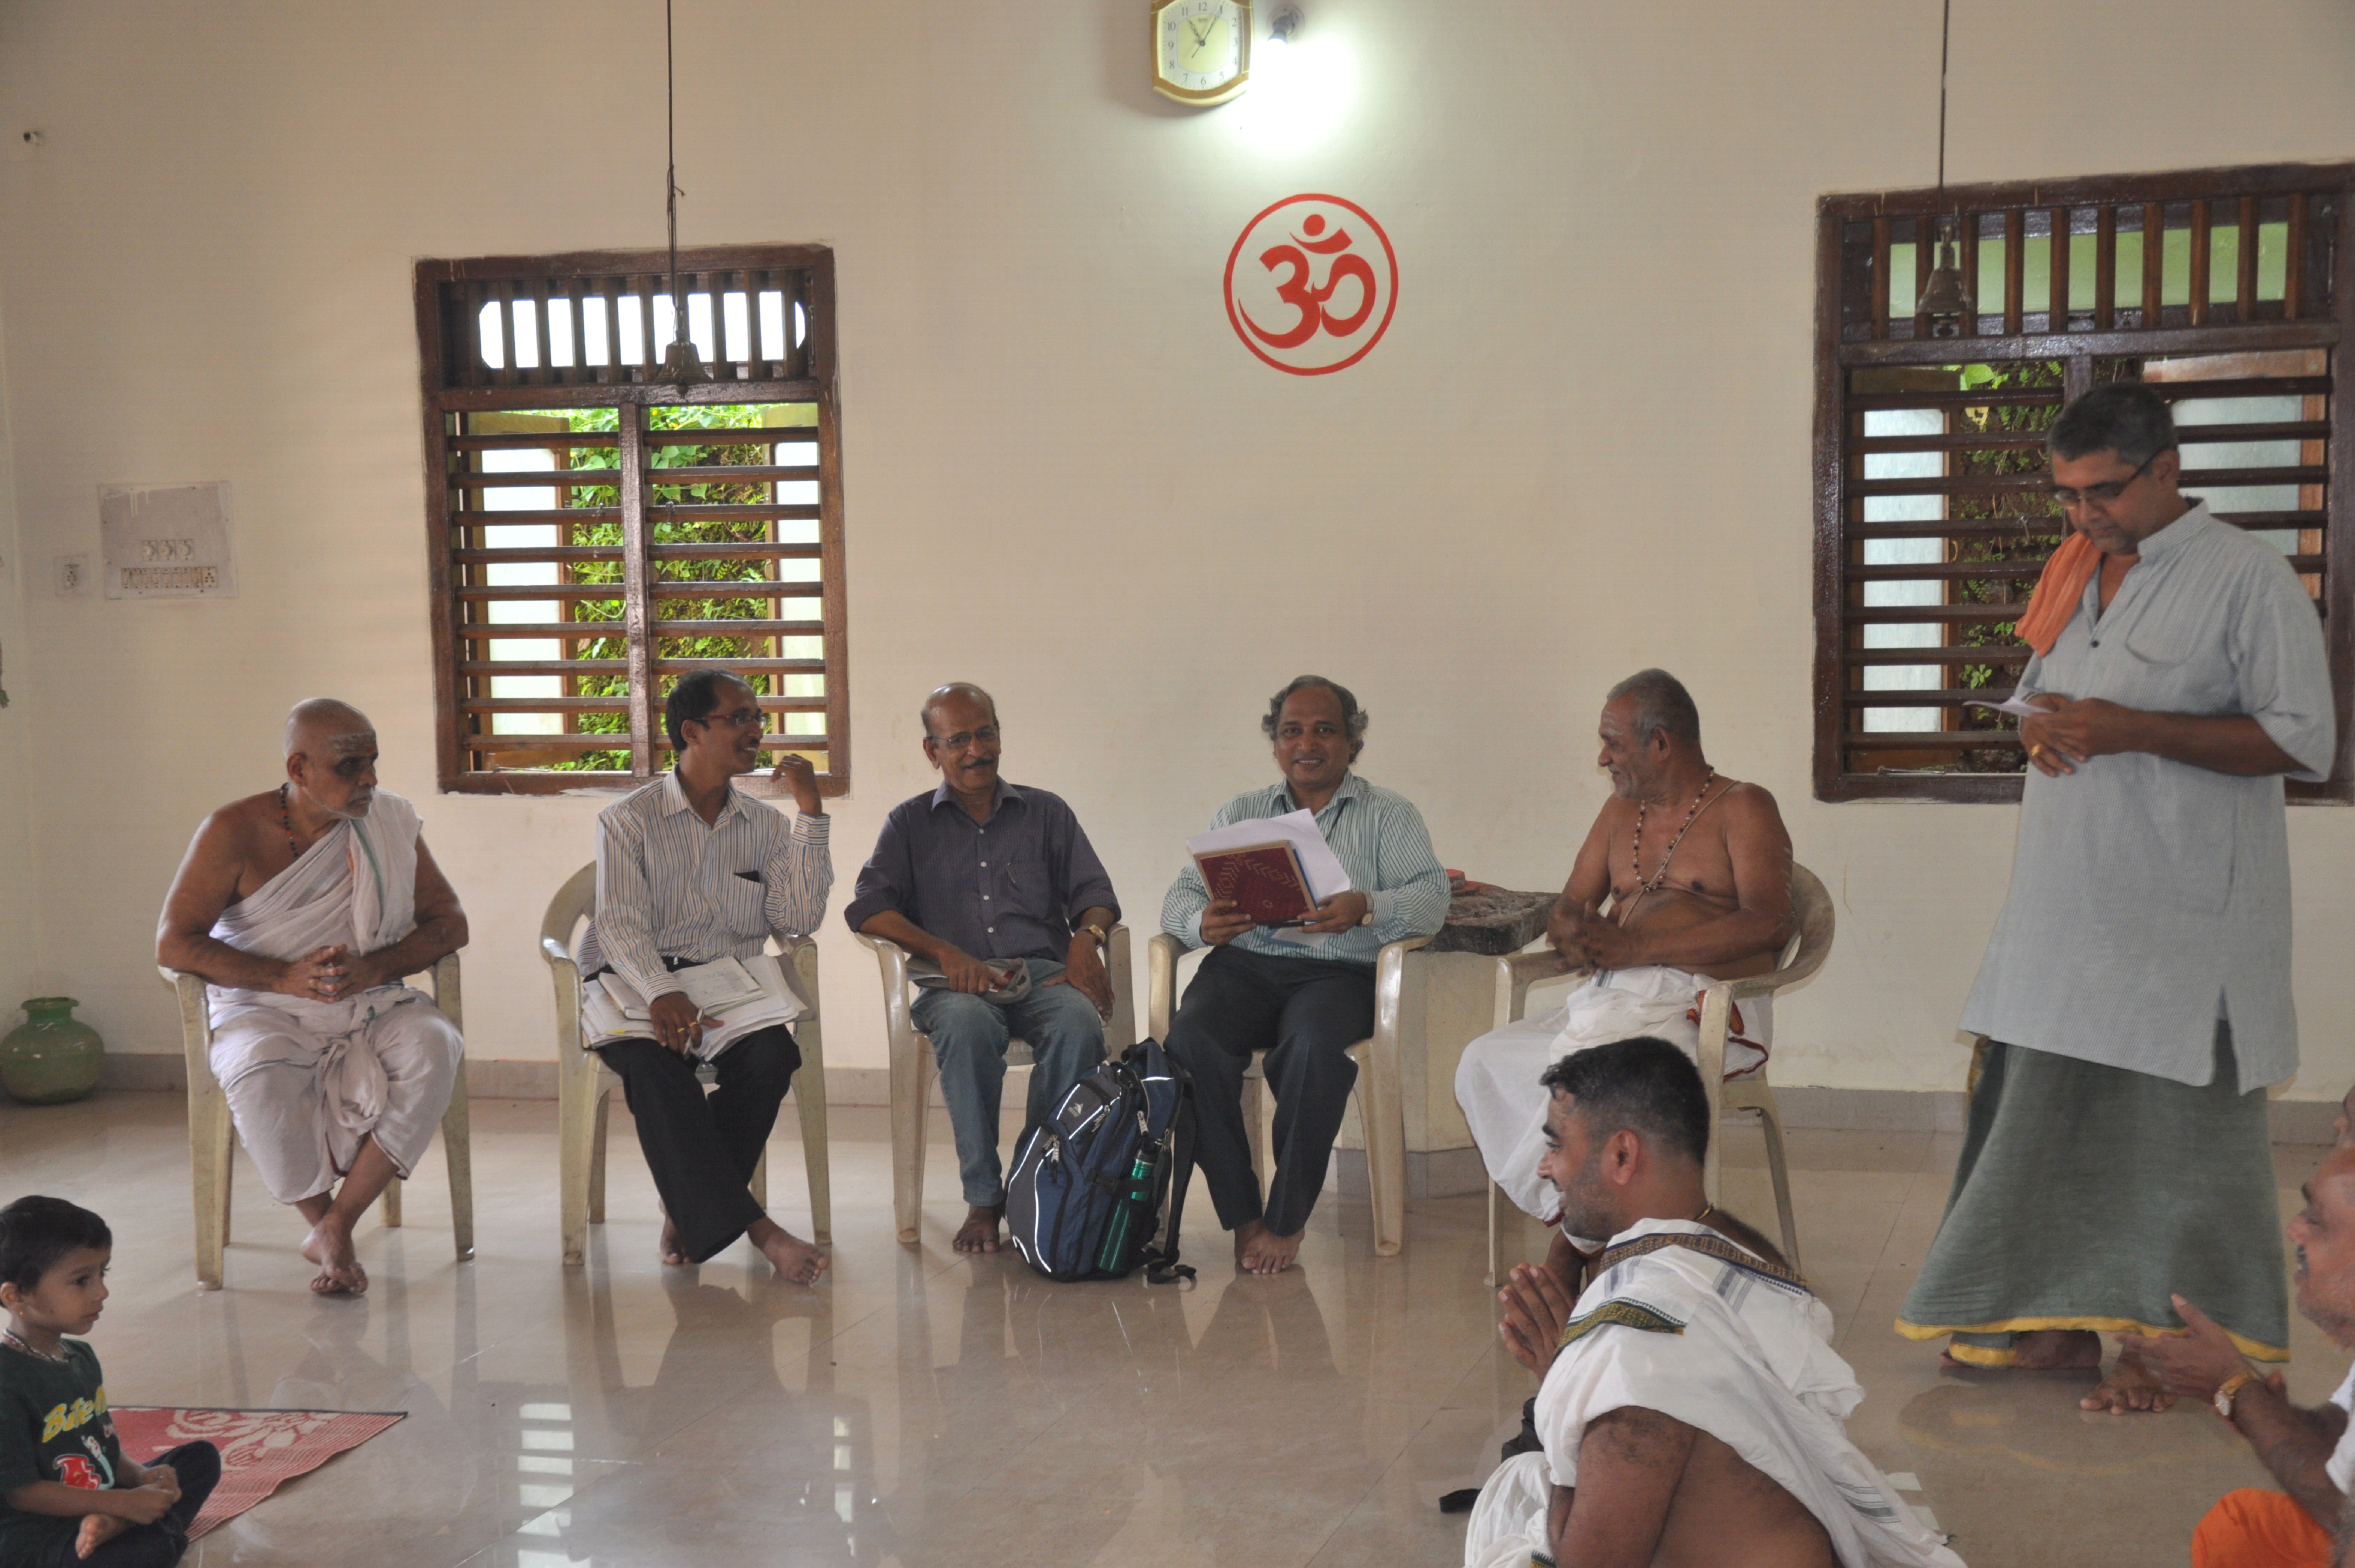
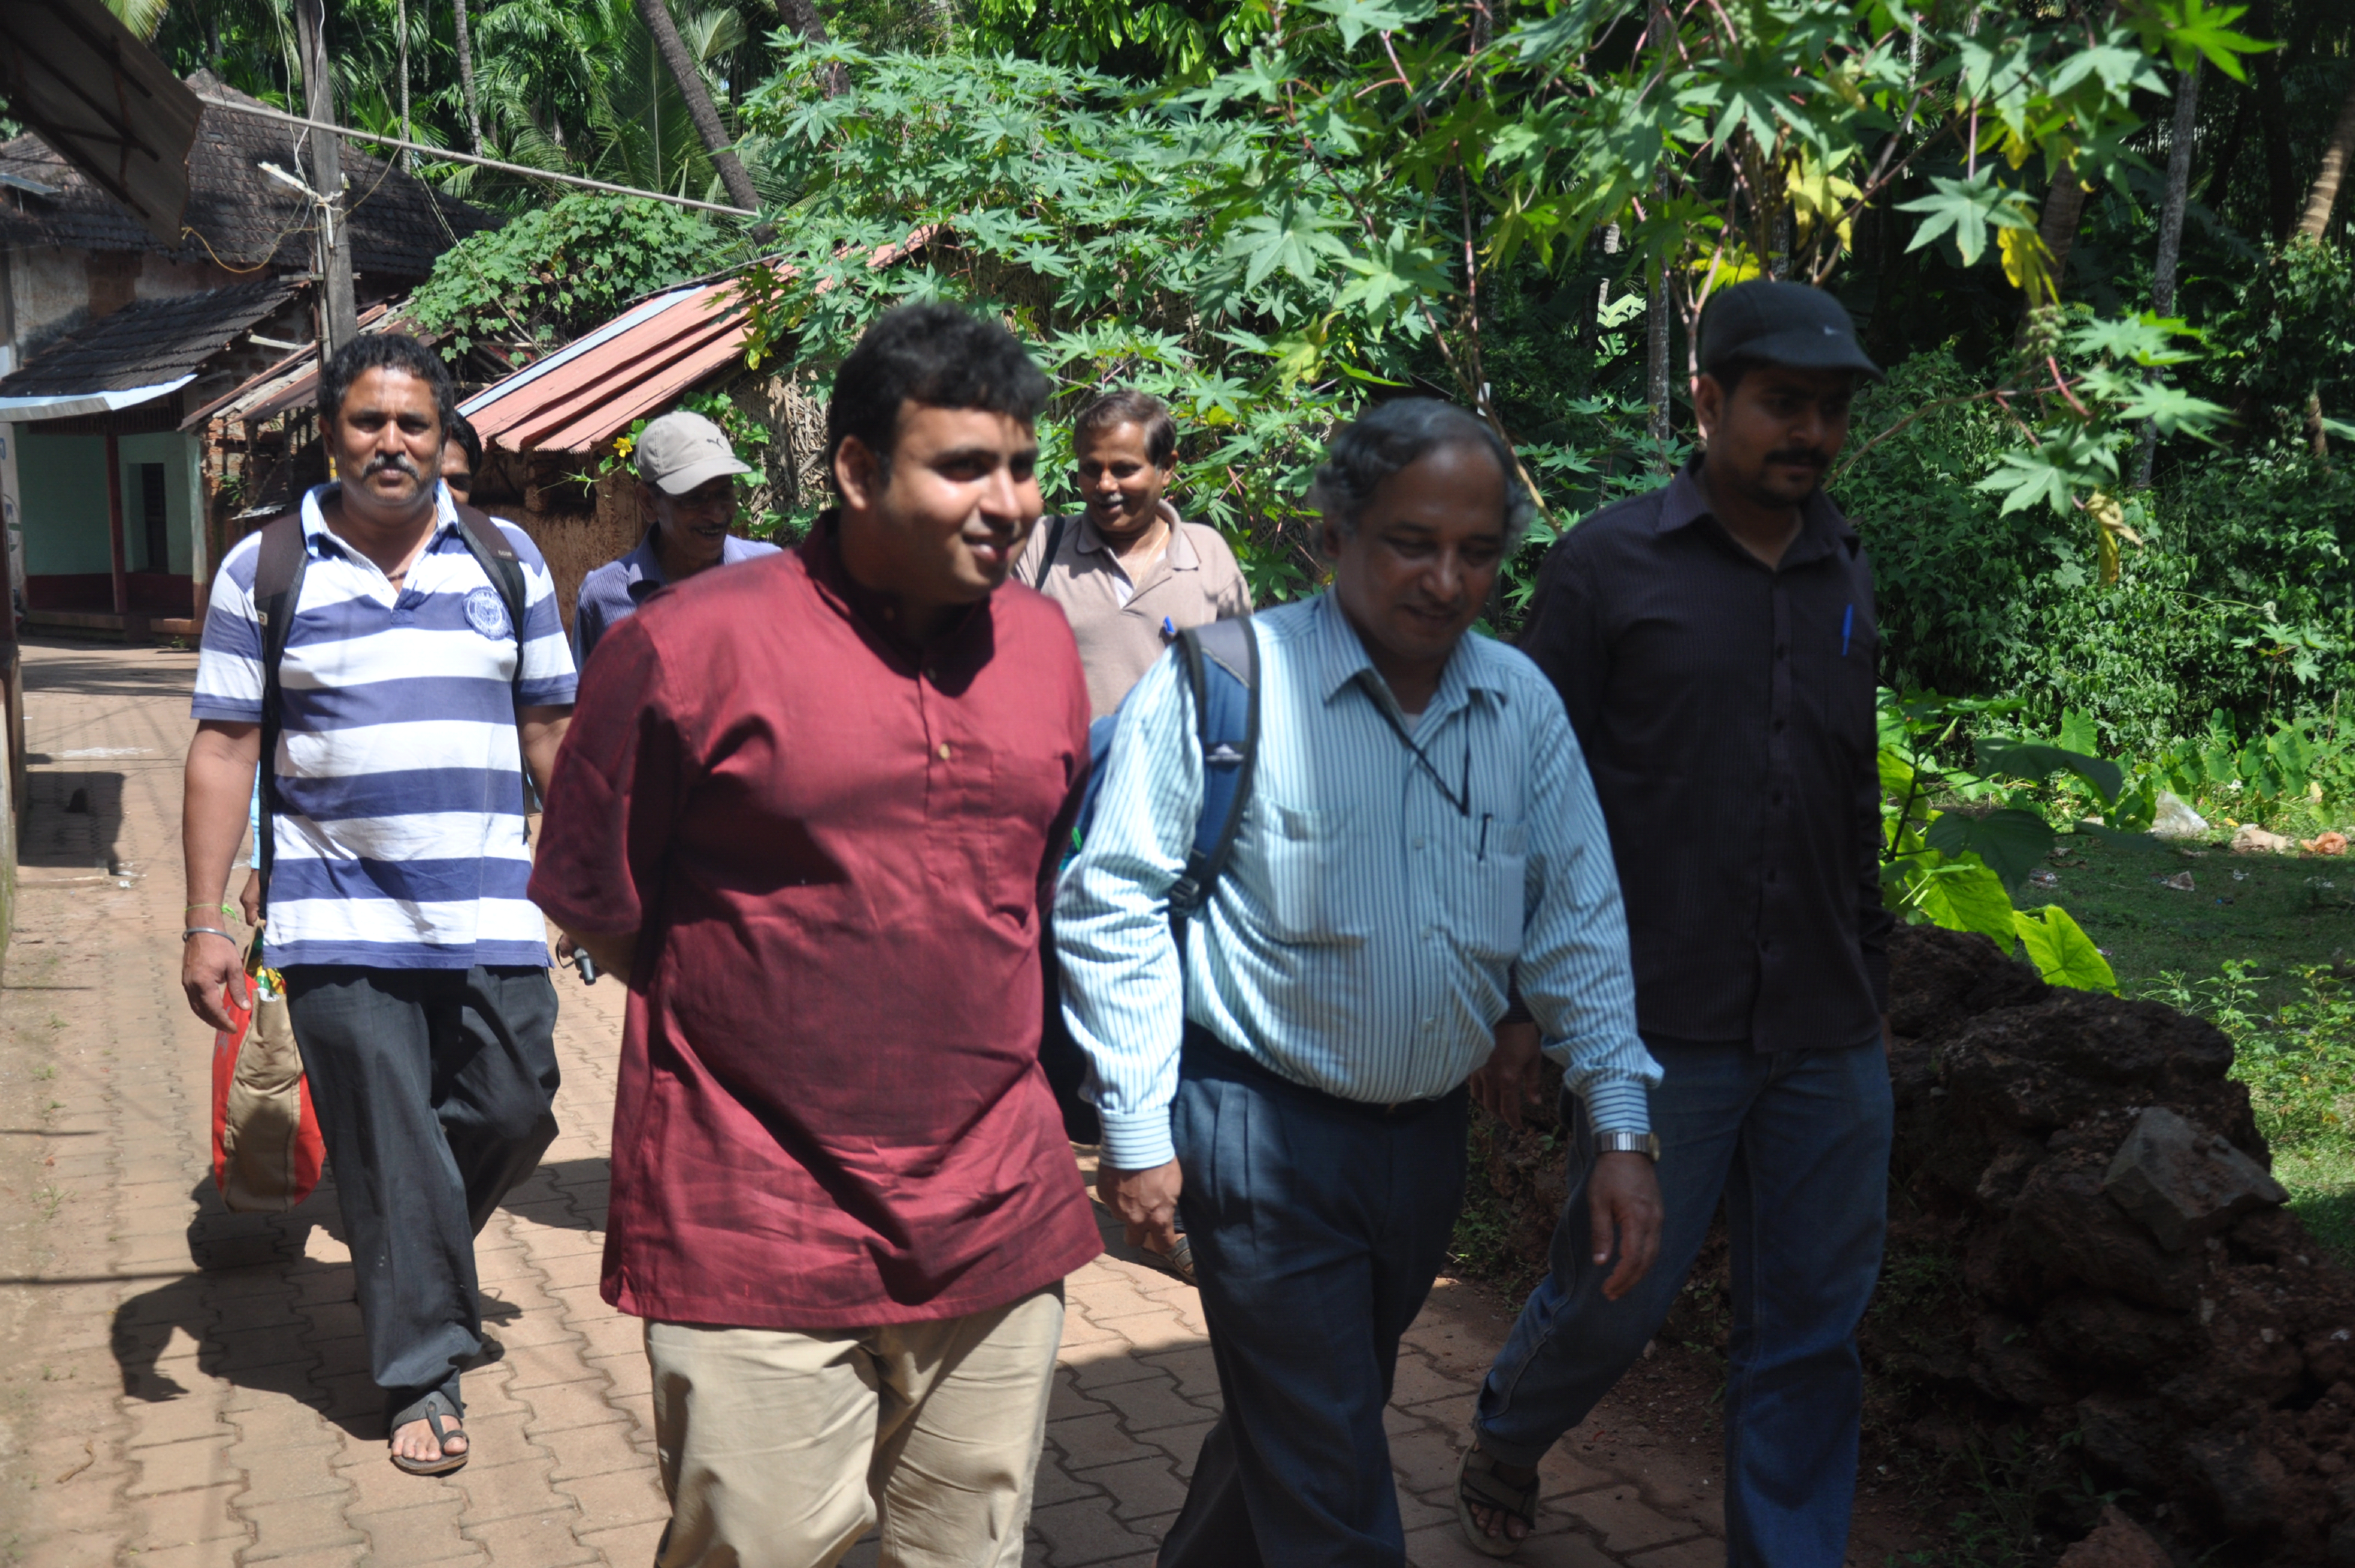
- Site survey and discussions with the local community
 |
 |
 |
 |
 |
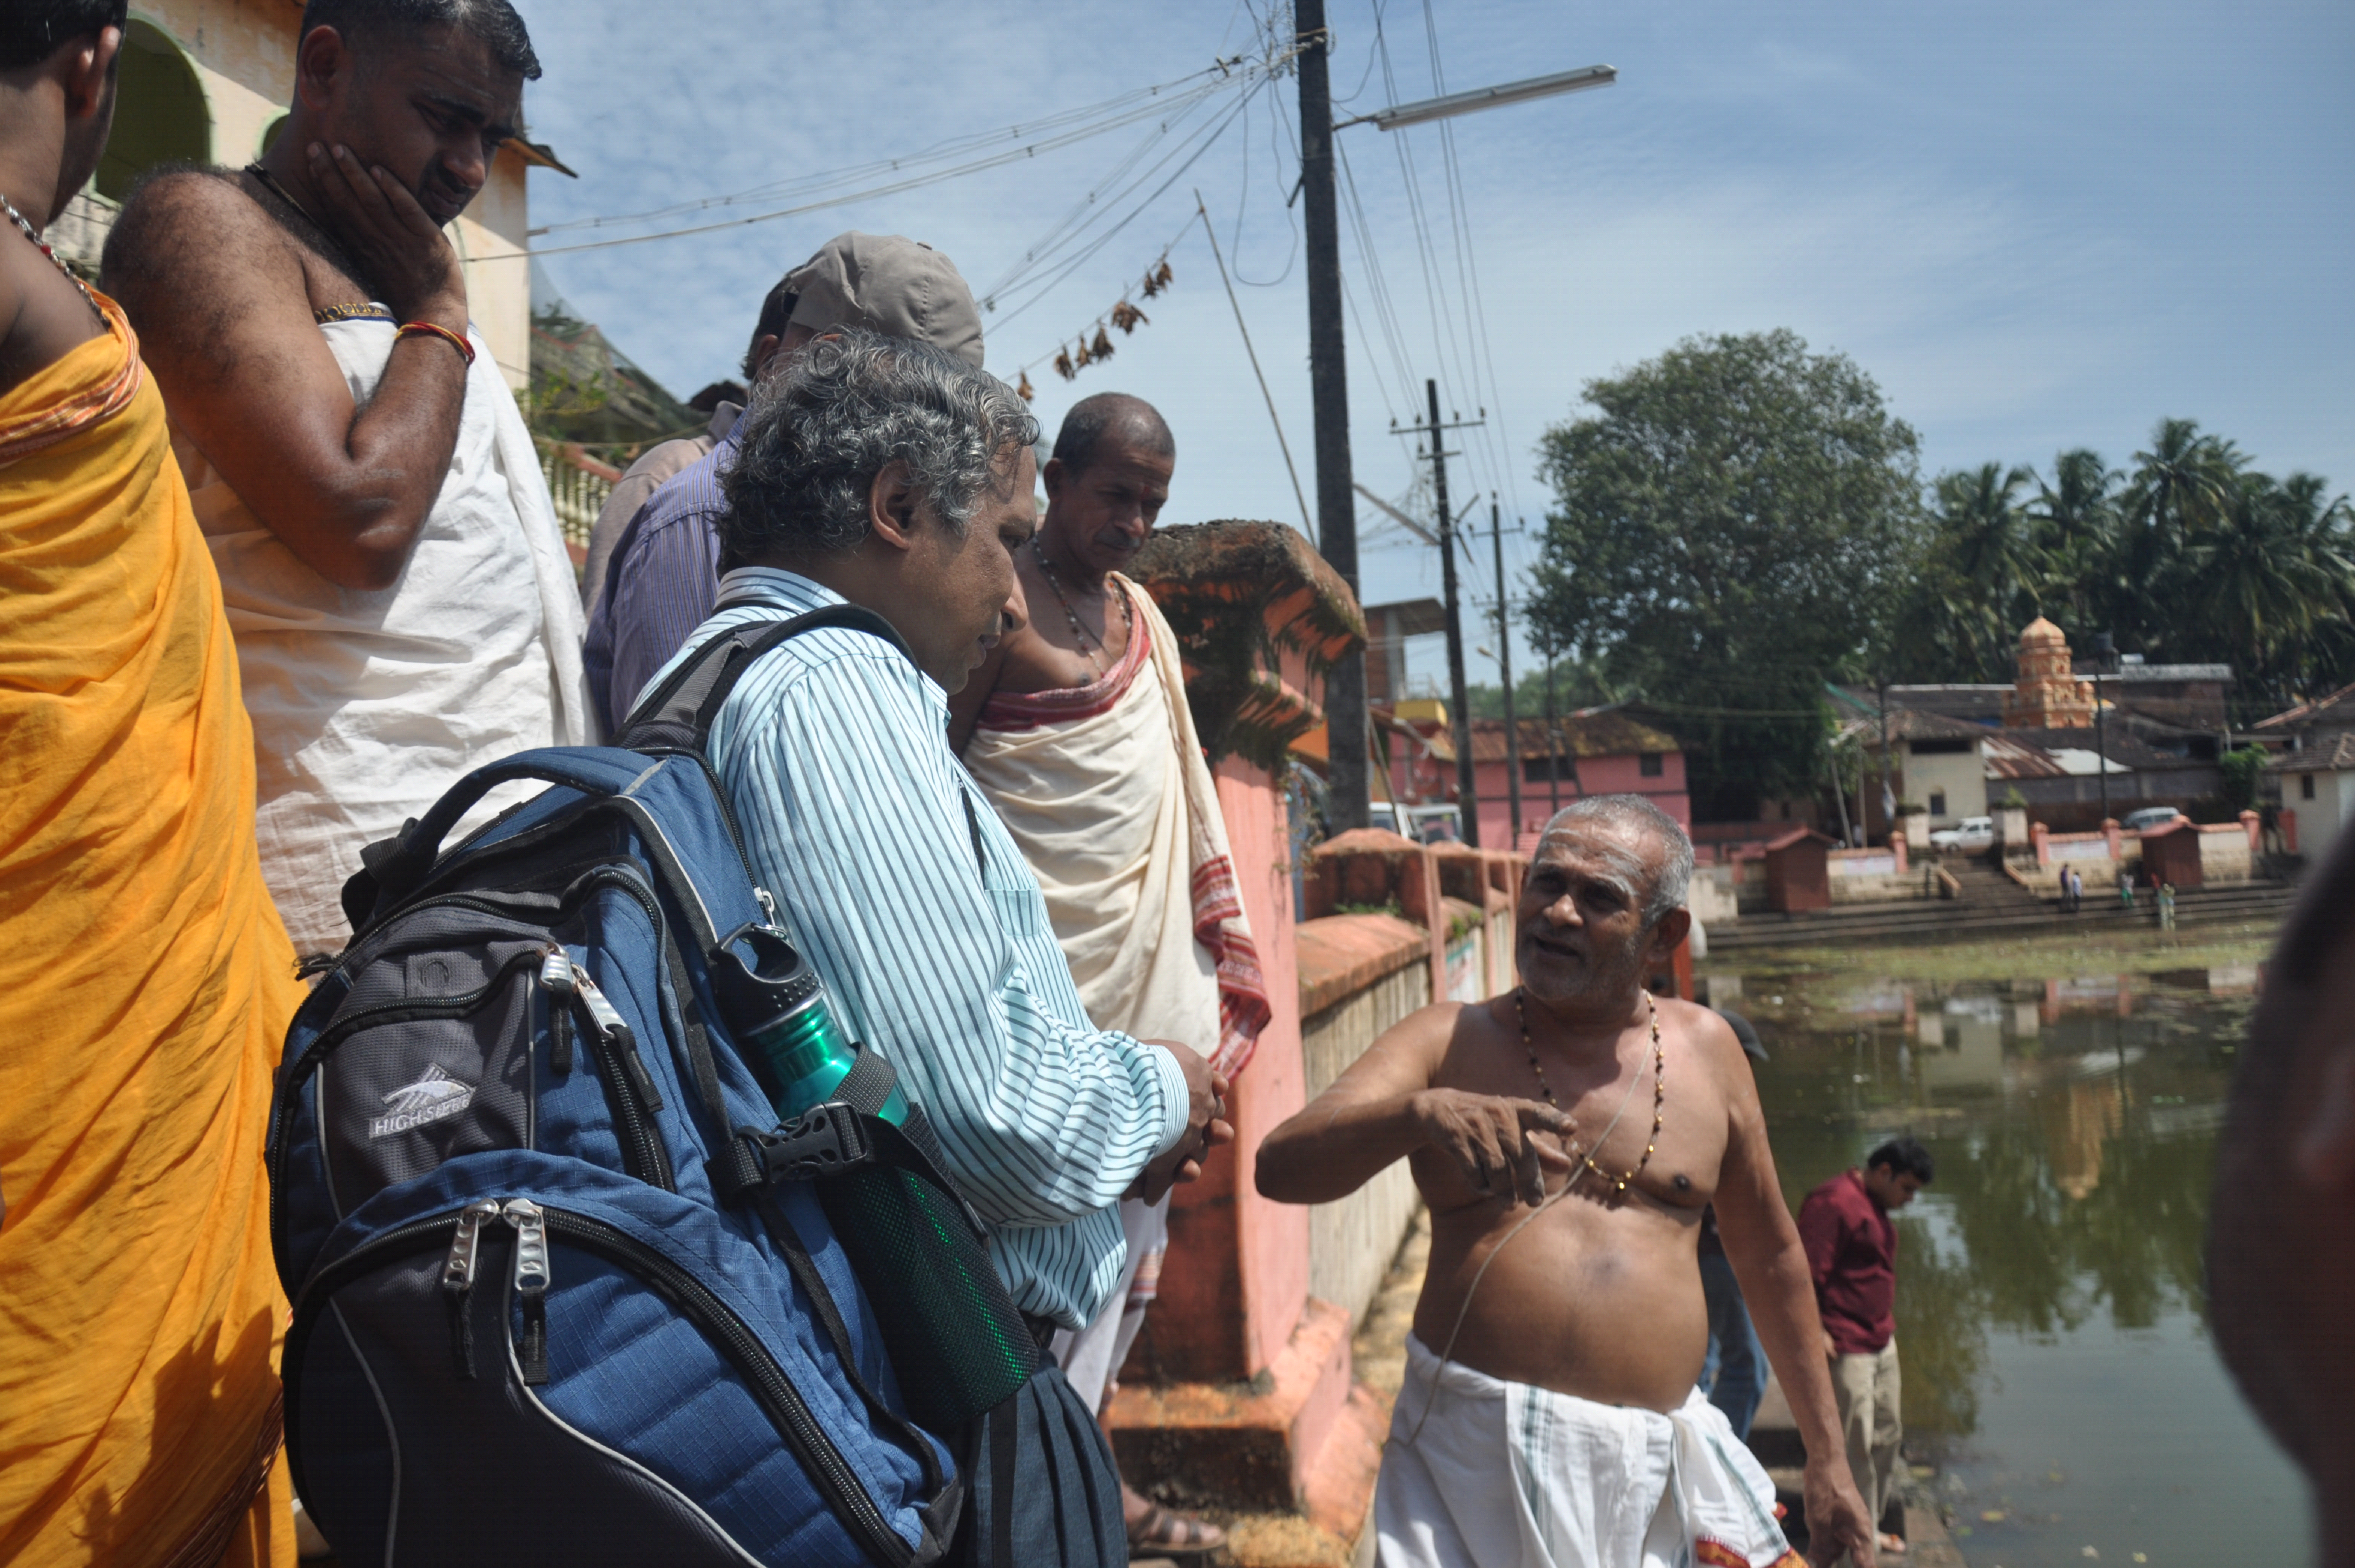 |
Figure 2.4. Site visits and discussions with the temple priest communities
Field investigations were carried out on 27th September 2015 in response to the requests by the local community and the information of foul odour and the proliferation of macro algae and macrophytes. The filed investigations included (i) assessment of the present status of the pond (Figure 2.4 and 2.5), (ii) water sample collections from various locations (inlet and outlet) of the pond, (iii) collection of biotic components macrophytes and algae, (iv) assessment of the spread and diversity of biotic components and (v) discussion with the local community to understand (a) causal factors of water quality changes and (b) the social perspective of the pond.
-
-
Water sampling and analysis
Water samples were collected from the pond at three representative locations based on depth and also extent of organic debris in the pond (Figure 2.5).
Hand held GPS was used for recording the geographical coordinates of sampling locations and also to map the boundary of the pond. Field investigations were carried out to find out the status of the pond and also the sources of contamination (if any). Water samples were collected in disinfected one litre sampling bottles. These bottles were thoroughly washed and rinsed with deionised water. Grab sampling was followed at all points. On-site estimation parameters include pH (pH probe), water temperature (temperature probe), Total Dissolved Solids (TDS) (TDS probe), salinity (salinity probe), conductivity (conductivity probe), dissolved oxygen (iodometry), Oxidation Reduction Potential (ORP) and transparency (visual observations). The samples were then carried to the lab and were analysed for other parameters according to Standard protocol (APHA AWWA WEF, 2000). Water samples were analysed for turbidity (turbidometer), total alkalinity (titrimetry), total hardness, Ca, Mg (complexometric titration), Na, K (flame photometer), chlorides (argentometric method), nitrates (phenol disulphonic acid method), phosphates (stannous chloride method), chemical oxygen demand (dichromate oxidation with open reflux) and BOD (5-d BOD).
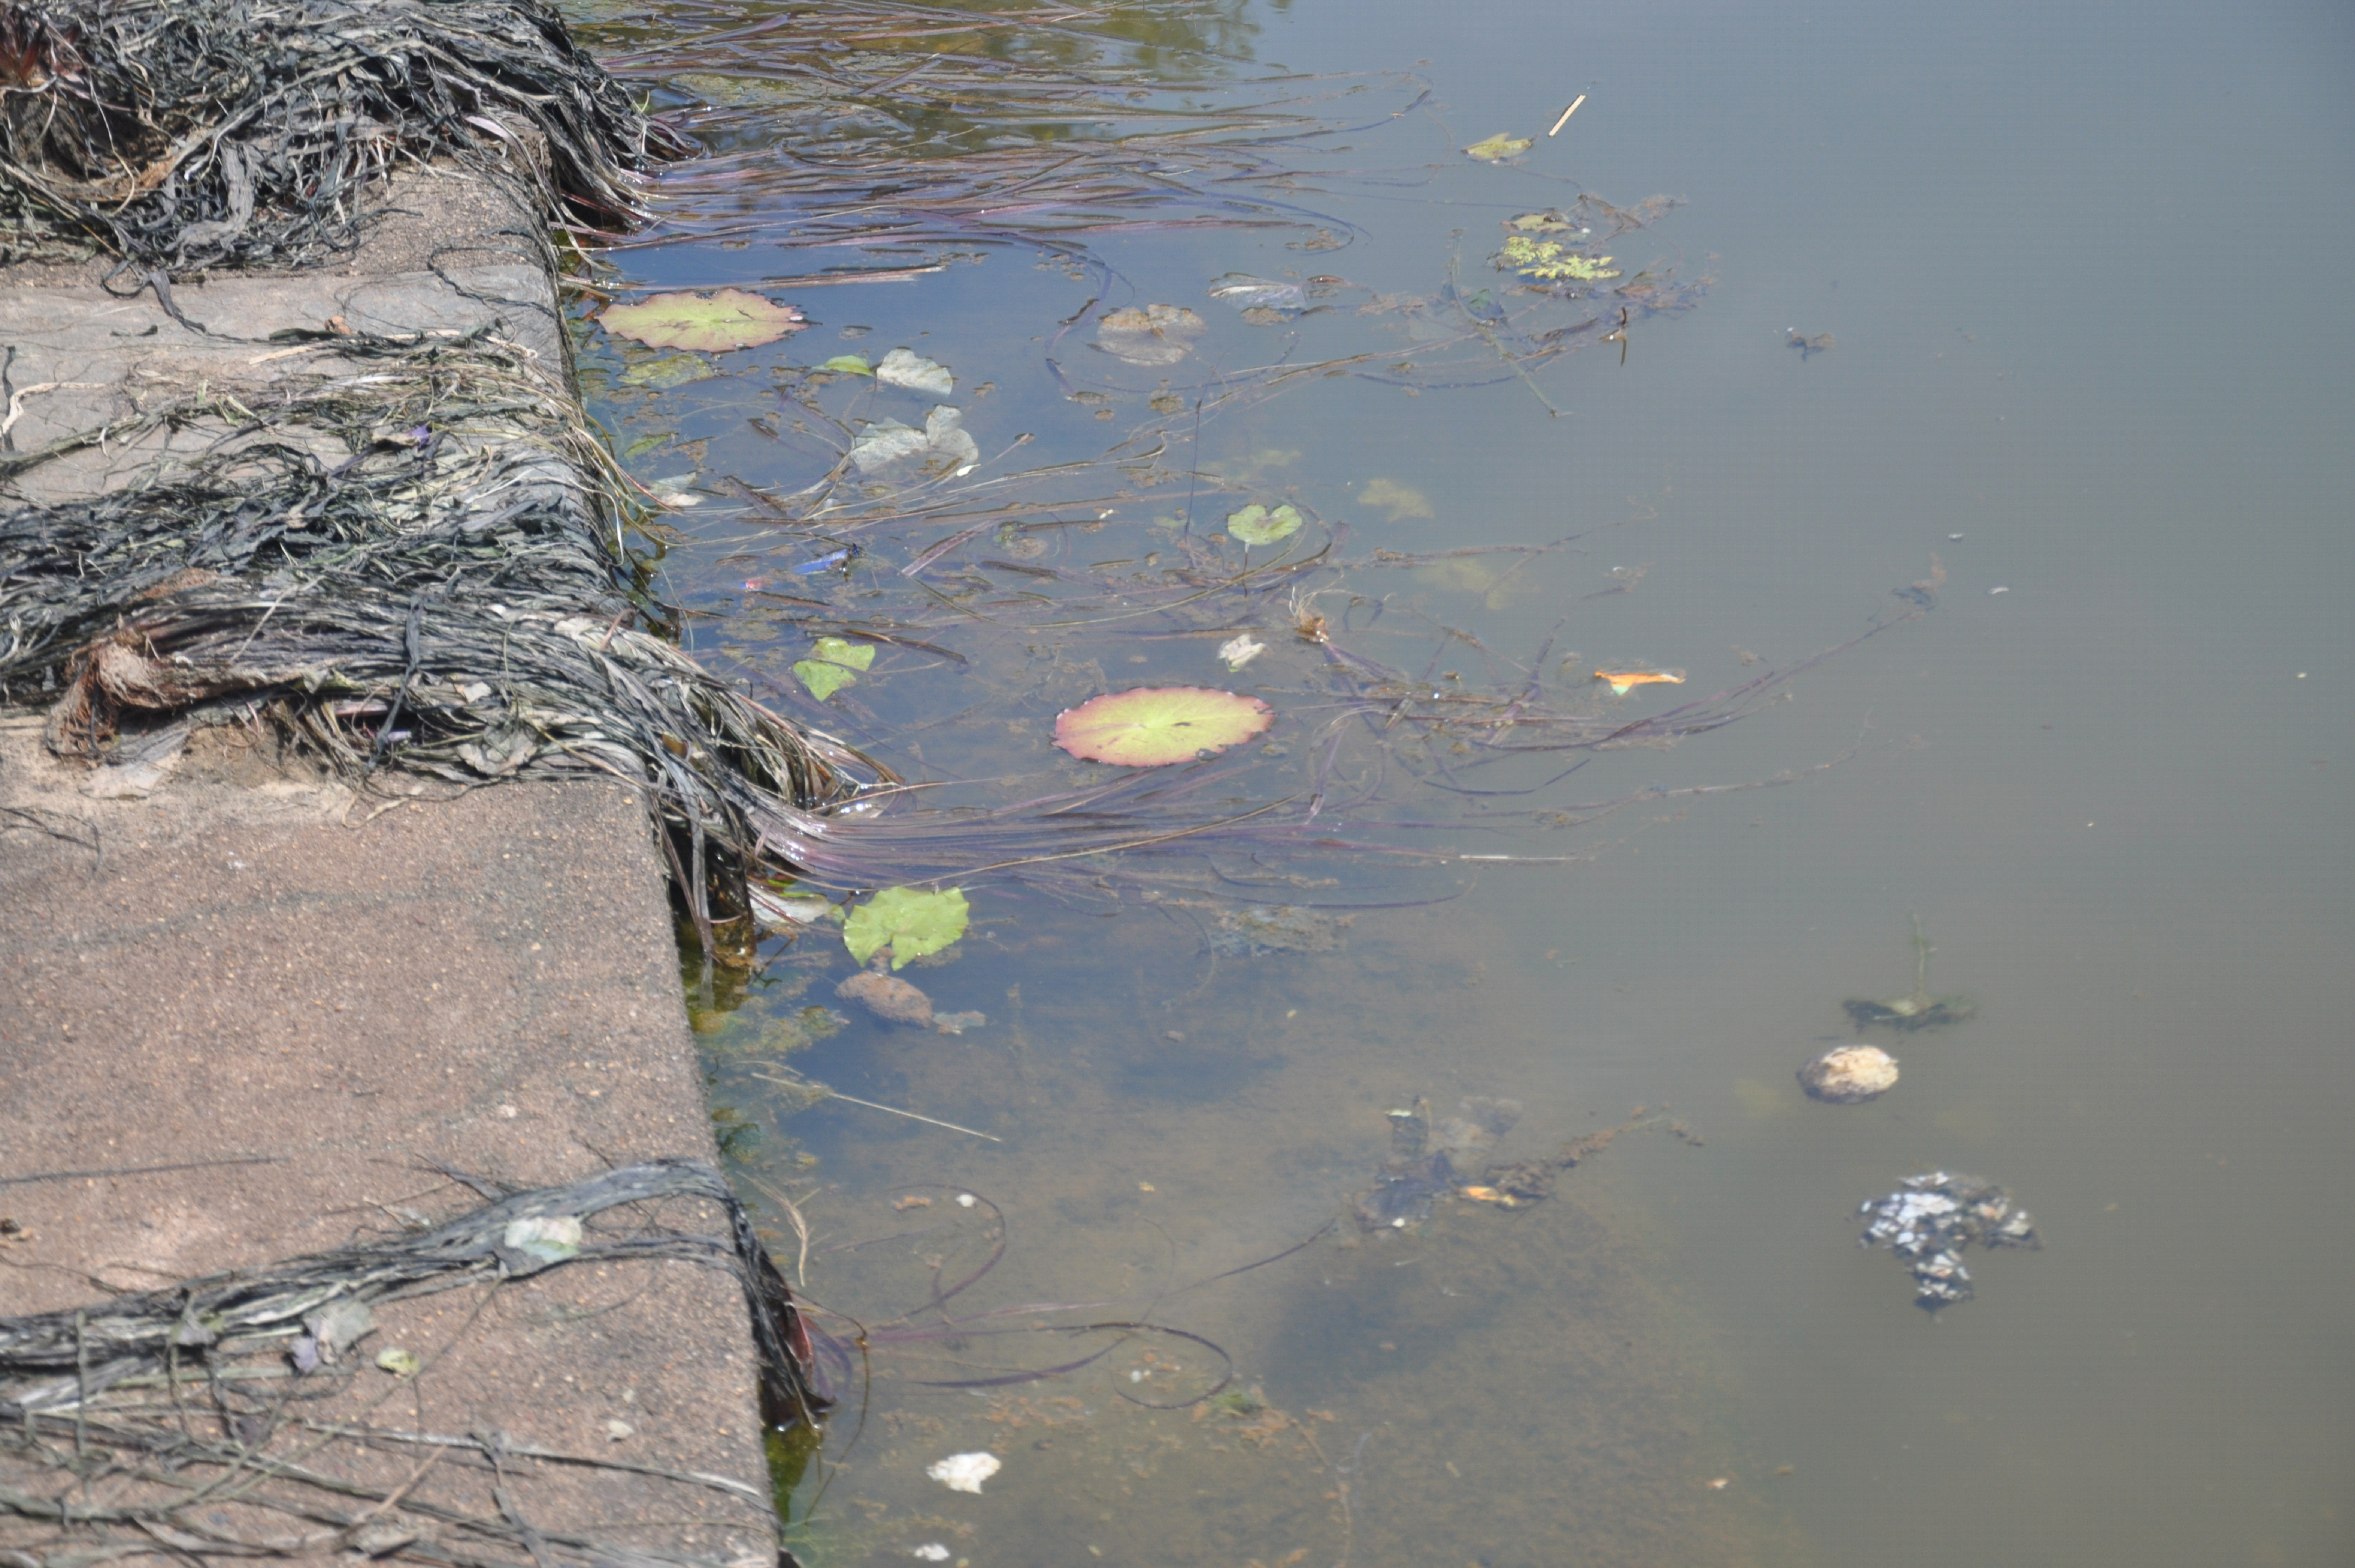
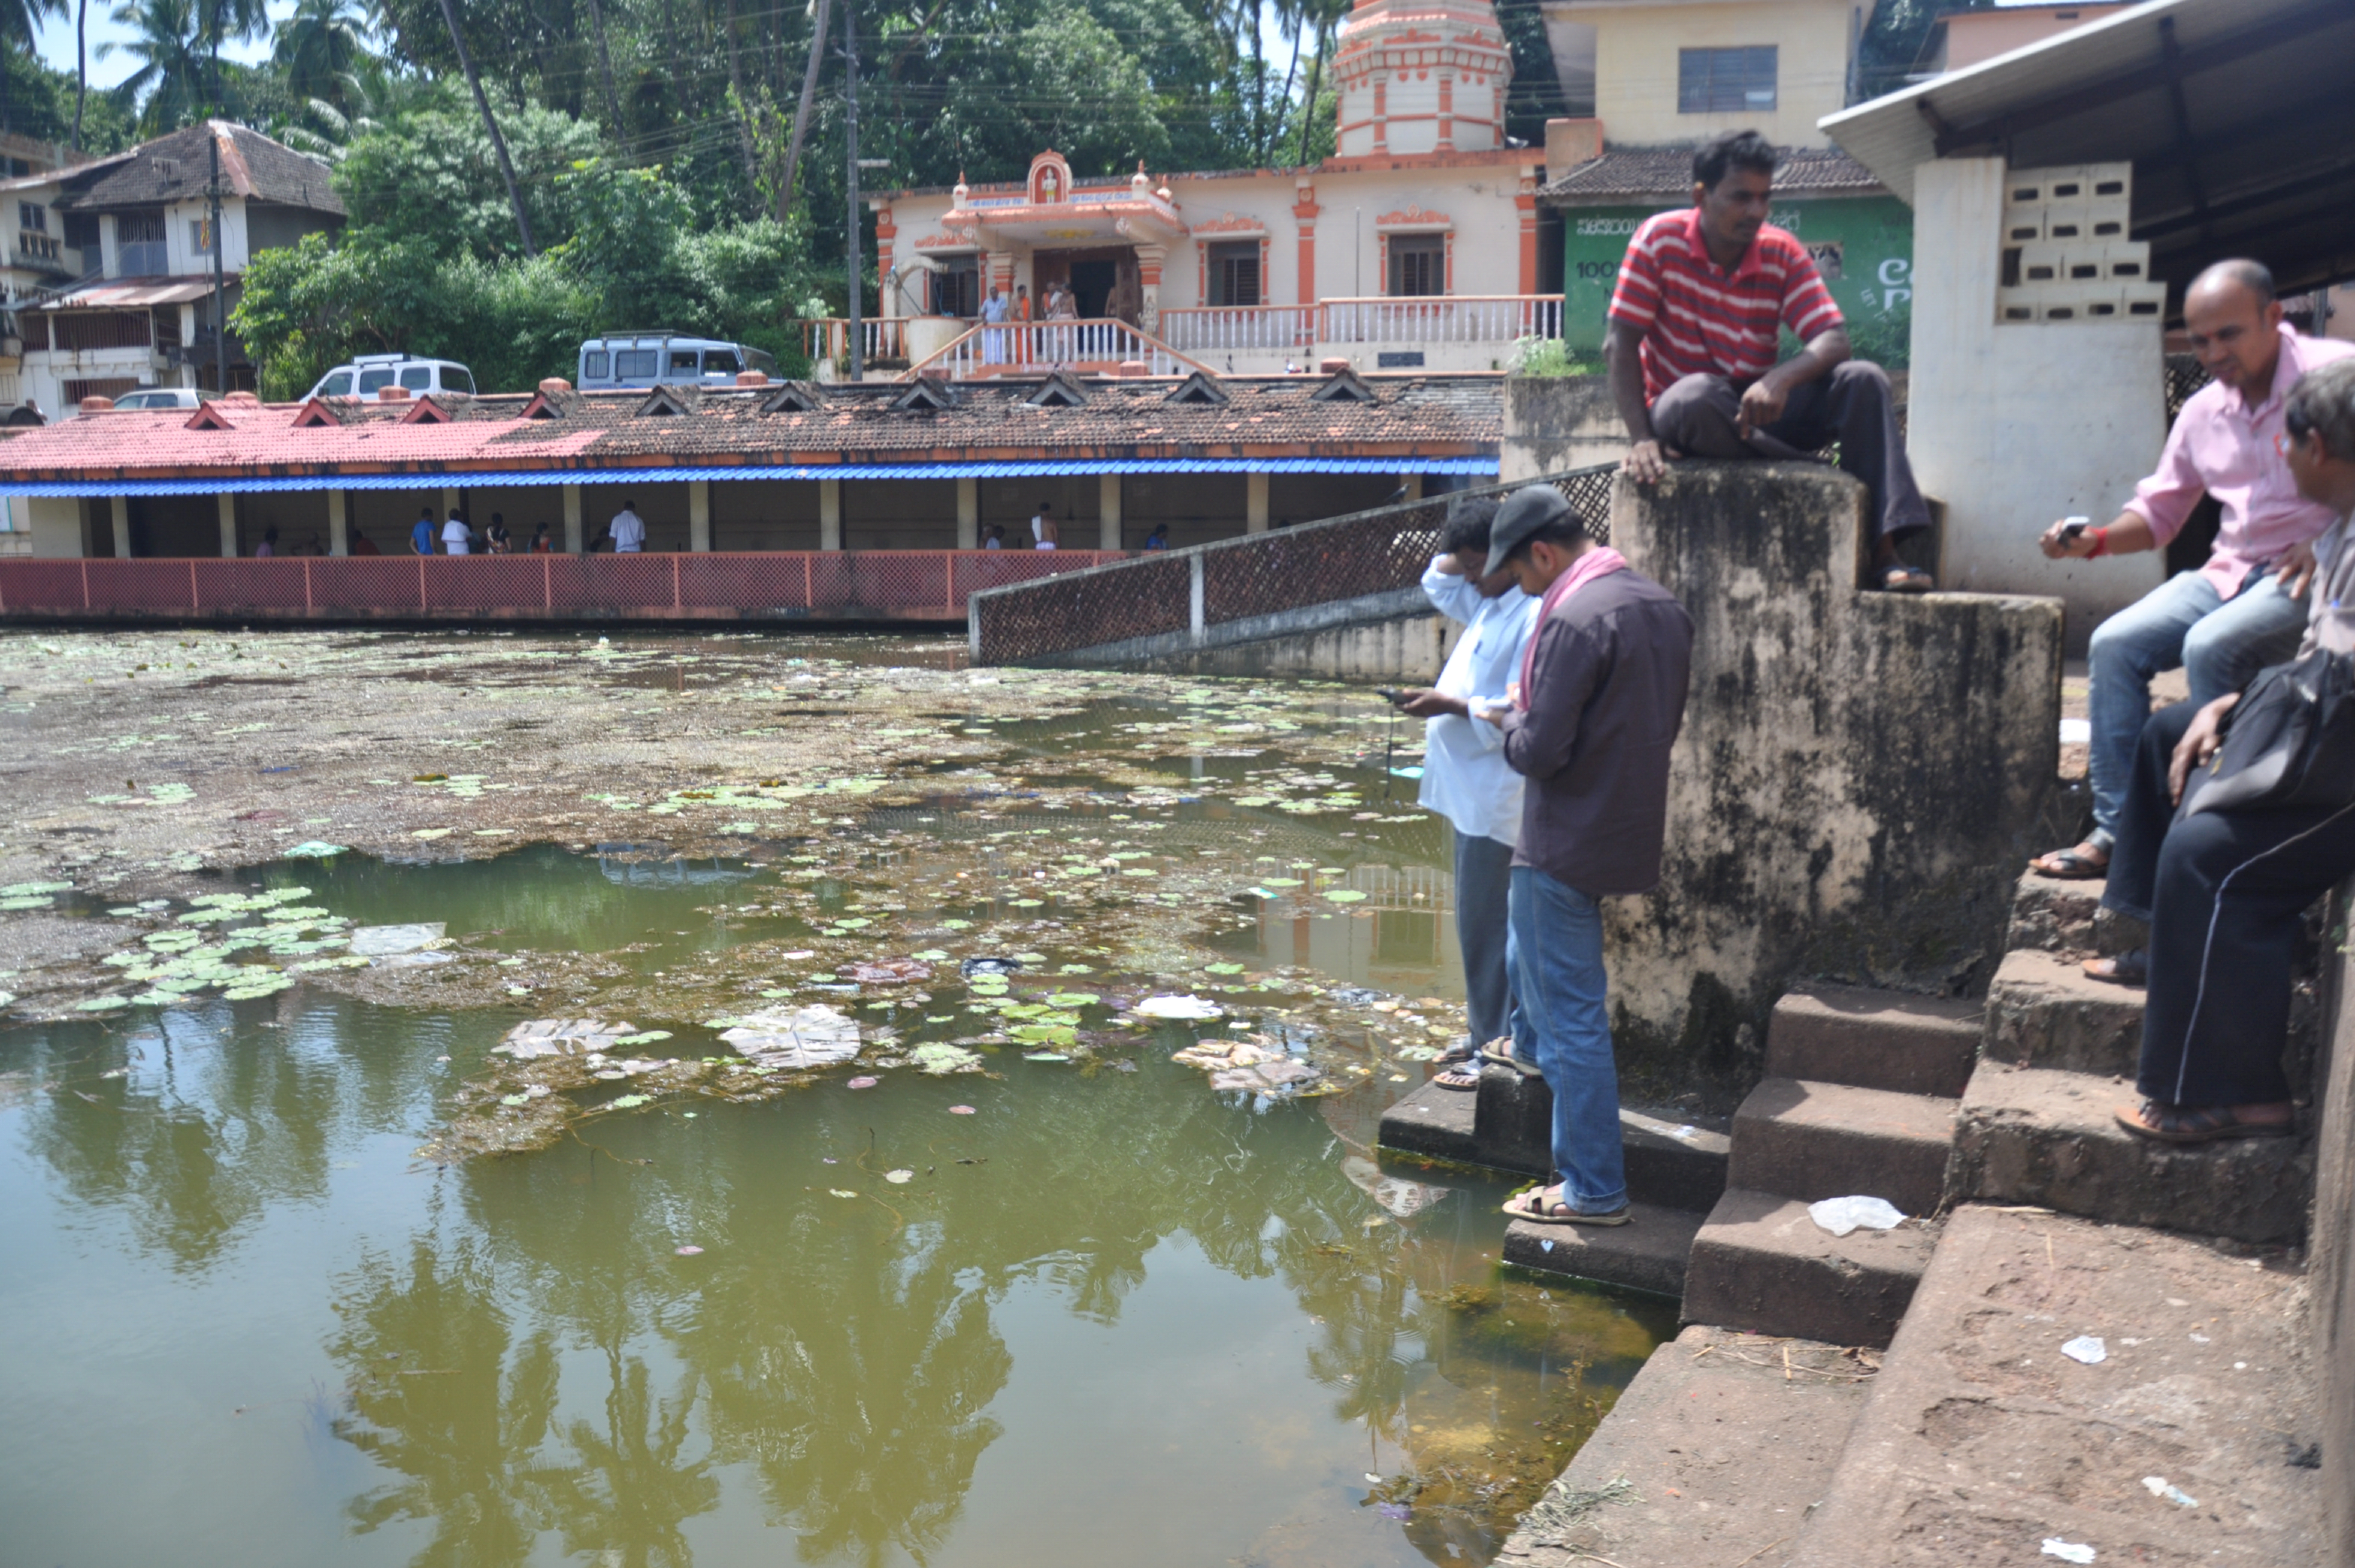
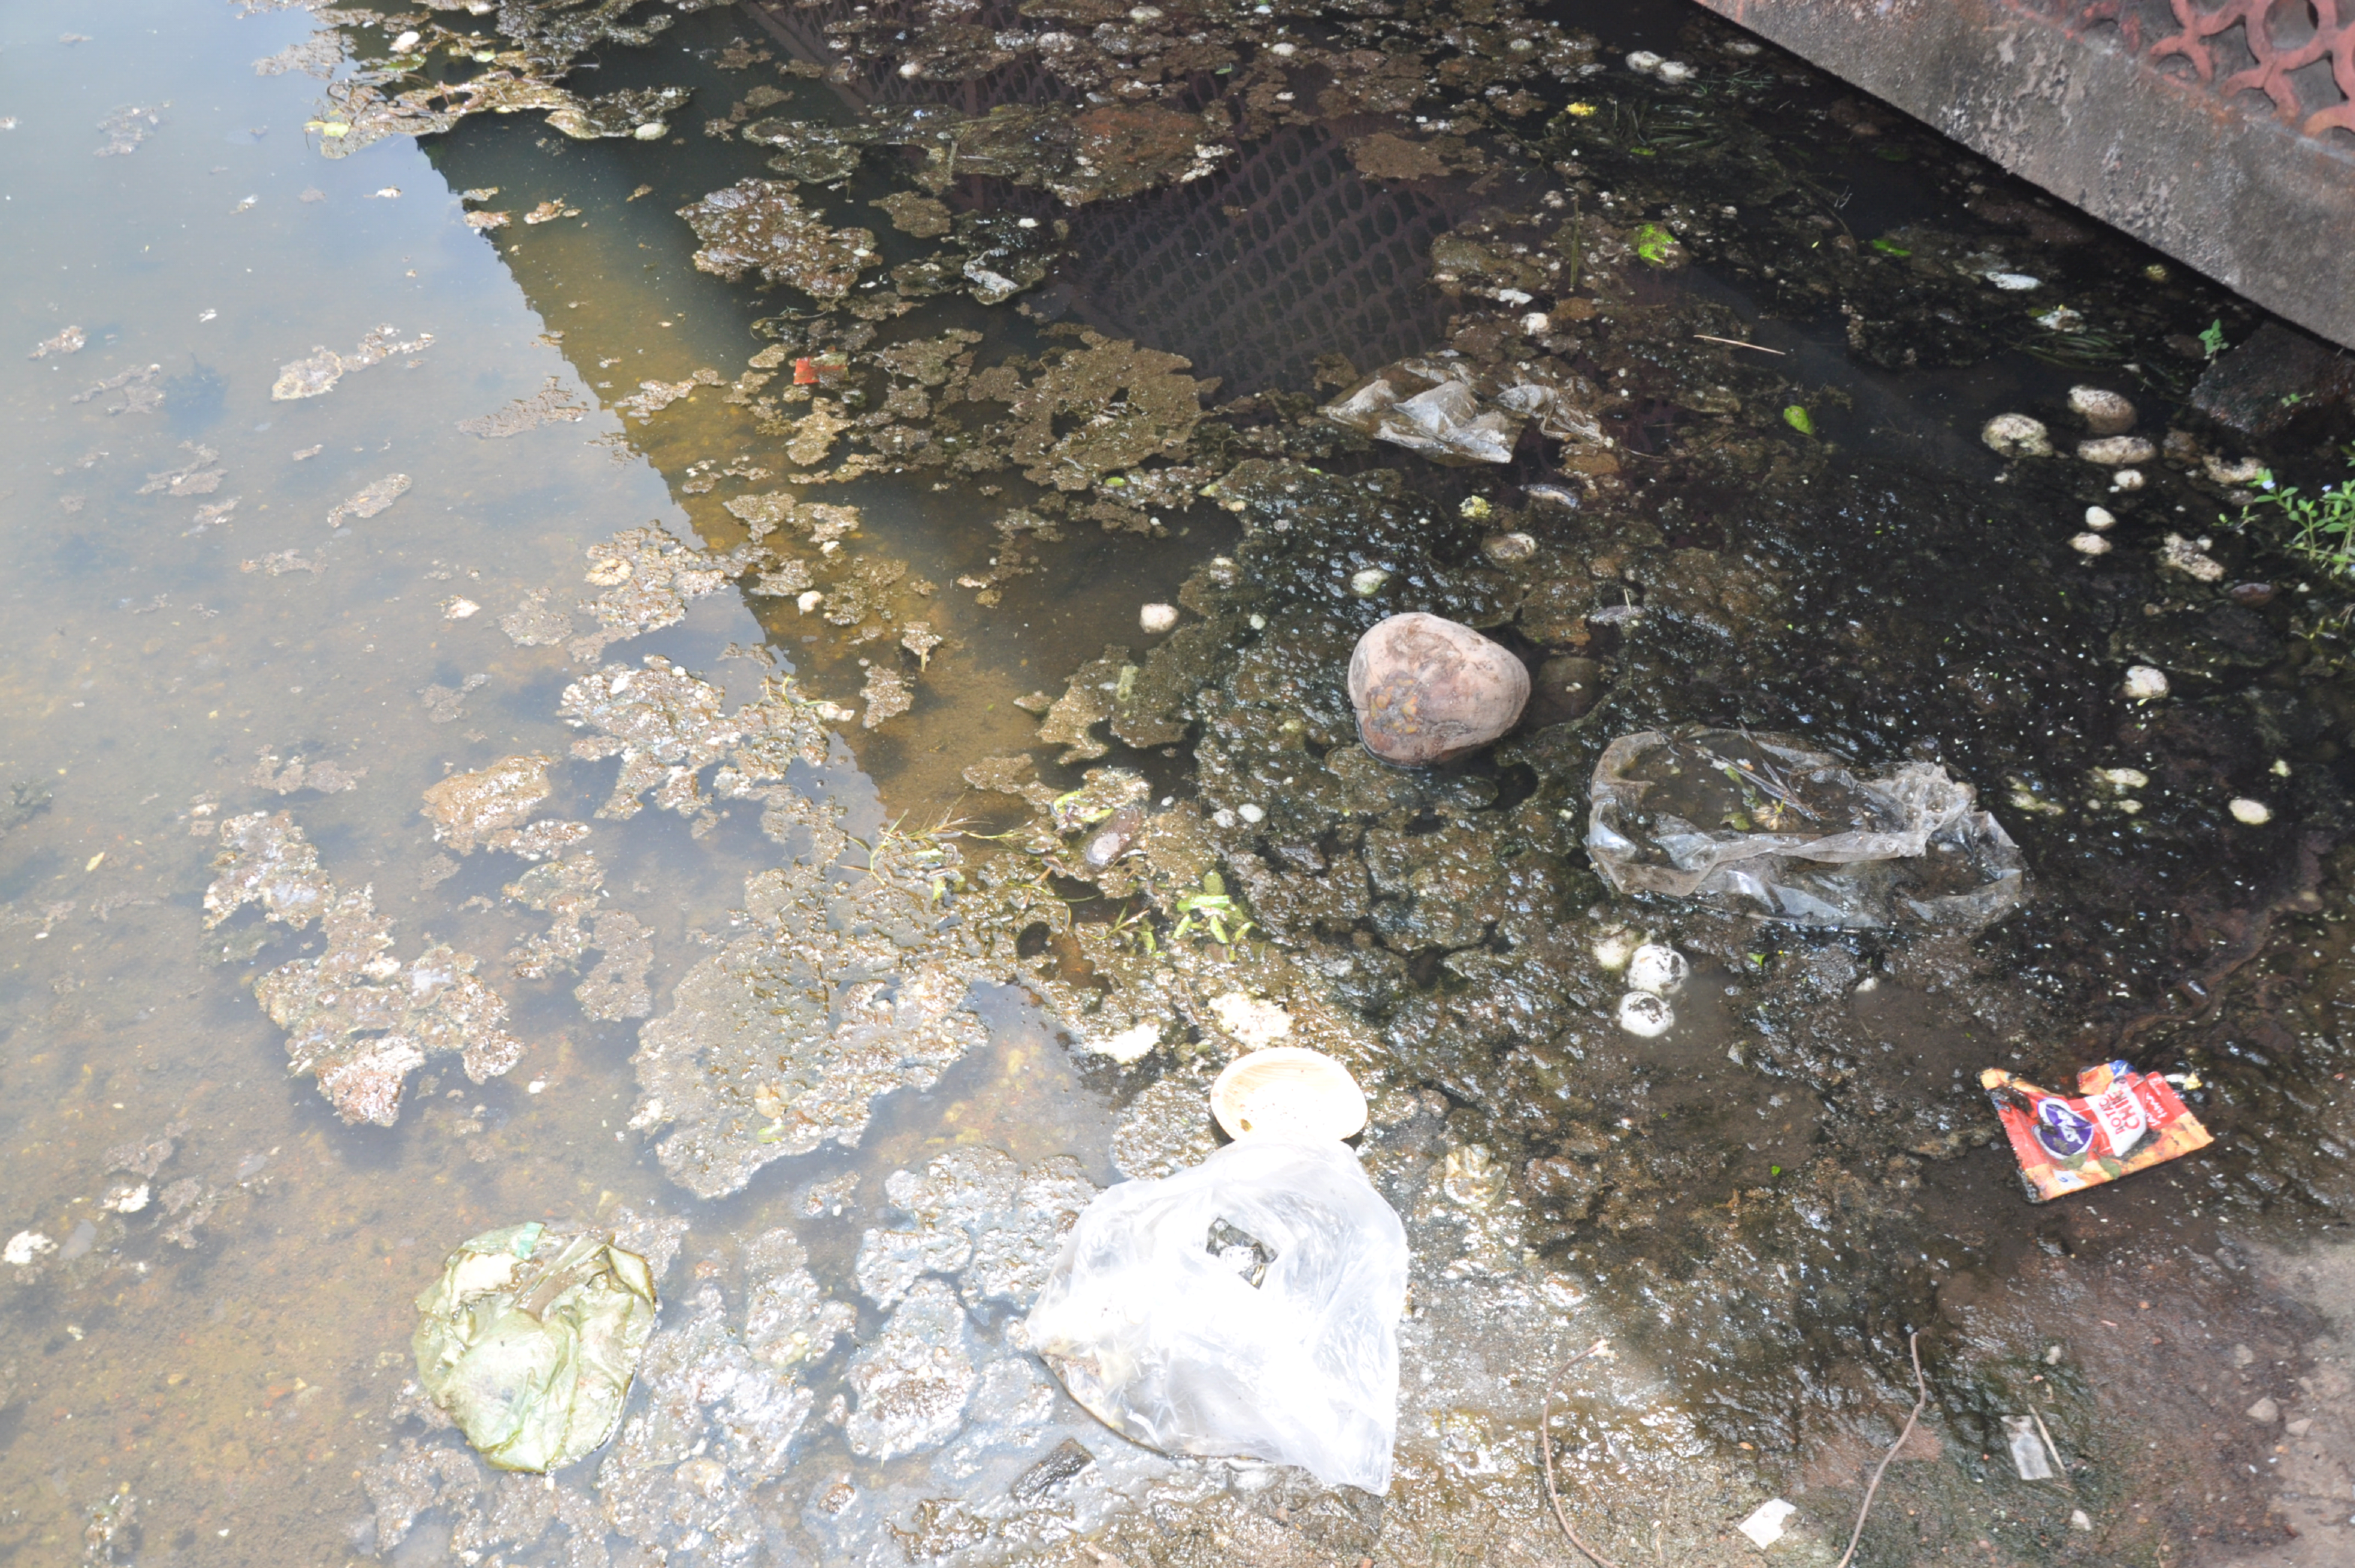
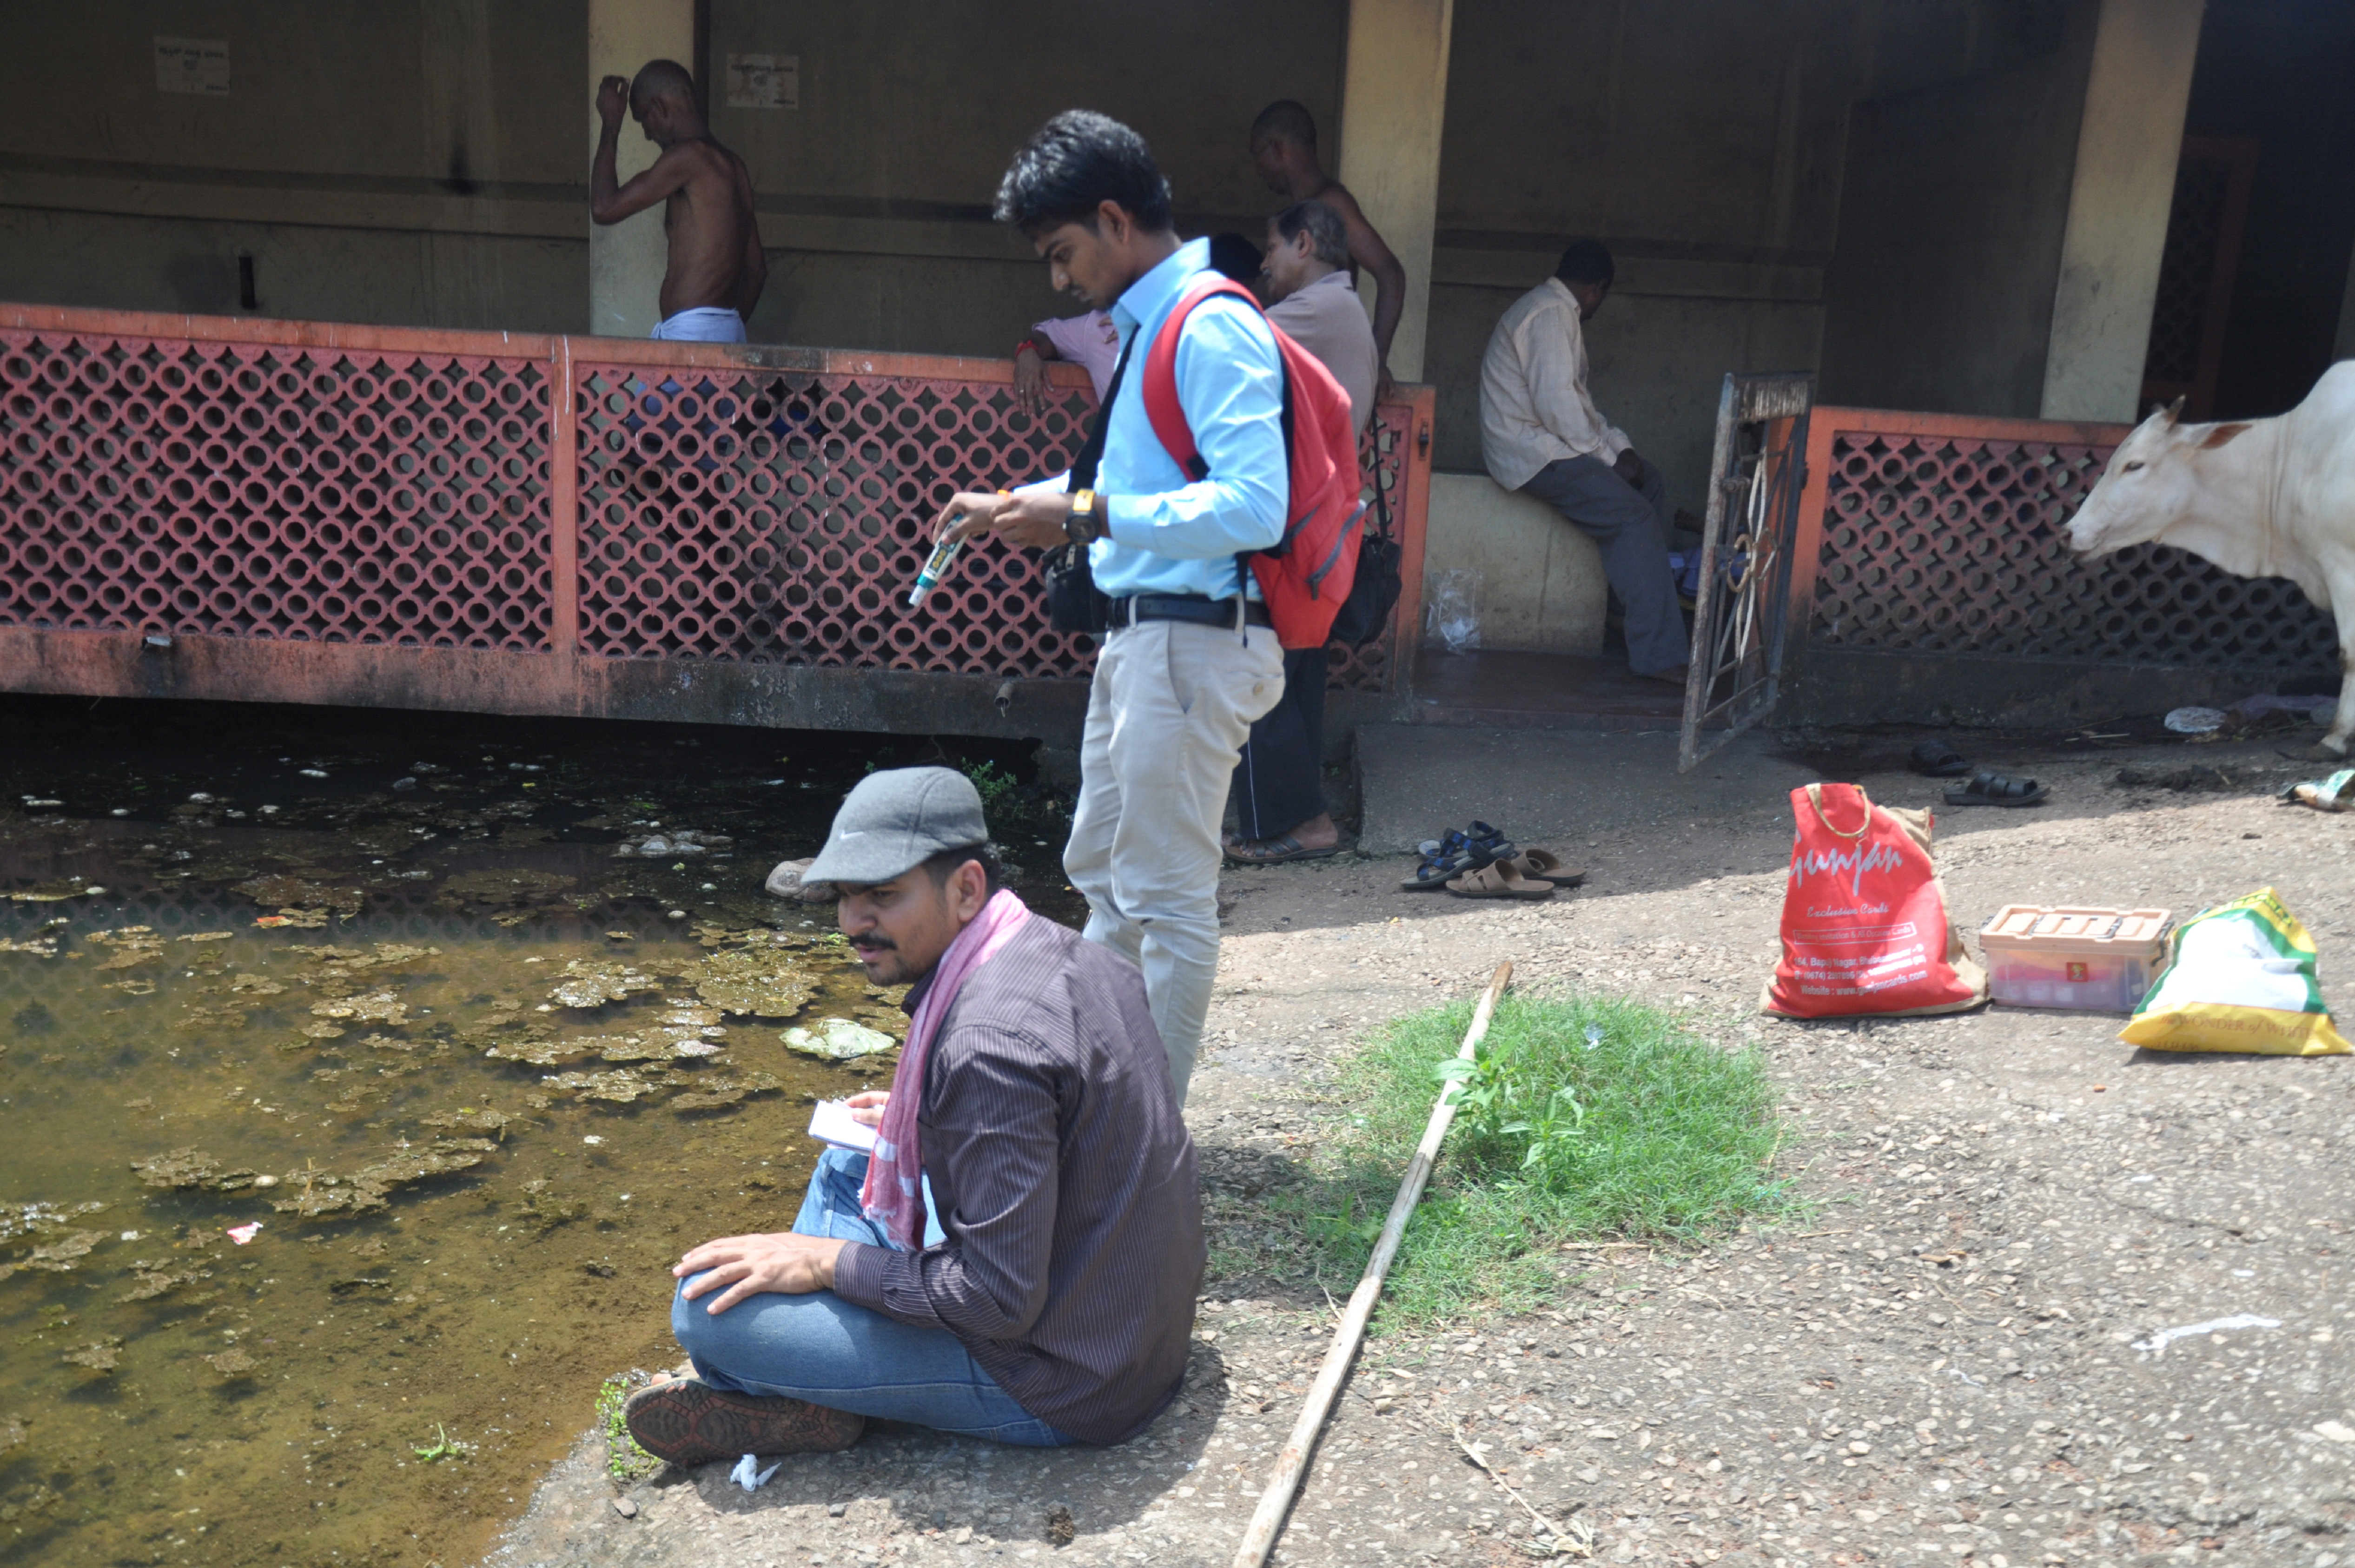
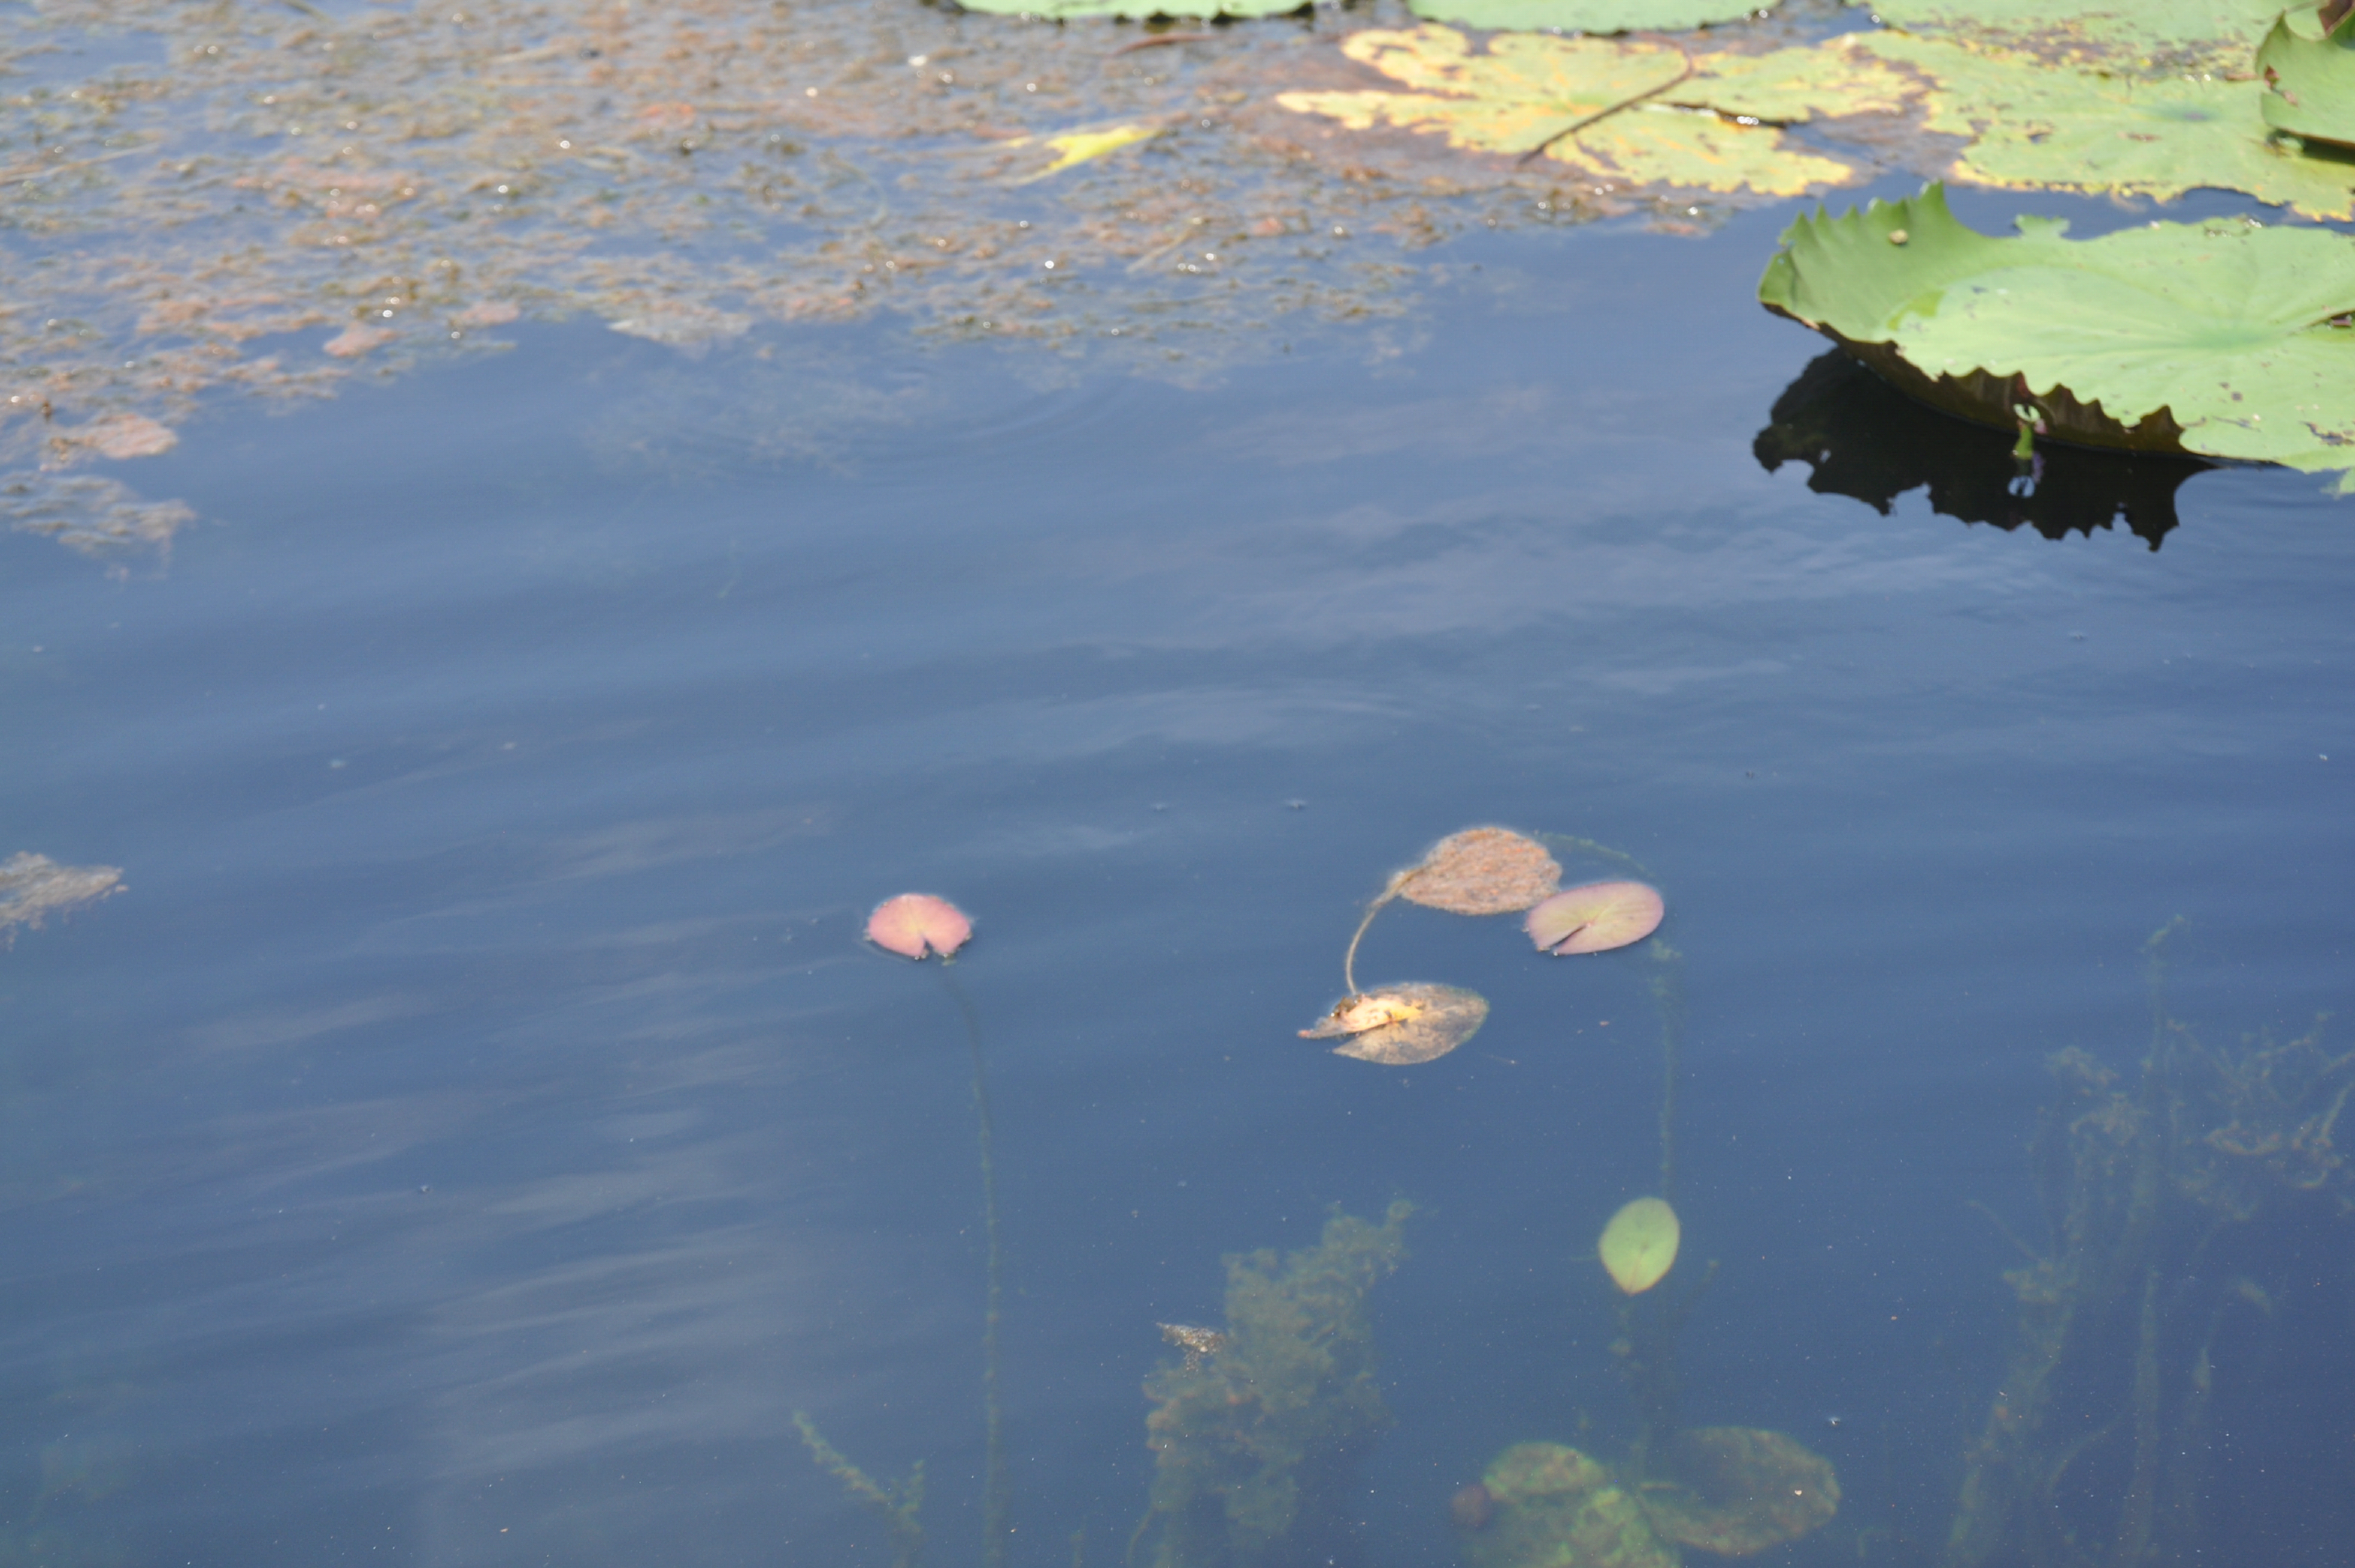
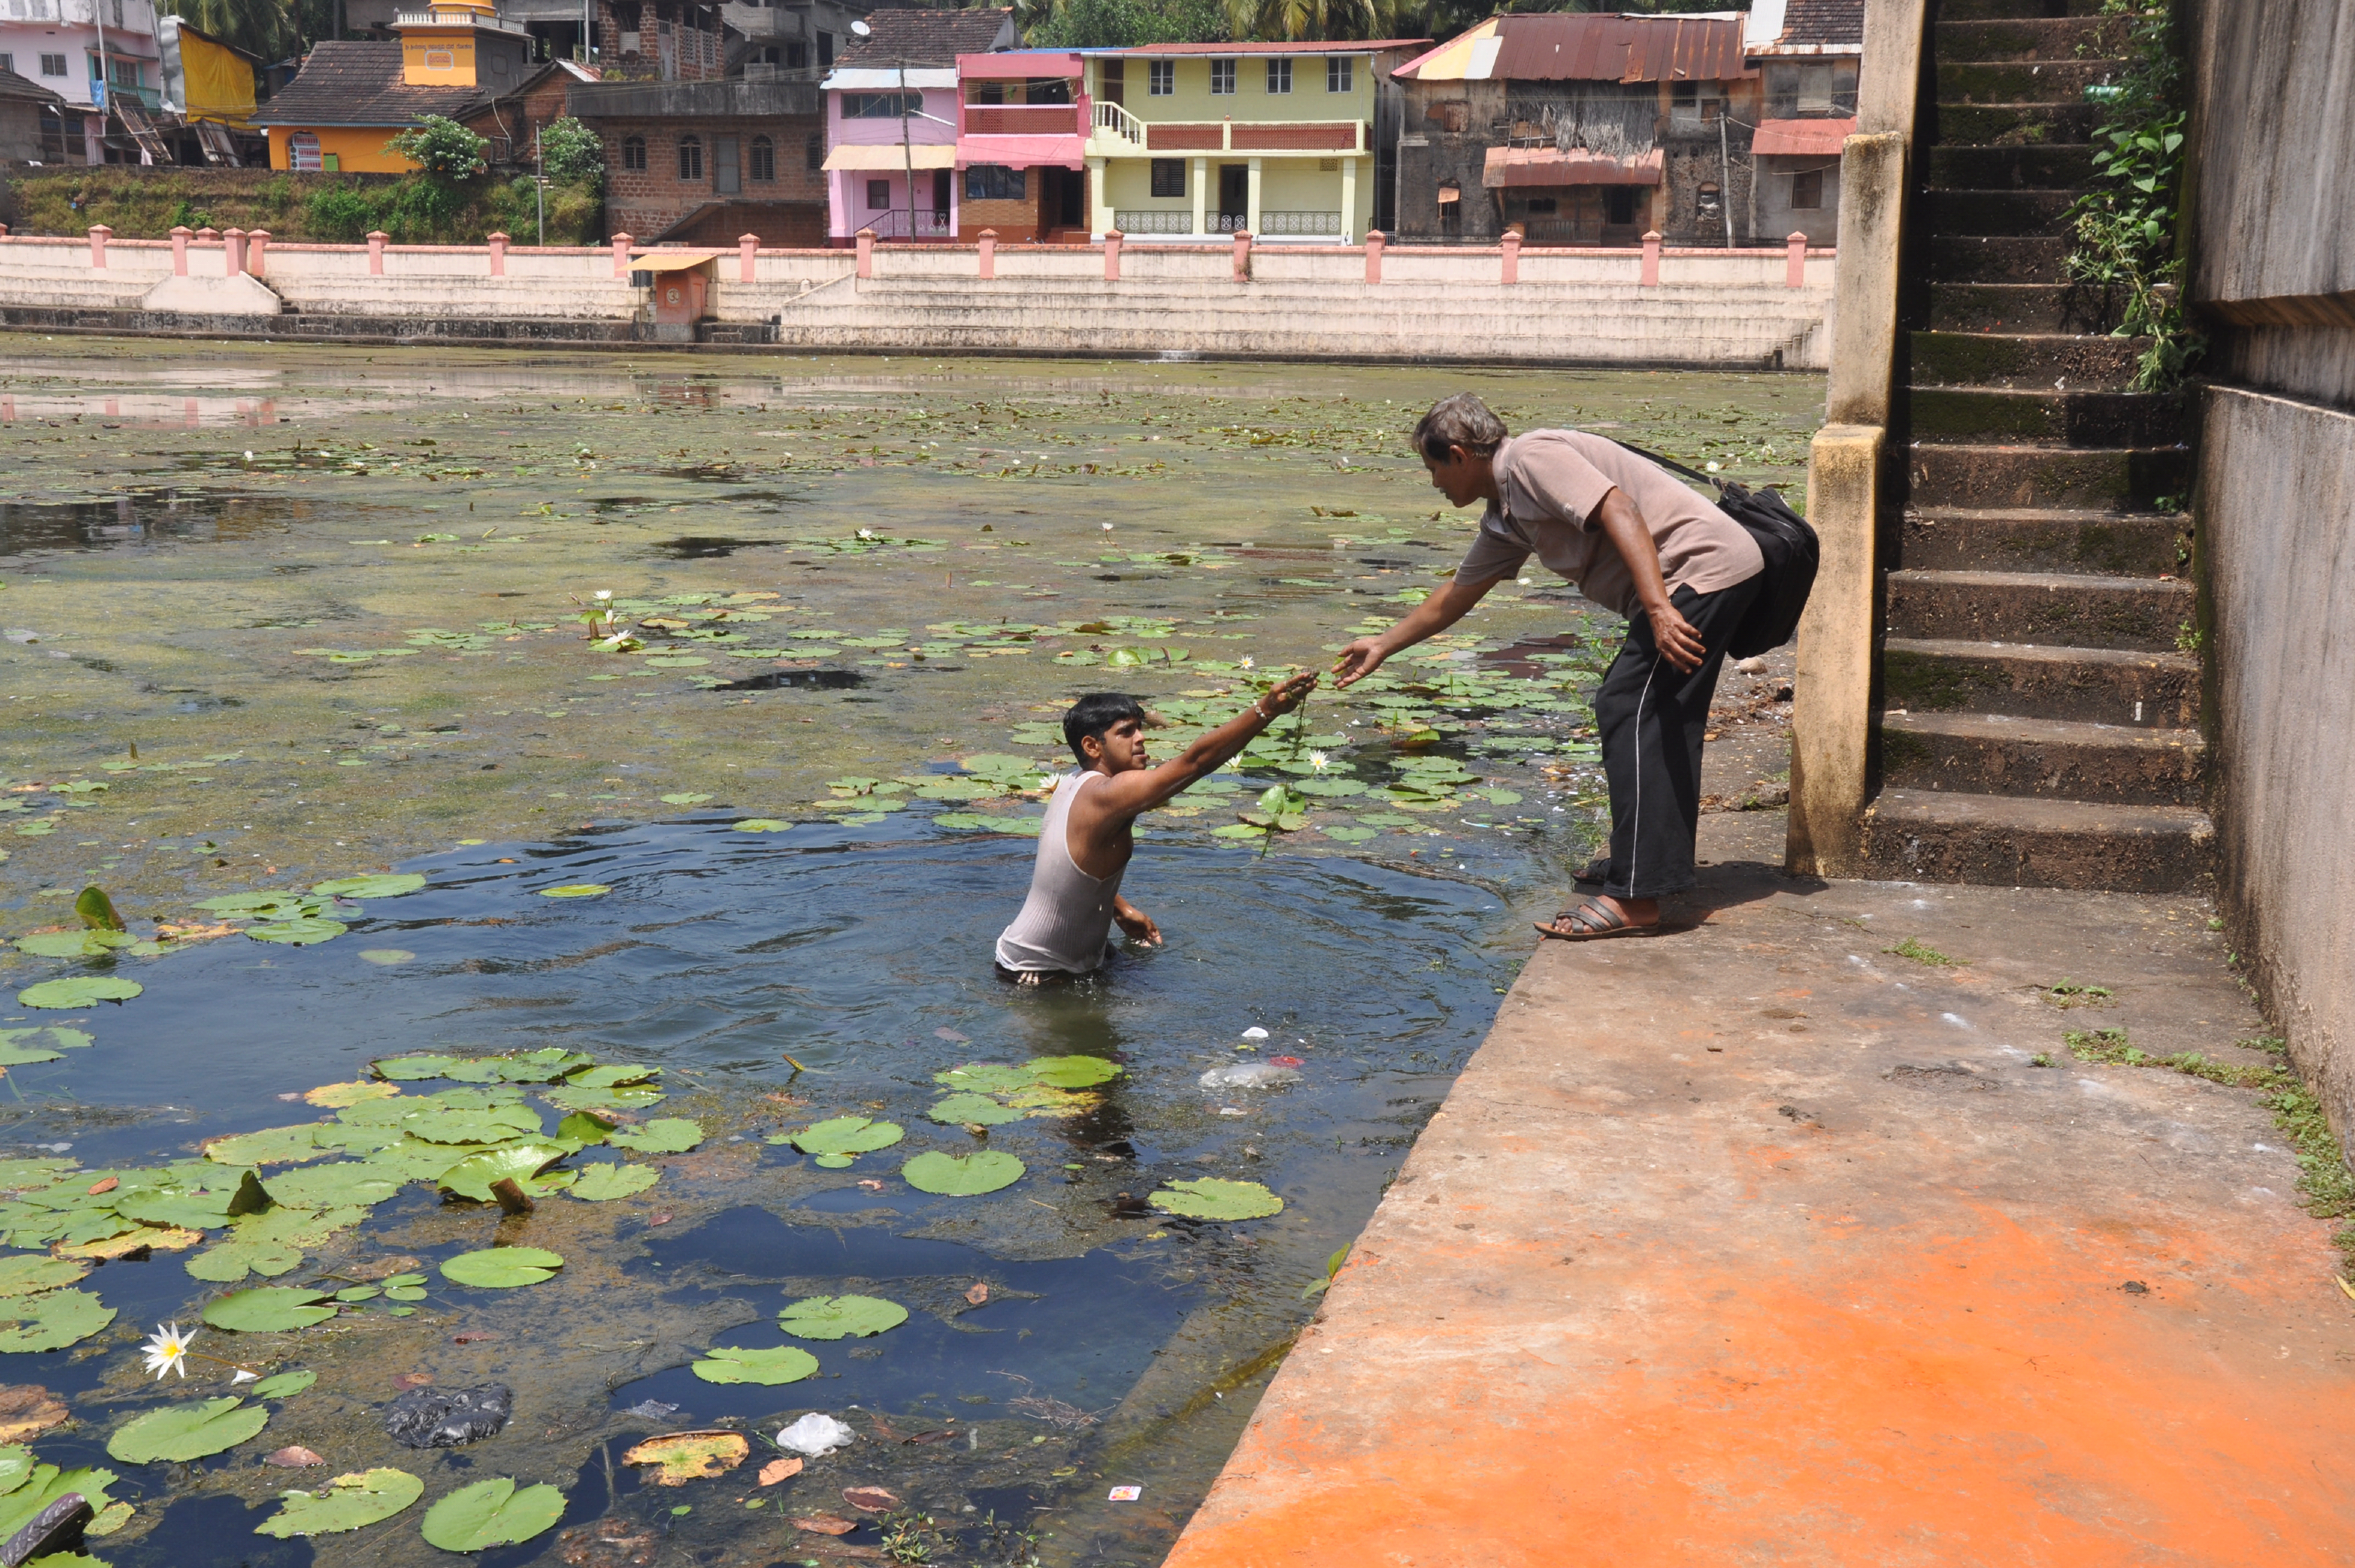
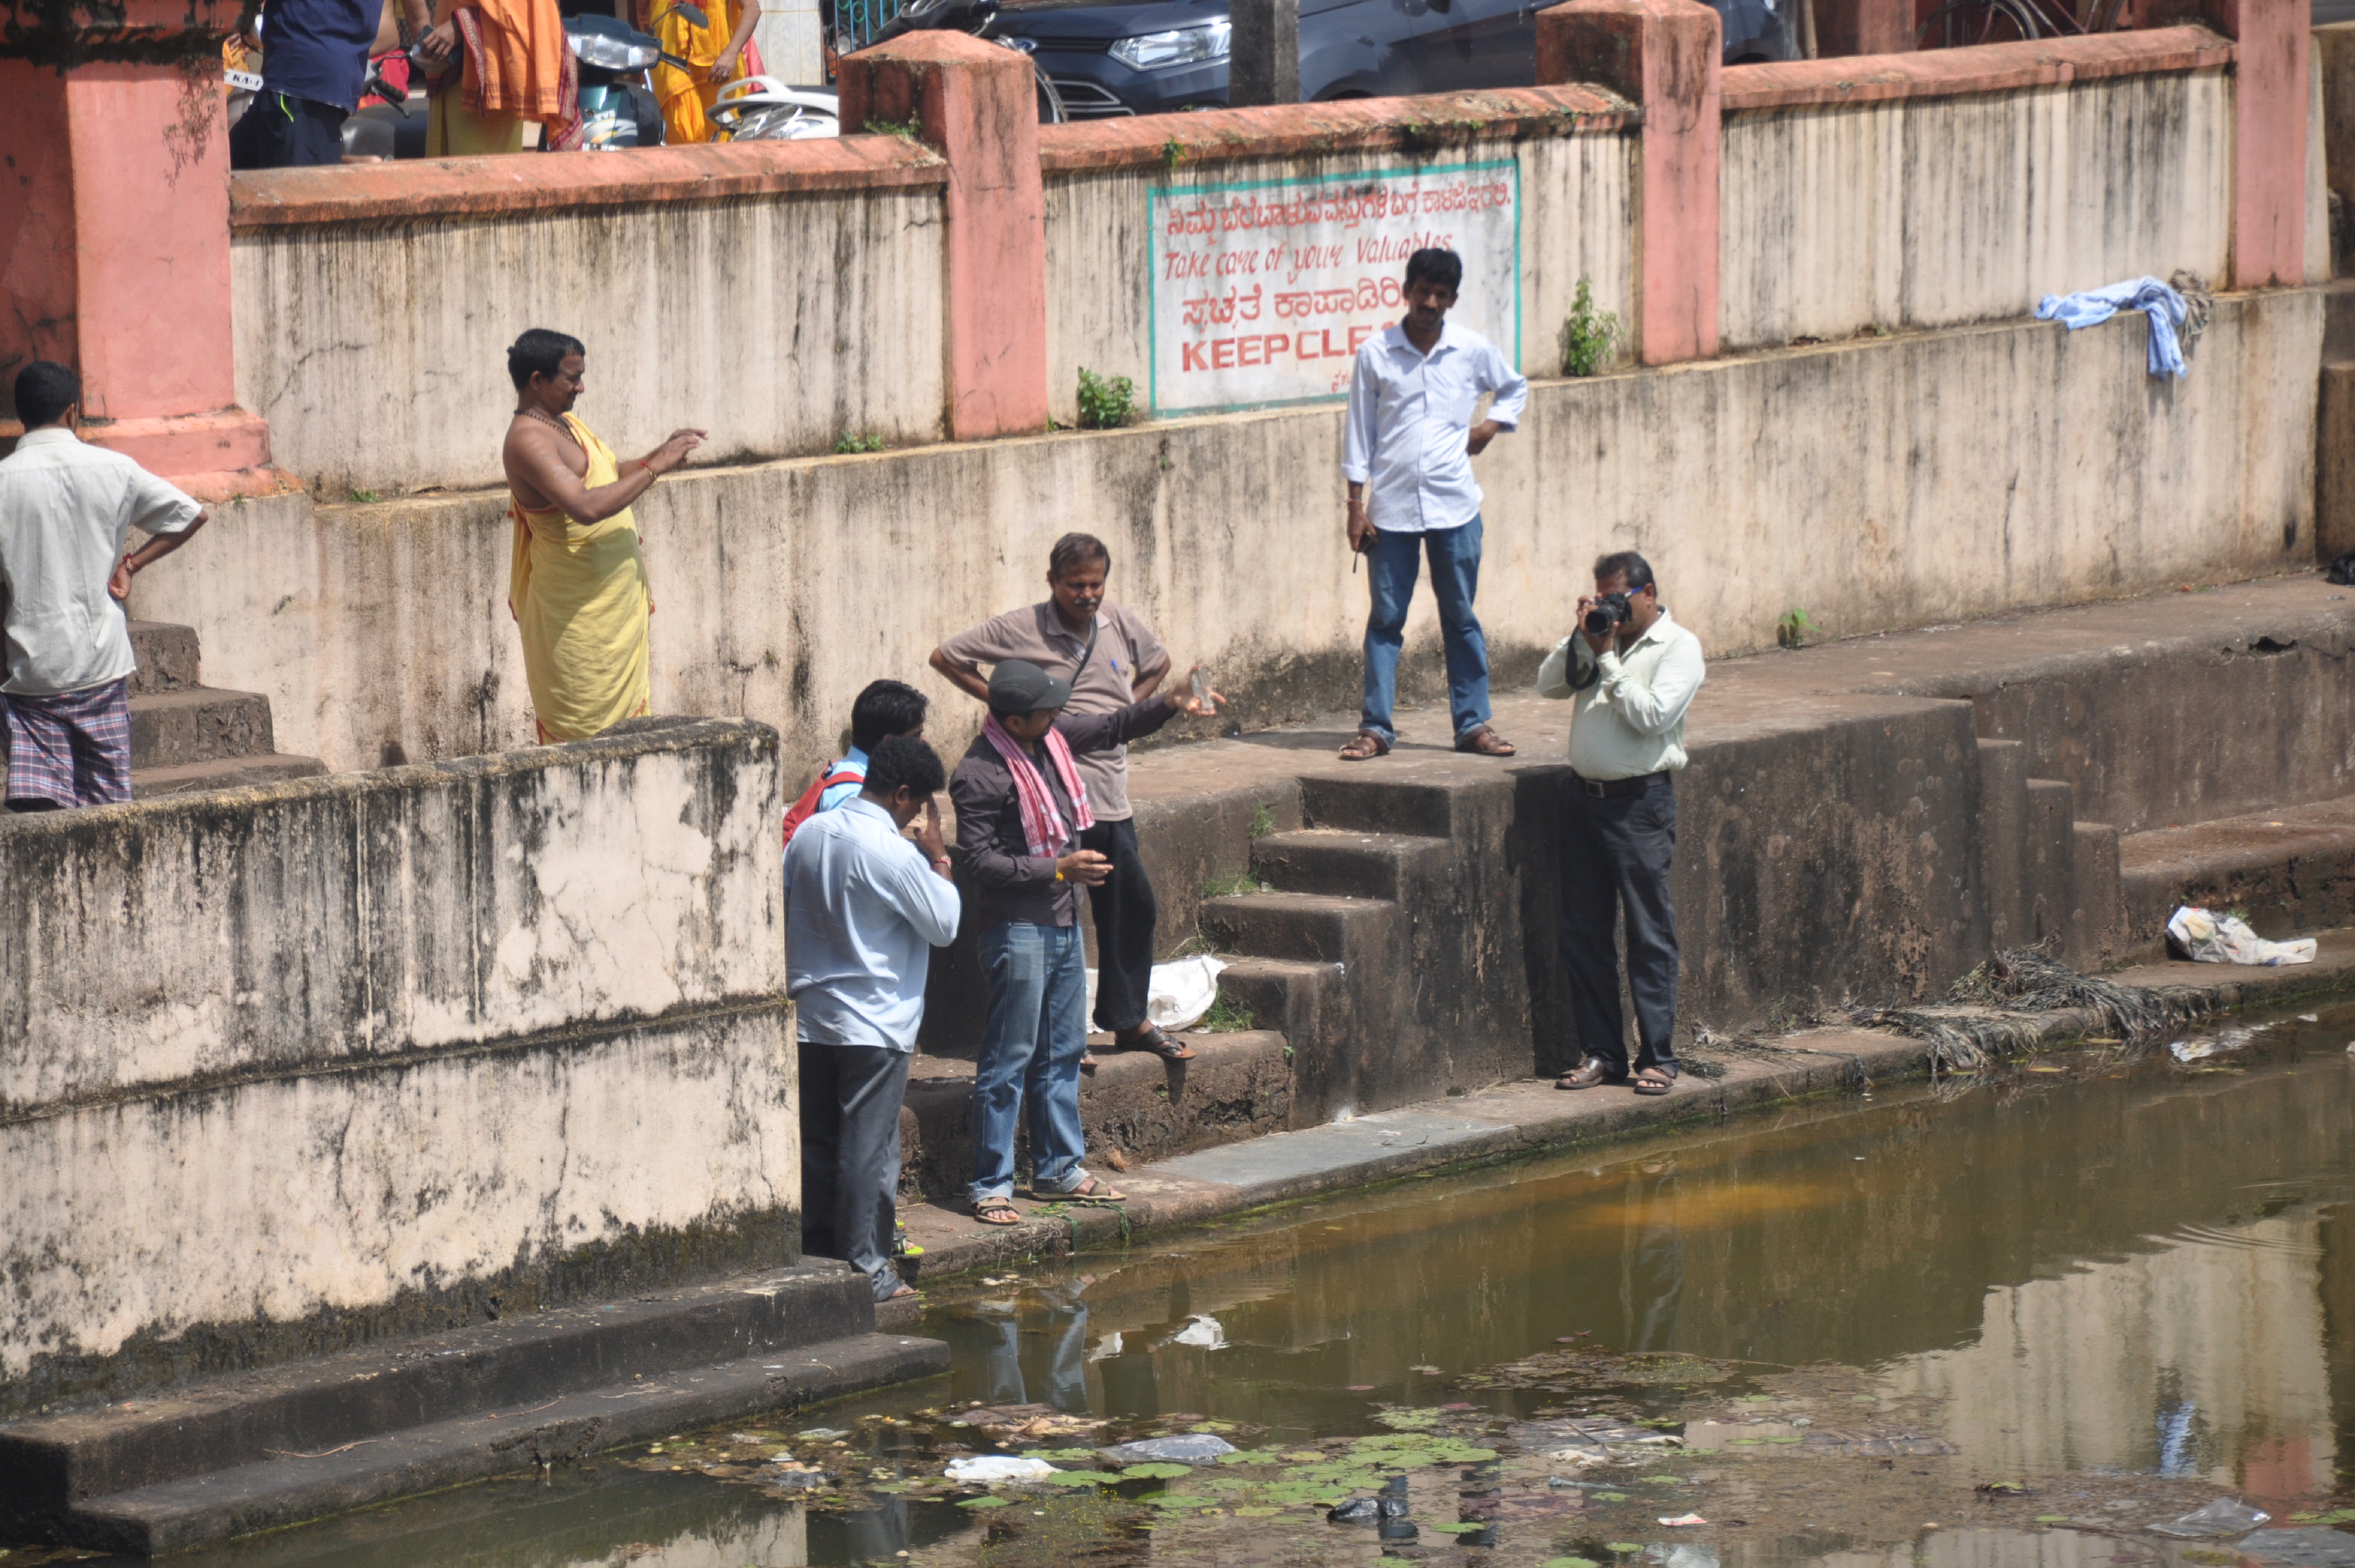
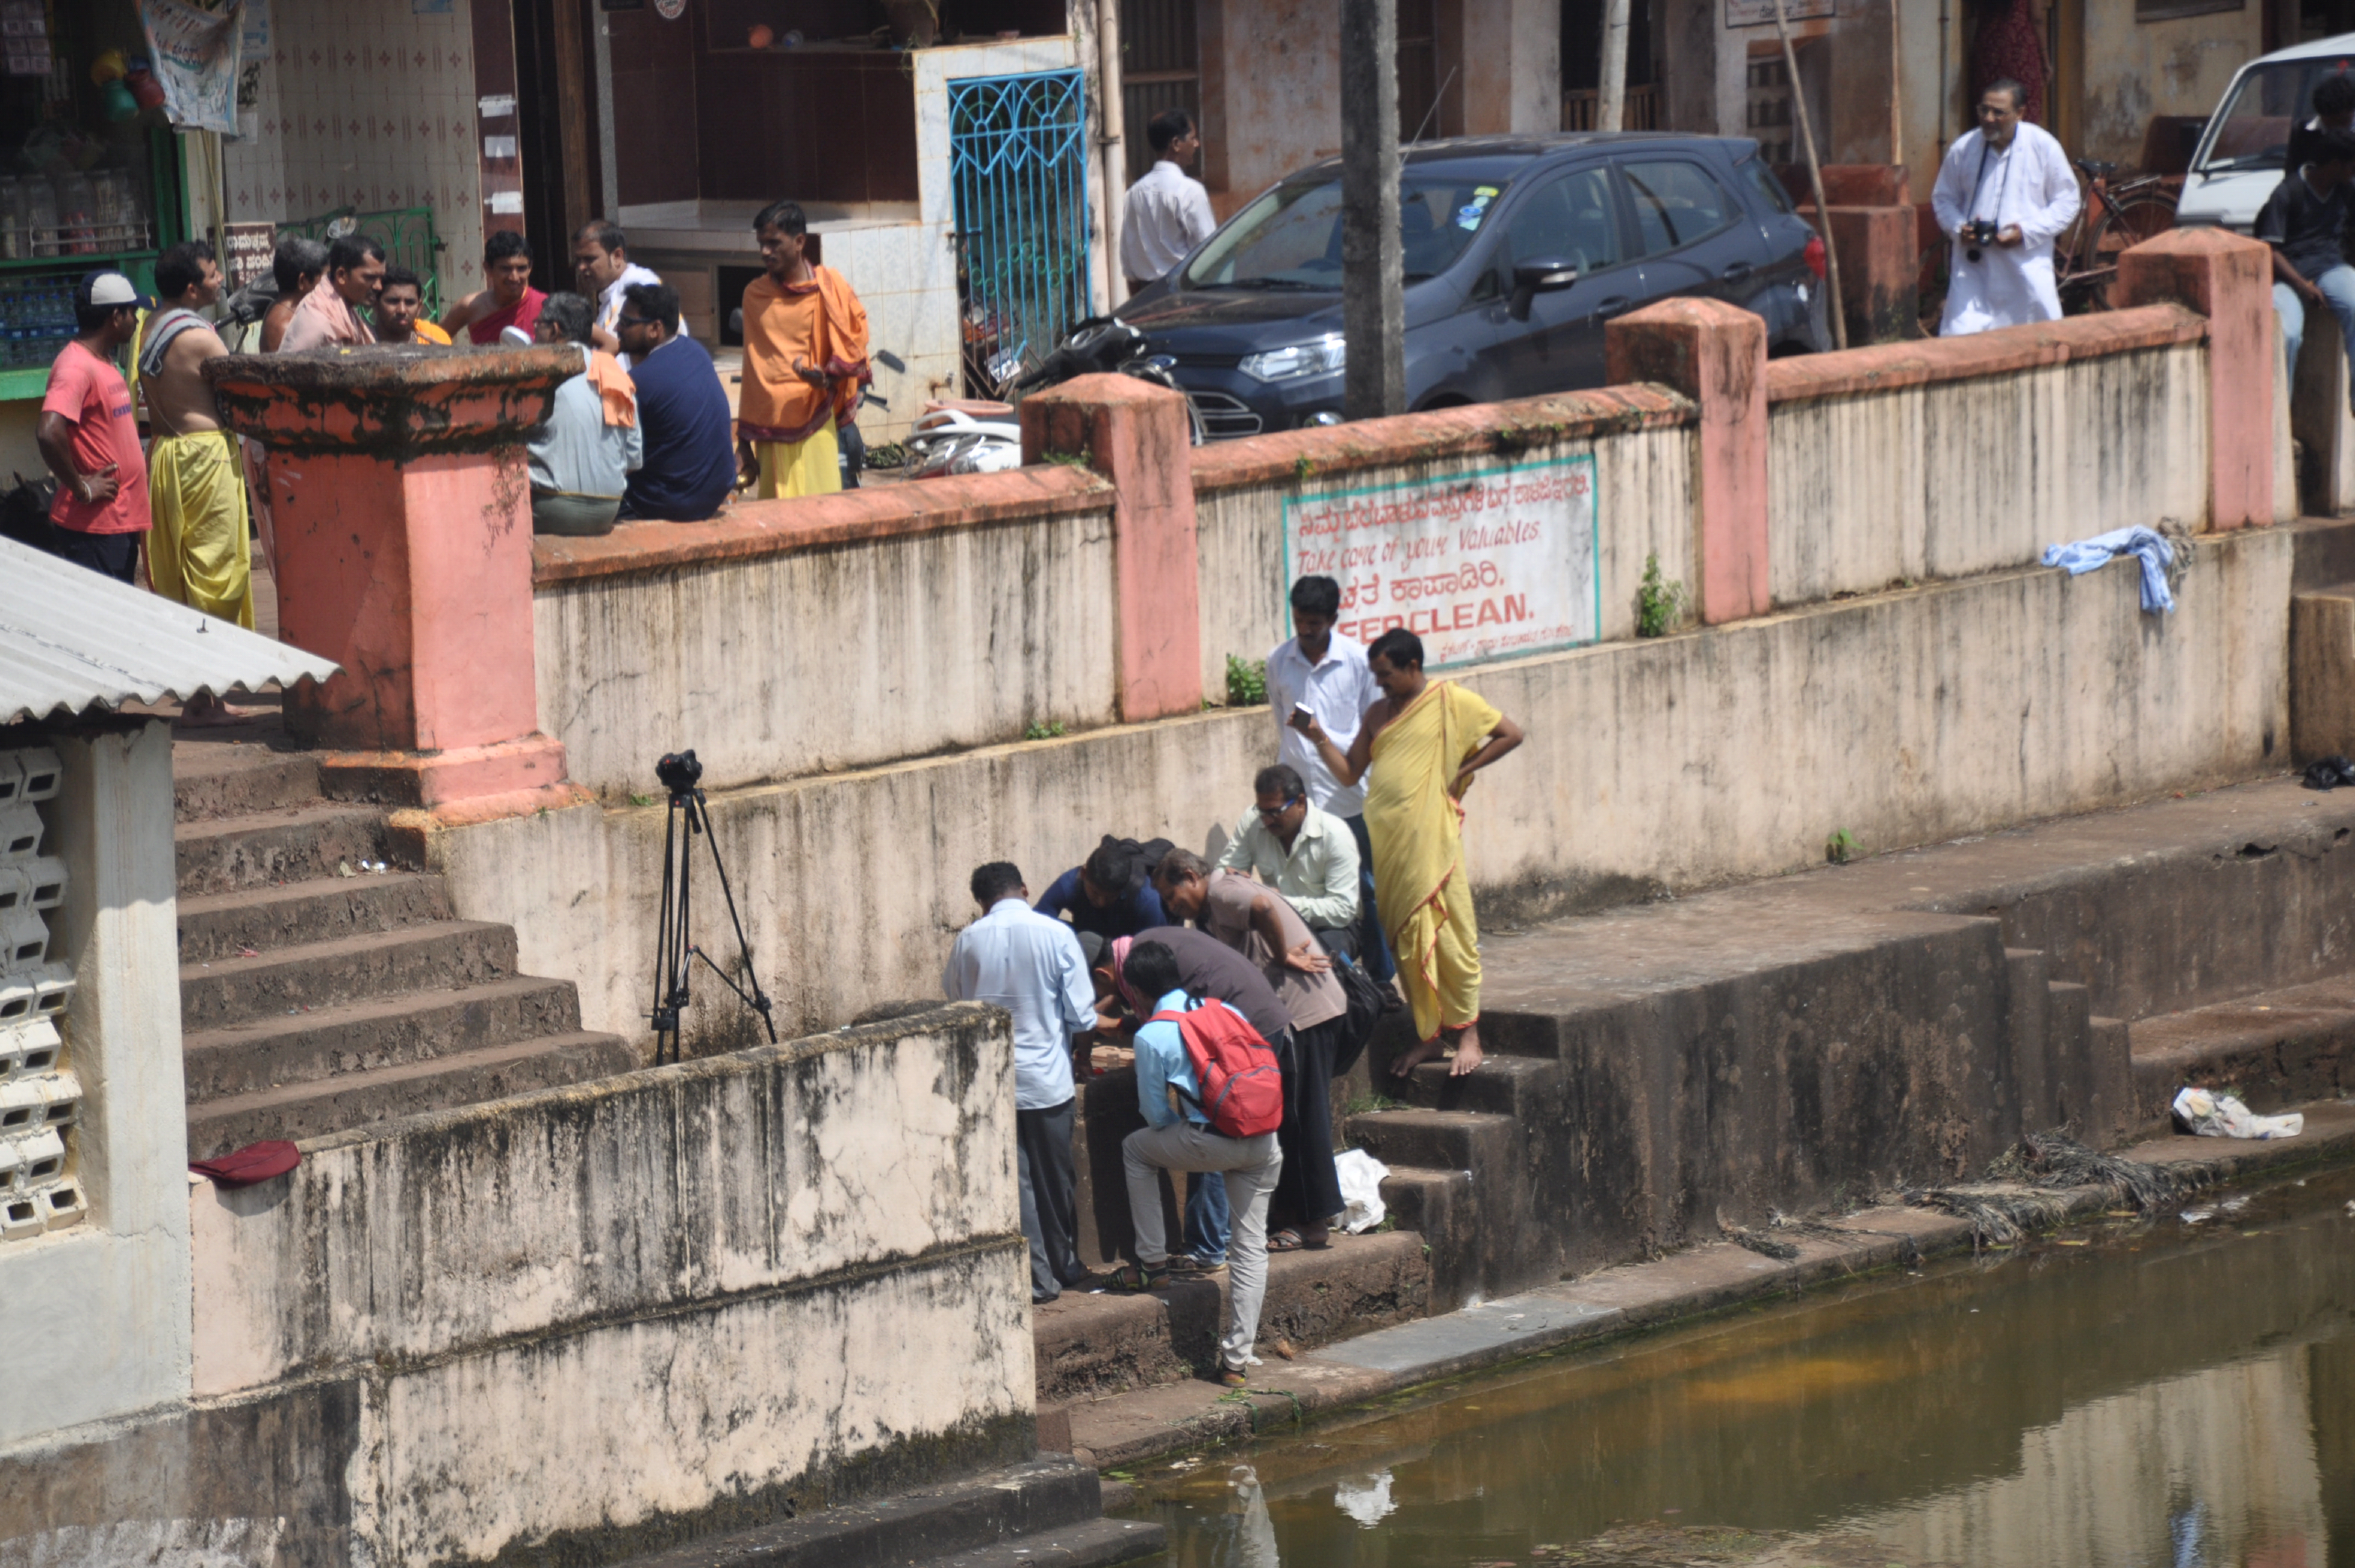
Figure 2.5: Sampling locations a)-b) Site-01; c)-d) Site-02; e)-f) Site-03 and g)-h) On-site analysis of physic-chemical parameters at the sampling locations
-
- Macrophyte sampling and analysis
Aquatic plants were collected from 11 different places apart from the three water sampling locations. These plants were identified based on morphological keys and published literature on flora (Cook, 1996). An aerial view of the pond using photographic camera at select elevated locations aided in assessing the extent of aquatic plant cover and their relative abundance. Samples were collected from the areas closer to the embankments (Figure 2.6.a) and specimen were transferred in the sealed polybags for further identification and analysis (Figure 2.6.b).
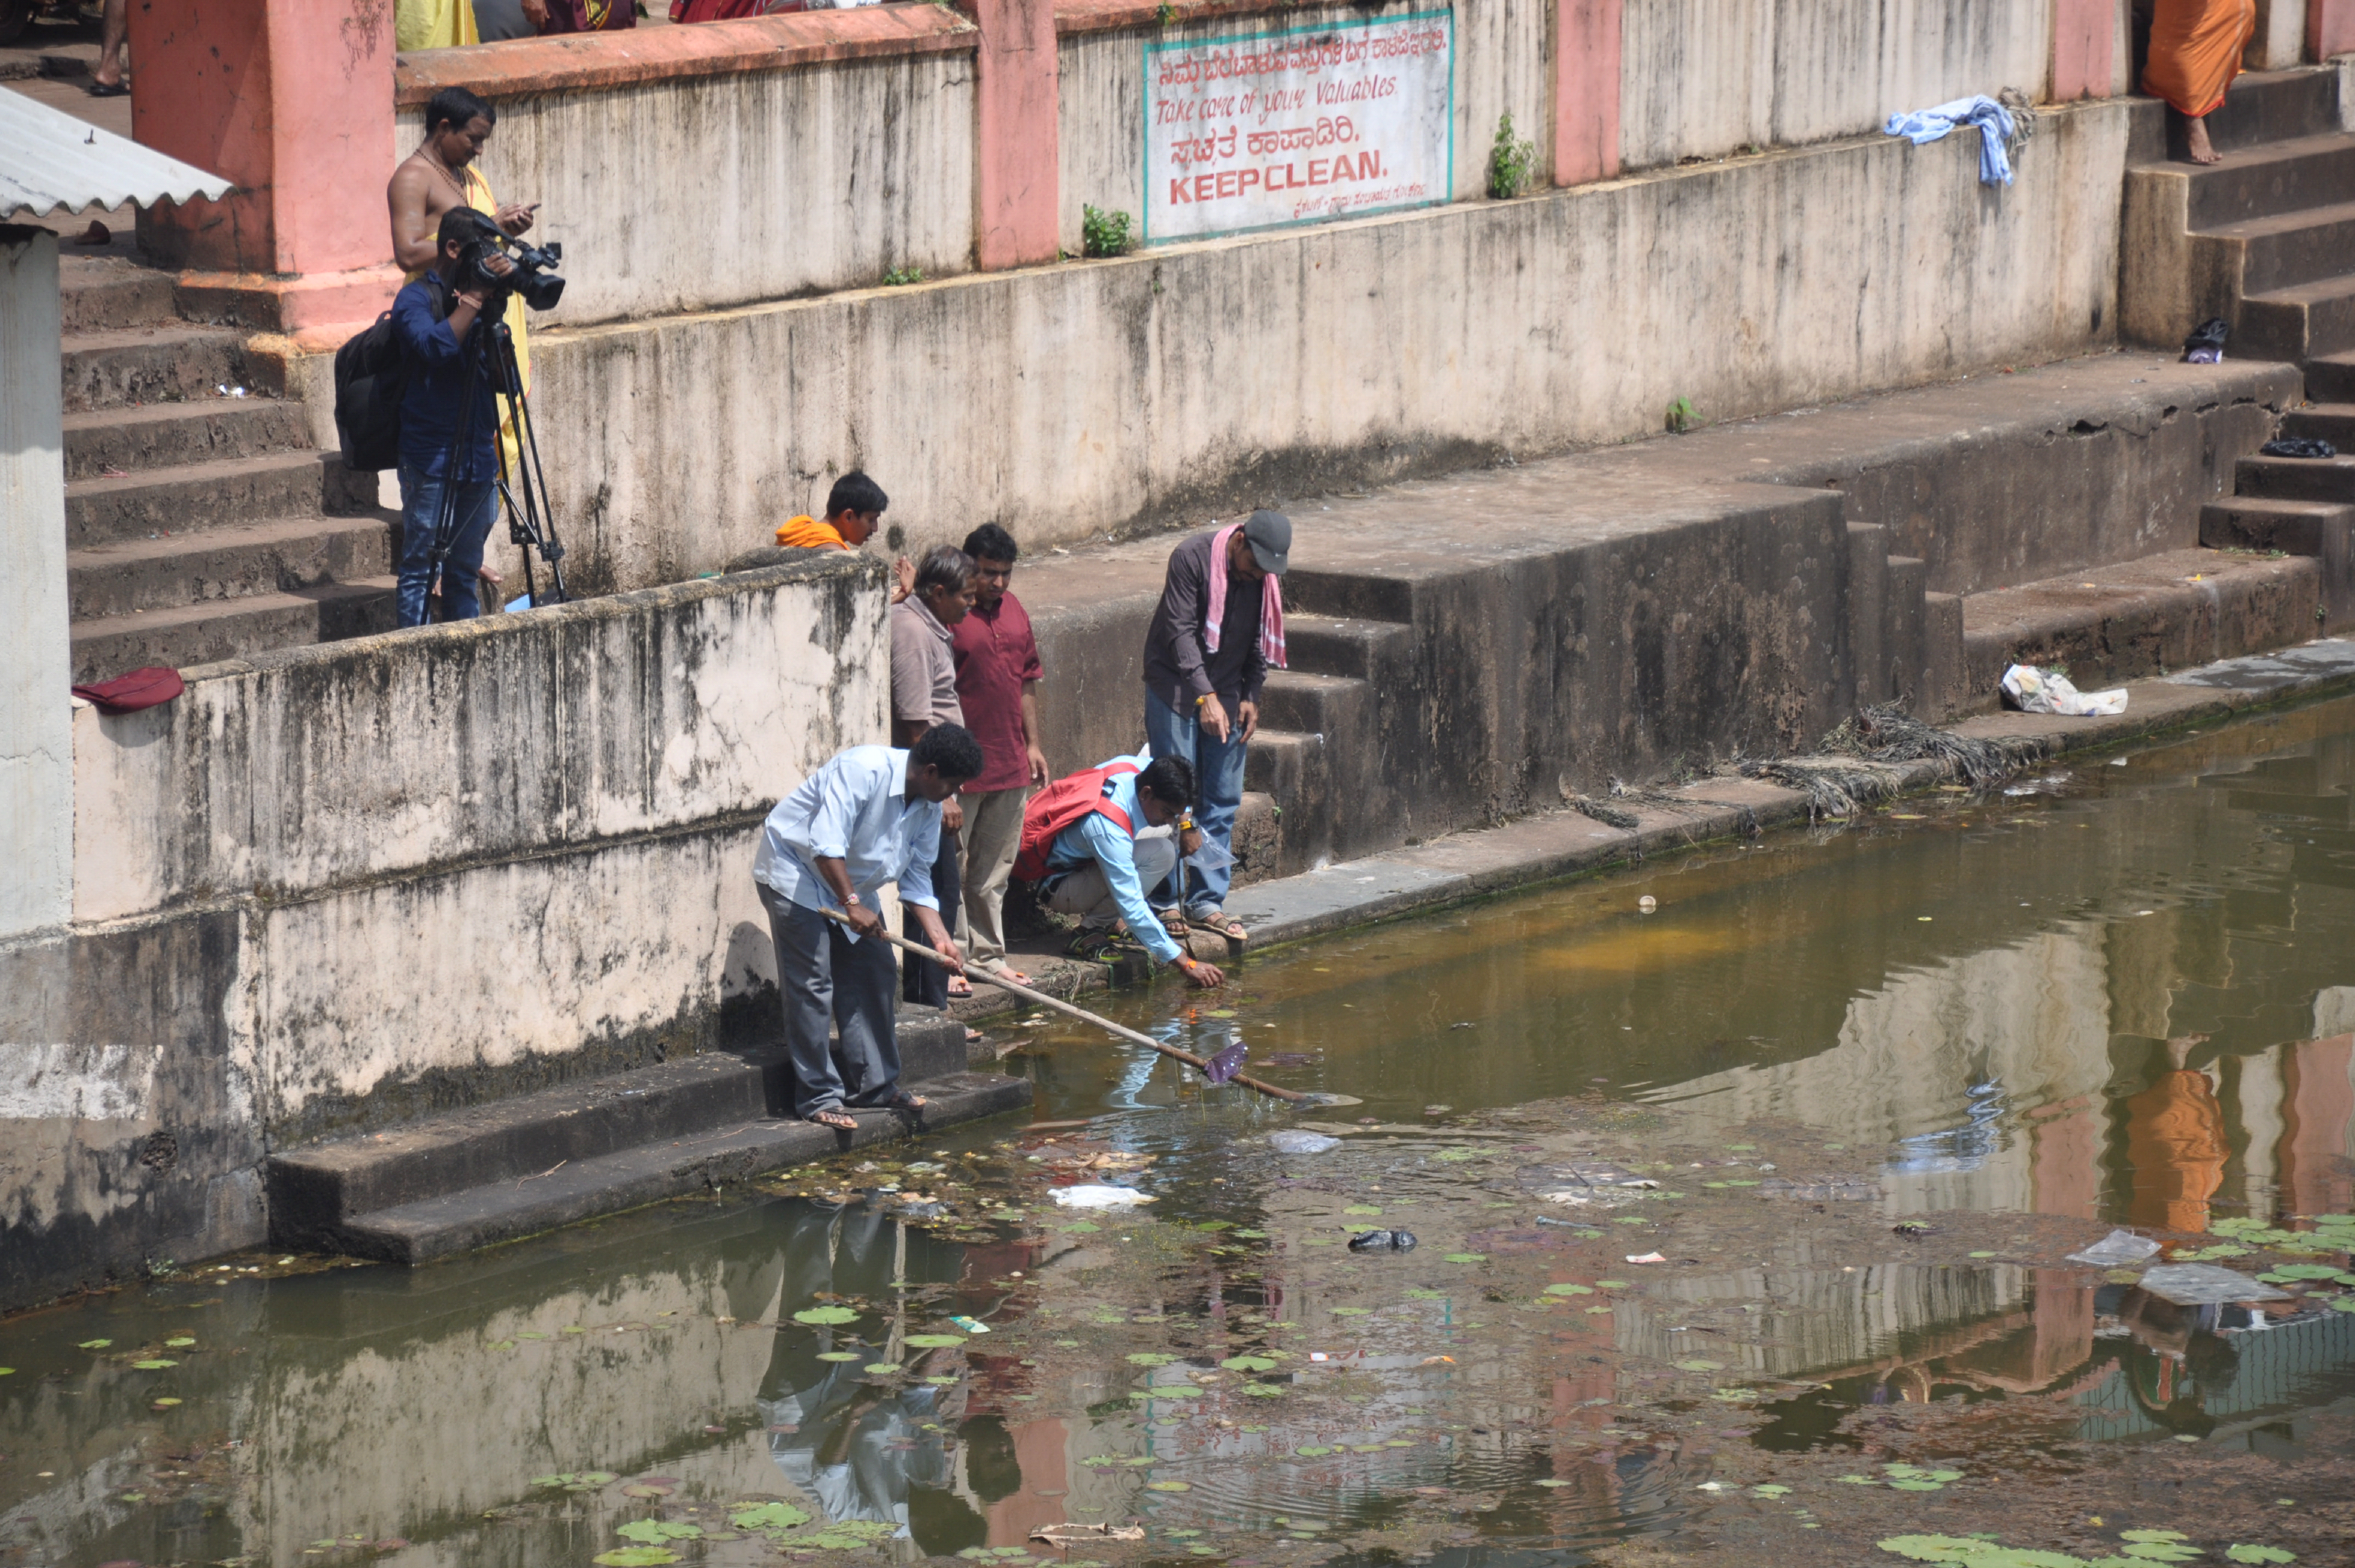
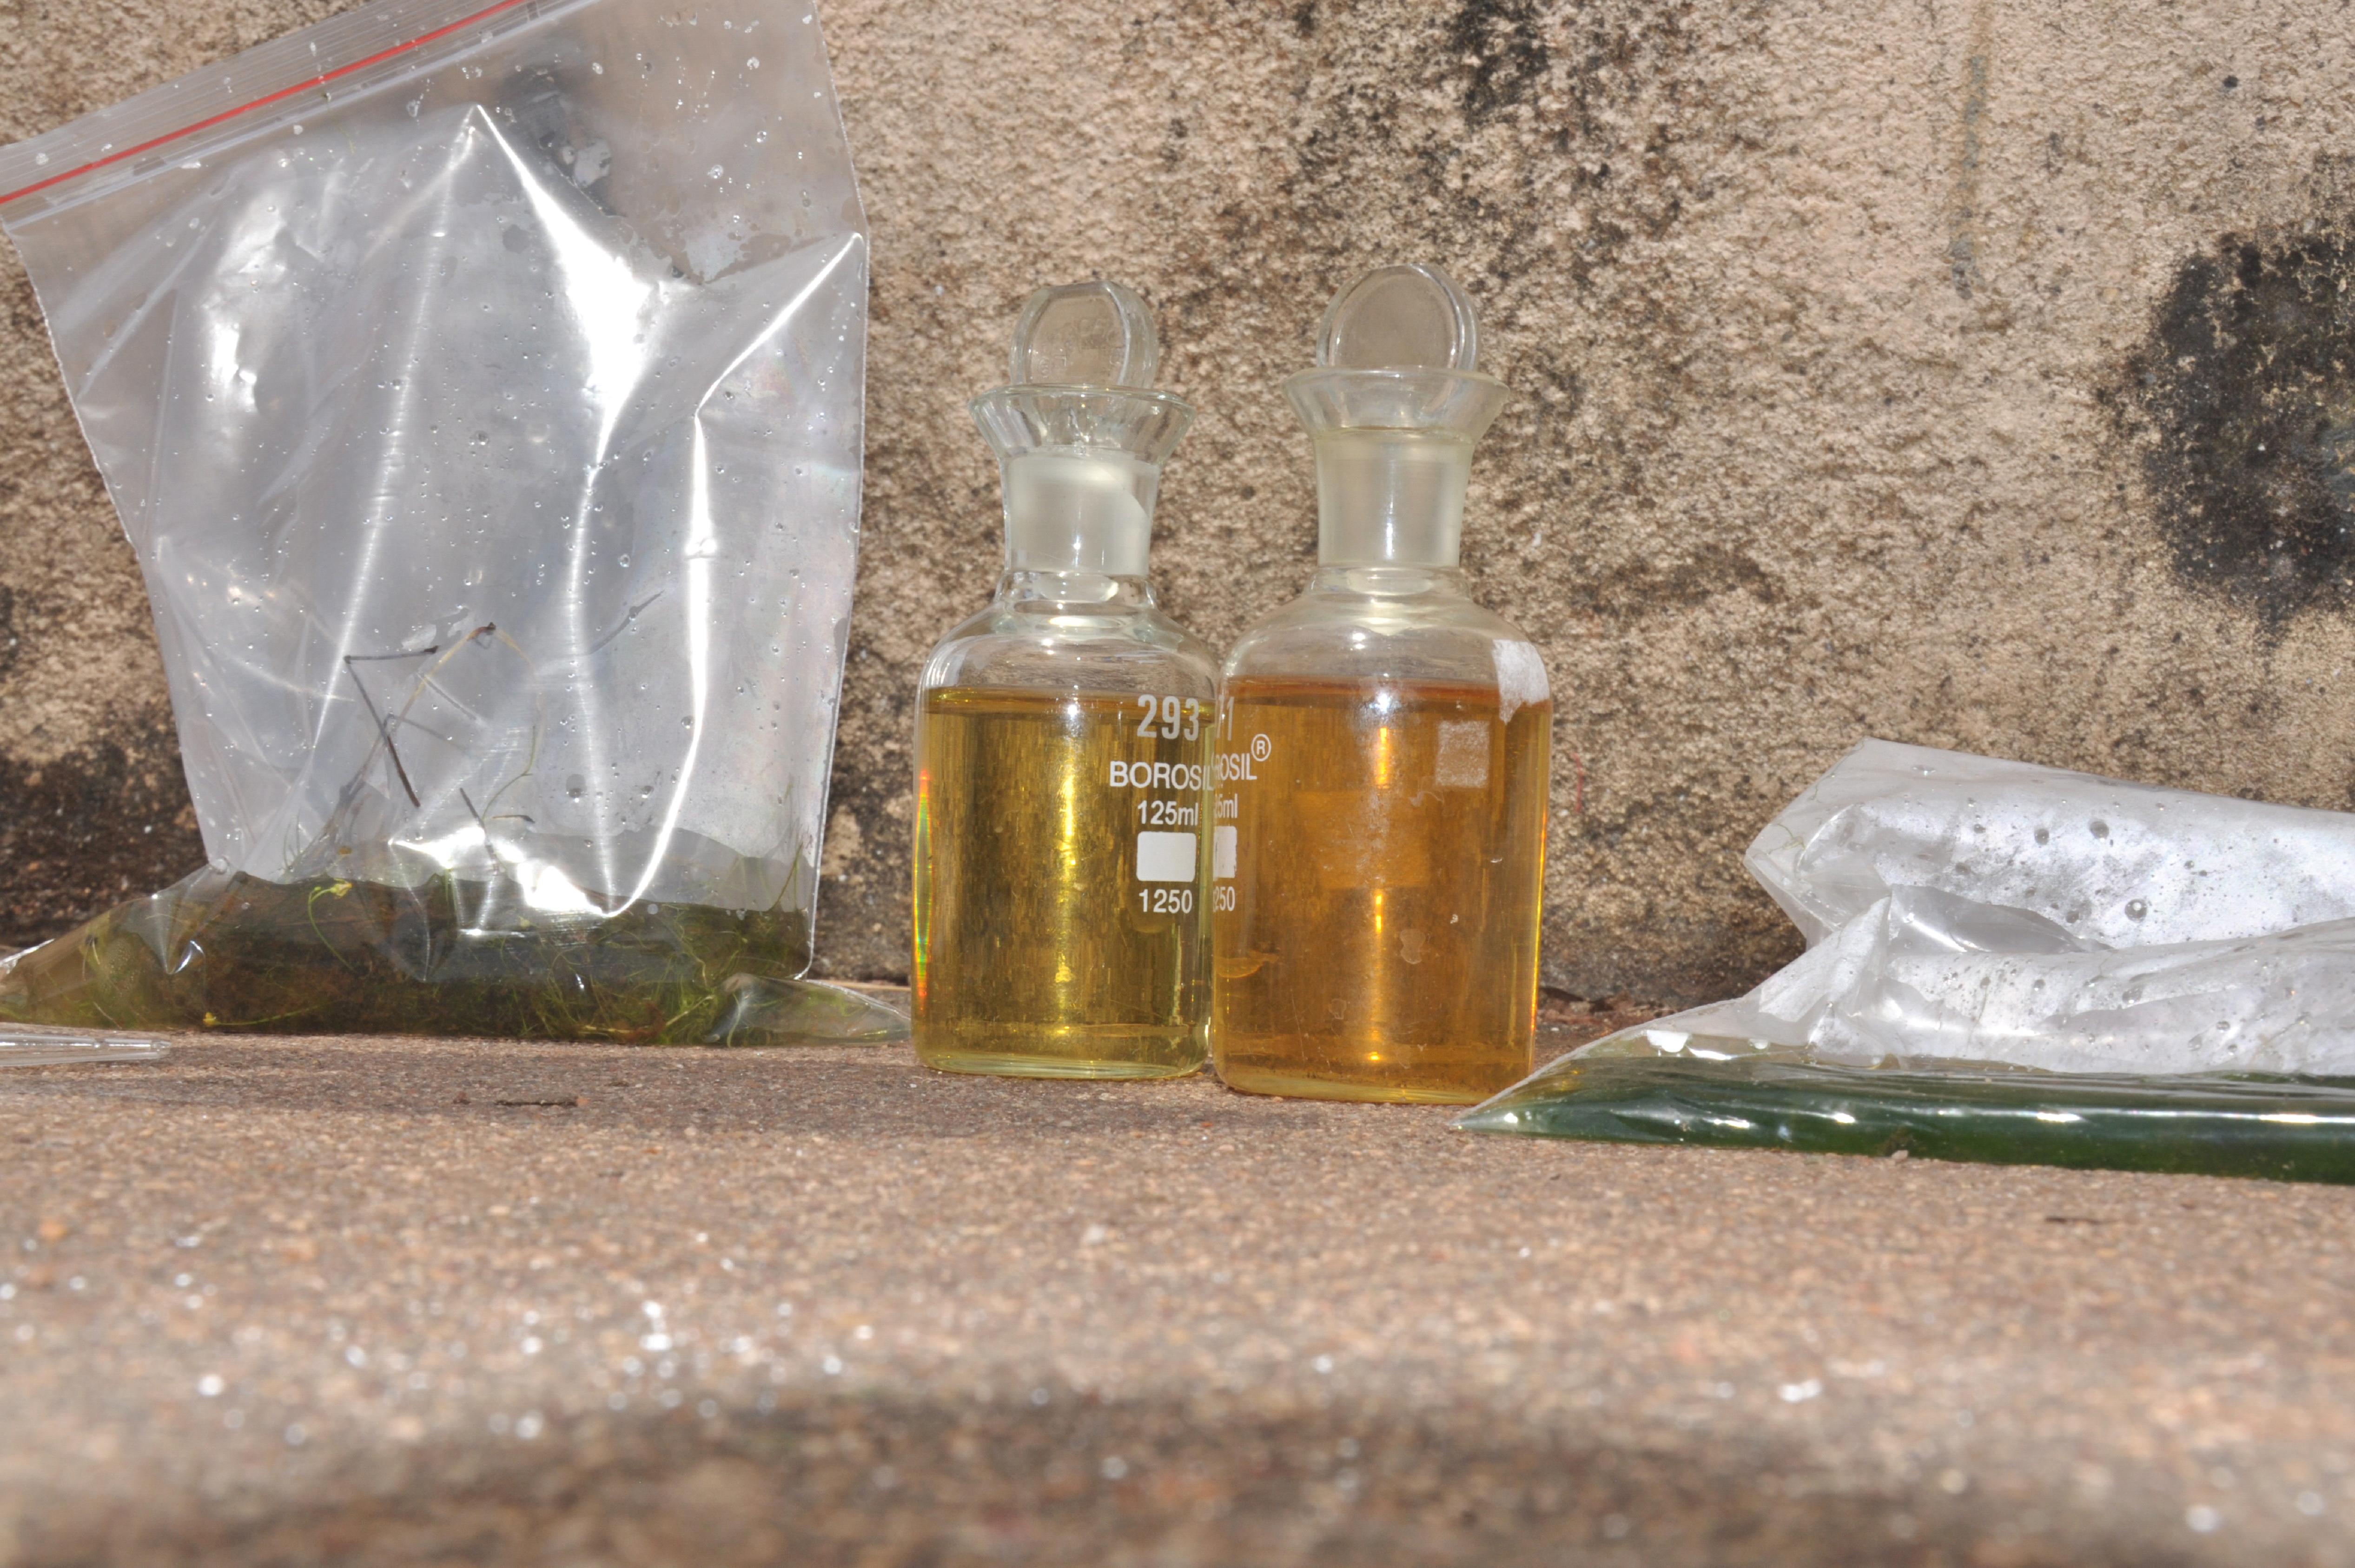
Figure 2.6 a) Macrophyte collection and b) Macrophyte collected in sealed polybags
-
- Algal sampling and analysis: Macro algal samples were collected from the select locations and were placed gently in sealed polybags for further identification. The micro algal samples were concentrated from the water samples by centrifuging ~10 ml of the water samples. The pellet was observed under light microscope (40 X and 100 X) after mild dilution. The identification and enumeration was carried out using standard keys for identification of freshwater algae.