
 Sahyadri ENews Issues: I - LXXVIII

Integrated Wetlands Ecosystem at Jakkur Lake, Bangalore: Optimal Wastewater TreatmentCite
Ramachandra T.V., Durga Madhab Mahapatra, Sudarshan P. Bhat, Asulabha K.S., Sincy Varghese, Bharath H. Aithal
ENVIS[RP], Environmental Information System, Energy and Wetlands
Research Group,
Centre for Ecological Sciences, Indian Institute of Science -
560012
envis.ces@iisc.ac.in
tvr@iisc.ac.in Phone:
080 22933099/22933503
5.0 Results and Discussion
Water quality analysis was carried out to assess physico-chemical and biological properties of water at various stages of the treatment and its suitability for domestic and irrigation purposes. Water samples were collected from nine locations (marked in Figure 2) twice at 45 days interval. The water samples were collected in clean acid washed one liter polythene bottles. Temperature, TDS, Conductivity and pH were measured on the site. Water quality parameters were analyzed as per the standard protocol (APHA, 1998). Algal samples collected from sampling locations were identified using standard keys (Prescott 1973;1982) based on their external appearance, colour, morphological characteristics, size, habitat, structure and orientation of chloroplast, cellular structure and pigments etc. Water samples collected were concentrated by centrifuging 15 ml volume.
5.1 Dissolved Oxygen: Dissolved oxygen (DO) is the most essential feature in aquatic system that helps in aquatic respiration as well as detoxification of complex organic and inorganic mater through oxidation. The presence of organic wastes demands high oxygen in the water leading to oxygen depletion with severe impacts on the water ecosystem. The DO of the analyzed water samples varied between 0 to 17.74mg/l. The higher variations of DO especially lower DO values are indicative of high organic matter in the immediate vicinity. The DO was very low at the inlets of wetlands and increased immediately after the algal pond. Lower DO values were observed near the macrophytes (invasive exotic weeds as water hyacinth, Eichhornia crassipes) infested regions at the outfalls outlets.
5.2 Total Dissolved Solids (TDS): Total dissolved solids present as as mineral matter in the form of dissolved cations and anions and to a smaller extent by organics, sourced from decomposing matter. Other sources include runoff from urban areas, road salts used on street, fertilizers and pesticides used on lawns and farms (APHA, 1998). TDS affect the water quality in many ways impacting the domestic water usage for cleaning, bathing etc as well as drinking purposes (Ramachandra et al., 2012). Surface as well as groundwater with high dissolved solids are of inferior flavor and induce an unfavorable physiological reaction to the dependent population. The TDS values in the samples analyzed, ranged from 612 to 710 mg/lacross all locations. It was higher in the inlets and reduced in the middle region of the lake. The TDS was little higher in the outlets than middle due to human activities (like washing, etc.), macrophyte and plankton cover etc.
Table 1: Onsite parameters
Site |
GPS |
DO(mg/l) |
Water Temp (oC) |
TDS (mg/l) |
pH |
EC (µS) |
Comments |
|||||
Period |
1 |
2 |
1 |
2 |
1 |
2 |
1 |
2 |
1 |
2 |
||
S1 |
13.07931N, 77.61032E |
5.08 |
7.26 |
24.3 |
25 |
637 |
636 |
7.8 |
8.4 |
1179 |
1160 |
Outlet, People washing clothes |
S2 |
13.08019N, 77.61463E |
-- |
3.71 |
-- |
24.4 |
-- |
631 |
-- |
8.2 |
-- |
1204 |
Outlet, after the cover of macrophytes |
S3 |
13.08143N, 77.61428E |
16.94 |
8.06 |
24 |
24.2 |
630 |
630 |
8 |
8.2 |
1213 |
1215 |
Outlet |
S4 |
13.08670N, 77.61265E |
16.53 |
8.06 |
24 |
-- |
629 |
643 |
8.1 |
-- |
1221 |
-- |
Middle |
S5 |
13.08725N, 77.61060E |
16.13 |
9.35 |
-- |
25 |
617 |
612 |
7.9 |
7.8 |
1134 |
1256 |
Middle |
S6 |
13.09266N, 77.60769E |
17.74 |
8.06 |
-- |
24.1 |
648 |
709 |
7.4 |
7.2 |
1213 |
1389 |
Inlet to the lake after algae pond |
S7 |
13.09433N, 77.60767E |
2.02 |
0.00 |
24.7 |
22.3 |
652 |
692 |
7.2 |
7.7 |
1293 |
1368 |
Untreated sewage water entering lake |
S8 |
13.09423N, 77.60767E |
5.40 |
4.60 |
23 |
24.9 |
683 |
630 |
7.8 |
8.2 |
1327 |
1244 |
Treated water from treatment plant |
S9 |
13.08582N, 77.60922E |
9.68 |
7.26 |
24.3 |
24.3 |
631 |
640 |
8 |
7.2 |
1228 |
1216 |
Middle |
Table 2: Chemical parameters of Water analysis
Sites |
Chloride (mg/l) |
Total Hardness (mg/l) |
Ca (mg/l) |
Mg (mg/l) |
Na (mg/l) |
K (mg/l) |
Total Alkalinity (mg/l) |
|||||||
Period |
1 |
2 |
1 |
2 |
1 |
2 |
1 |
2 |
1 |
2 |
1 |
2 |
1 |
2 |
S1 |
259.86 |
254.18 |
212 |
206 |
40.88 |
39.28 |
26.82 |
26.33 |
300.8 |
331.6 |
47.6 |
51.6 |
260 |
252 |
S2 |
-- |
249.92 |
-- |
204 |
-- |
40.08 |
-- |
25.36 |
-- |
367.6 |
-- |
56.4 |
-- |
252 |
S3 |
249.92 |
249.92 |
212 |
204 |
42.48 |
39.28 |
25.84 |
25.84 |
360 |
359.6 |
58 |
57.6 |
250 |
248 |
S4 |
166.14 |
190.28 |
208 |
200 |
43.29 |
40.08 |
24.38 |
24.38 |
343.6 |
334 |
52.8 |
54.4 |
260 |
256 |
S5 |
180.34 |
168.98 |
210 |
224 |
44.09 |
38.48 |
24.38 |
21.93 |
284.8 |
282.4 |
54.4 |
53.2 |
240 |
254 |
S6 |
251.34 |
249.92 |
240 |
256 |
59.32 |
59.93 |
22.42 |
22.90 |
293.6 |
260.4 |
53.2 |
56 |
290 |
310 |
S7 |
254.18 |
257.02 |
252 |
244 |
65.73 |
61.72 |
21.44 |
21.93 |
256.4 |
266 |
52.4 |
55.6 |
420 |
444 |
S8 |
252.76 |
254.18 |
256 |
254 |
71.34 |
67.71 |
19.00 |
24.87 |
268.8 |
320.8 |
56 |
54.8 |
440 |
448 |
S9 |
230.04 |
210.16 |
206 |
198 |
44.89 |
46.49 |
22.91 |
19.99 |
330.4 |
342.4 |
55.2 |
57.6 |
260 |
252 |
Table 3: Nutrient analysis of water
Sites |
COD (mg/l) |
BOD (mg/l) |
Phosphate (mg/l) |
Nitrate (mg/l) |
||||
Period |
1 |
2 |
1 |
2 |
1 |
2 |
1 |
2 |
S1 |
28 |
20 |
17.14 |
5.04 |
0.09 |
0.15 |
0.28 |
0.32 |
S2 |
-- |
20 |
-- |
9.58 |
-- |
0.20 |
-- |
0.34 |
S3 |
34 |
10 |
19.15 |
1.01 |
0.09 |
0.20 |
0.26 |
0.34 |
S4 |
30 |
14 |
22.18 |
5.04 |
0.10 |
0.25 |
0.26 |
0.36 |
S5 |
18 |
20 |
27.22 |
1.01 |
0.10 |
0.67 |
0.21 |
0.33 |
S6 |
16 |
48 |
25.20 |
16.13 |
0.21 |
1.00 |
0.24 |
0.27 |
S7 |
161.3 |
28 |
128 |
6.05 |
0.72 |
1.29 |
0.22 |
0.22 |
S8 |
88 |
16 |
46.37 |
4.54 |
0.35 |
0.27 |
0.36 |
0.38 |
S9 |
18 |
16 |
20.16 |
5.04 |
0.09 |
0.18 |
0.20 |
0.26 |
5.3 pH: pH is a numerical expression that indicates the degree to which water is acidic or alkaline, with the lower pH value tends to make water corrosive and higher pH has negative impact on skin and eyes. The pH value ranged from 7.2 to 8.4.
5.4 Chlorides: Chlorides are essentially anionic radical that imparts chlorosity to the water. An excess of chlorides leads to the formation of potentially carcinogenic and chloro-organic compounds like chloroform, etc. Chloride values in samples collected from Jakkur lake system ranged from 166-260mg/l. Chloride values were high at inlets (treated and untreated water) and relatively lower at the outlet of algal pond and the middle portion of Jakkur lake. At outlets, it is higher due to washing activities with the use of bleaching powder i.e. CaO(Cl)2.
5.5 Sodium: Sodium (Na) is one of the essential cations that stimulate various physiological processes and functioning of nervous system, excretory system and membrane transport in animals and humans. Increase of sodium ions has a negative impact on blood circulation, nervous coordination, hence affecting the hygiene and health of the nearby localities. In this study the concentration of sodium ranged from 256 to 367 mg/land higher values were observed in samples collected at outlets.
5.6 Potassium: Potassium (K) is an essential element for both plant and animal nutrition, and occurs in ground waters as a result of mineral dissolution, decomposing of plant materials and also from agricultural runoff. Potassium ions in the plant root systems helps in the cation exchange capacity to transfer essential cations like Ca and Mg from the soil systems into the vascular systems in the plants in replacement with the potassium ions (APHA, 1998). Incidence of higher potassium levels in soil system affects the solute transfer (active and passive) through the vascular conducting elements to the different parts of the plants. The potassium content in the water samples ranges between 47-58mg/l. The potassium values were high at outlets due to decomposition of plant materials.
5.7 Alkalinity: Alkalinity is a measure of the buffering capacity of water contributed by the dynamic equilibrium between carbonic acid, bicarbonates and carbonates in water. Sometimes excess of hydroxyl ions, phosphate, and organic acids in water causes alkalinity. High alkalinity imparts bitter taste. The acceptable limit of alkalinity is 200mg/l. Alkalinity of the samples was in range 240-444 mg/l. High alkalinity of 448 and 444 mg/l was observed at the inlet of wetlands (or outlet of the treatment plant). These values declined after the water passed through wetlands (in particular the algal pond) and also in the middle of Jakkur lake.
5.8 Total hardness: Hardness is a measure of dissolved minerals that decides the utility of water for domestic purposes. Hardness is mainly due to the presence of carbonates and bicarbonates i.e temporary hardness and due to sulphates and chlorides i.e. permanent hardness. It is caused by variety of dissolved polyvalent metallic ions predominantly calcium and magnesium cation or other cations like barium, iron, manganese, strontium and zinc. In the present study, the total hardness ranged between 198 to 256mg/l. It was higher in the inlets. High values of hardness are probably due to the regular addition of sewage and detergents.
5.9 Calcium: Calcium (Ca) is one amongst the major macro nutrients which are needed for the growth, development and reproduction in case of both plants and animals. The presence of Ca in water is mainly due to its passage through deposits of limestone, dolomite, gypsum and other gypsiferous materials (APHA, 1998) along with the Ca (from sewage). It contributes to the total hardness of the water. Ca concentration in all samples analyzed periodically ranged between 39 to 71mg/l. Ca concentration was high in the sewage water (treated and untreated) entering into the lake.
5.10 Magnesium: Magnesium (Mg) in one of the most essential macro nutrients that helps as a co-factor in the enzyme systems and in the central metal ions that constitutes the chlorophyll molecule essential for plant photosynthesis. According to WHO guidelines the maximum admissible limit is 50mg/l. In this study the concentration of Magnesium ranged from 19- 26.82 mg/l.
5.11 Nutrients (nitrates and phosphates): Nutrients essentially comprise of various forms of N and P that readily mineralizes (inorganic mineral ions) to enable uptake by microbes and plants. Accumulation of nitrates and inorganic P induces changes in water quality that affects its integrity leading to higher net productivity. Nitrates in excess amounts together with phosphates accelerate aquatic plant growth in surface water causing rapid oxygen depletion or eutrophication in the water. Nitrates at high concentrations (10 mg/l or higher) in surface and groundwater used for human consumption are particularly toxic to young children affecting the oxygen carrying capacity of blood cells (RBC) causing cyanosis (methemoglobinemia). In the present study, nitrate values ranged from 0.2 to 0.38 mg/land phosphate values ranged between 0.09 to 1.29mg/l. The nitrate and phosphate values are higher at the wetlands inlets and significantly reduce after the passage through wetlands and algal pond as elucidated in Figure 4.
5.12 BOD and COD: BOD and COD are important parameters that indicate the presence of organic content. Biochemical oxygen demand (BOD) is the amount of oxygen required by bacteria while stabilizing decomposable organic matter under aerobic conditions. It is required to assess the pollution of surface and ground water where contamination occurred due to disposal of domestic and industrial effluents. Chemical oxygen demand (COD) determines the oxygen required for chemical oxidation of most organic matter and oxidizable inorganic substances with the help of strong chemical oxidant. In conjunction with the BOD, the COD test is helpful in indicating toxic conditions and the presence of biologically resistant organic substances (Sawyer and McCarty 1978). In this study the BOD values ranged from 17-128 mg/l. There was reduction of 66% in BOD after the algal pond and 23% removal in the water which flows out of the lake. The COD values ranged from 16 to 161 mg/l. The COD reduced by 45% in the algae pond and 32 % in the lake as shown in Figure 4.
6.0 Integrated Wastewater Management System
The treatment of domestic sewage in natural systems such as constructed wetlands and lagoons is being practiced in developing nations. Significant advantages are its construction and operation are simple and economically viable. Lagoon systems are associated with a high growth rate of phytoplankton that are beneficial and are caused by the influence of light and the continuous nutrient inflow. Algal growth contributes towards the treatment of wastewater by transforming dissolved nutrients into particle aggregates (biomass). Algal retention in the lagoon helps in the treatment, which has to be harvested at regular interval to ensure effective treatment. Wetlands consisting of reed-bed and algal pond help in the removal of nutrients (Mahapatra et al., 2011; 2013).
Emergent macrophytes (such as Typha) act as a filter in removing suspended matter and avoiding anaerobic conditions by the root zone oxidation and the dissolved nutrients would be taken up by the lagoon algae. This type of treatment helps in augmenting the existing treatment system in complete removal of nutrients and bacteria. The combination of wetlands (with macrophytes assemblages), algal lagoon and a sustained harvesting of algae and macrophytes would provide complete solution to wastewater treatment systems with minimal maintenance. Integrated wetland system at Jakkur provides an opportunity to assess the efficacy of treatment apart from providing insights for replicating similar systems to address the impending water scarcity in the rapidly urbanising Bangalore.
6.1 Insights to the efficacy of treatment: The treatment plant (1.6 Ha) with an installed capacity of 10 MLD, comprises of an Upflow Anaerobic Sludge Balnket Reactor (UASB) with an extended aeration system for sewage treatment. The treatment effluent then gets into wetlands (settling basin) of spatial extent ~4.63 hecatres consisting of diverse macrophytes such as Typha sp., Cyperus sp., Ludwigia sp., Alternanthera sp., Water hyacinth sp., etc. in the shallow region (with an area of ~1.8 hectares) followed by deeper algal basin (covering an area of about 2.8 hecatre). This being the significant functional component with macrophytes and algae jointly helps in the nutrient removal and wastewater remediation. The water from the settling basin flow pases through three sluices of which only the middle one is functional (with moderate flow). This water flows into Jakkur lake that spans over 45 hectares. There were notably less occurance of floating macrophytes, except near the outfalls (~0.5 Ha) due to blockage of the ouflow channels by solid wastes and debris. These macrophytes are being managed by local fishermen. Water in the Jakkur lake is clear with abundant phytoplankton diversity and acceptable densities, which indicates of a healthy trophic status.
The nutrient analysis shows (illustrated in Figure 4), that treatment happens due to immergent macrophytes of the wetlands and algae, which removes ~45% COD, ~66 % BOD, ~33 % NO3-N and ~40 % PO43-P. Jakkur lake treats the water and acts as the final level of treatment which shown as stage two that removes ~ 32 % COD, ~23% BOD, ~ 0.3 % NO3-N and ~34 % PO43-P.. The synergestic mechanism of sewage treatment plants followed by wetlands helps in the complete removal of nutrients to acceptable levels according to CPCB norms.
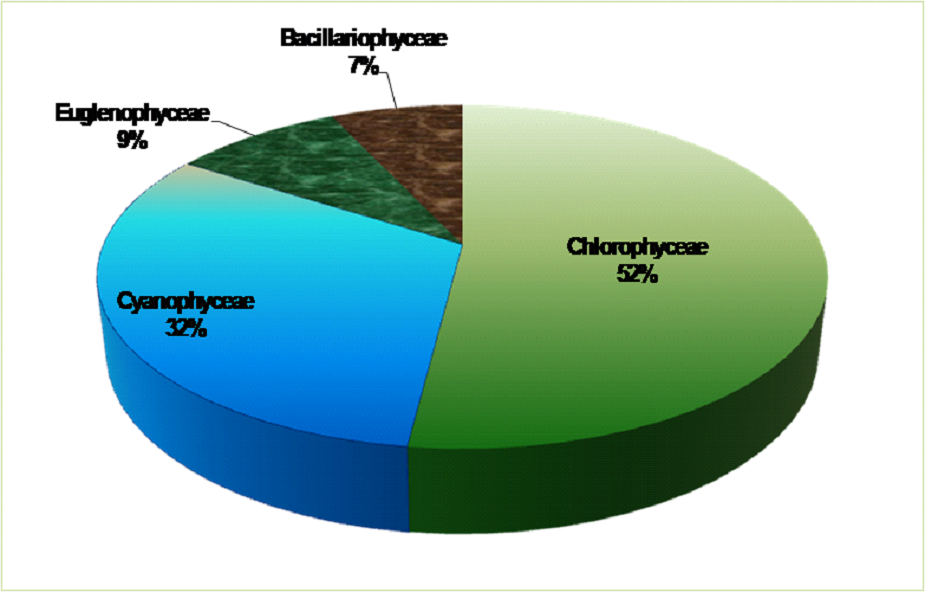
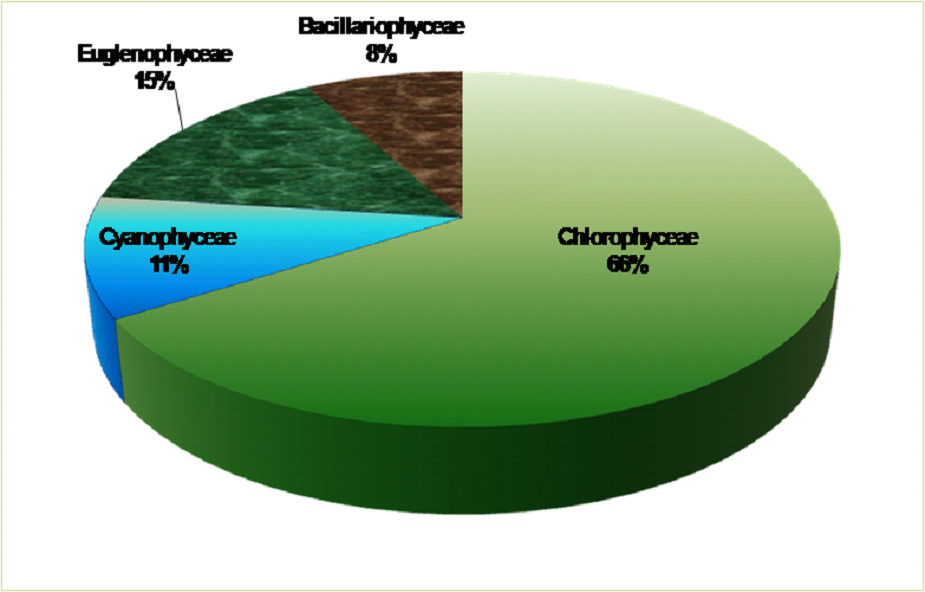
Jakkur STP (of 10 MLD capacity) treats only 6 MLD of sewage that is drawn from Yelhanka town. Yet, It is observed that sewer channel carrying voluminous wastewater with the treatment plant effluents into wetlands. The major nutrient removal and polishing is done by the manmade wetland and the lake. This wetland comprise of emergent macrophytes as Typha augustata, etc and plays a key role in oxygenation of soil subsystems through root zone oxidation and entrapment of necessary nutrients that otherwise would cause an algal bloom in the lake. The algal species in this manmade wetland region (Figure 5) primarily comprised of memebers of chlorophyceae followed by cyanophyceae, eugelnophyceae and bacillariophyceae (Figure 6). The relative abundances are provided in the pie-diagrams below. The detailed list of algal species, their presence and absence have been listed and provided in Table 4.
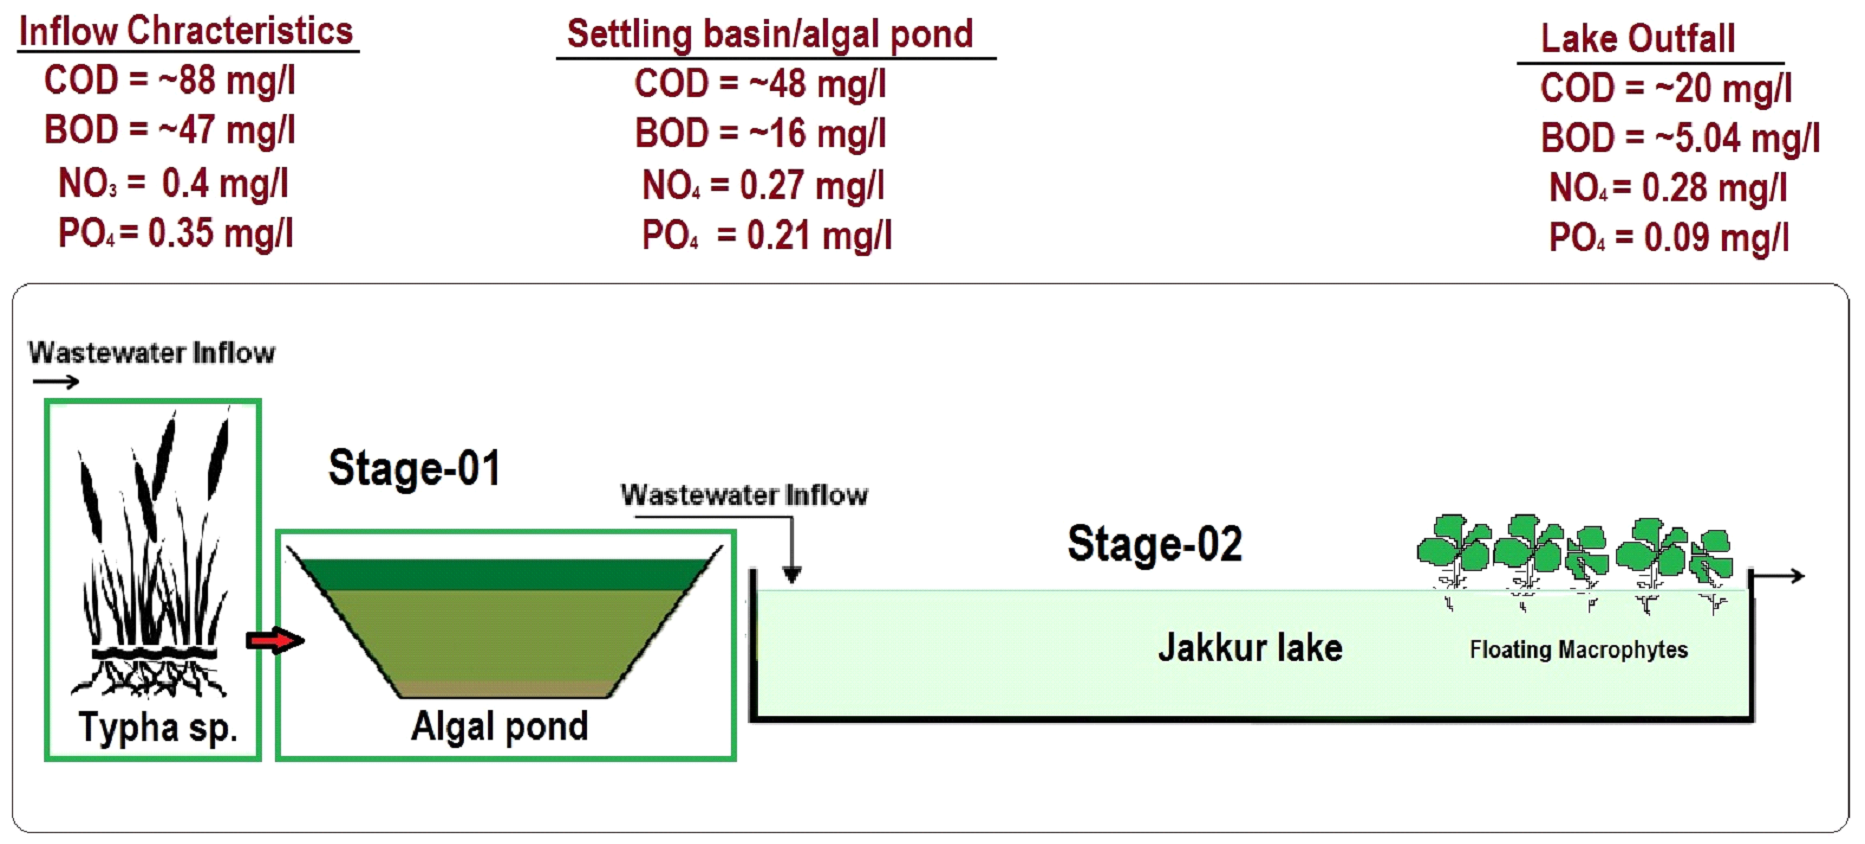
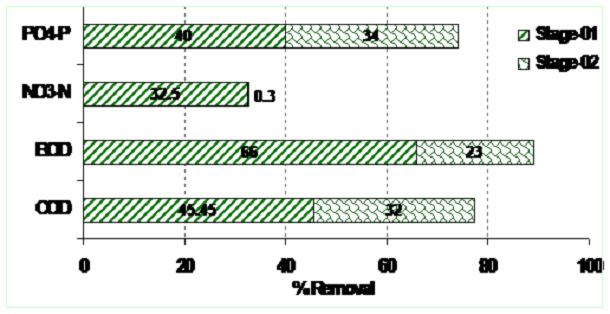
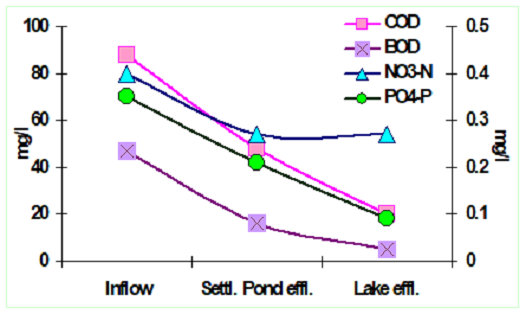
Figure 4: Integrated wastewater management system
Table 4: Algal species in Jakkur lake system
S.No |
Algae |
Site1 |
Site2 |
Site3 |
Site4 |
Site5 |
Site6 |
Site7 |
Site8 |
Site9 |
1 |
Actinastrum sp. |
+ |
+ |
+ |
+ |
+ |
+ |
+ |
+ |
+ |
2 |
Anabaena sp. |
+ |
+ |
+ |
+ |
|||||
3 |
Ankistrodesmus sp. |
+ |
+ |
+ |
+ |
|||||
4 |
Aphanocapsa sp. |
+ |
+ |
+ |
+ |
+ |
+ |
+ |
||
5 |
Arthrodesmus sp. |
+ |
+ |
+ |
+ |
+ |
||||
6 |
Asterococcus sp. |
+ |
+ |
+ |
+ |
+ |
+ |
+ |
+ |
|
7 |
Chlorella sp. |
+ |
+ |
+ |
+ |
+ |
+ |
+ |
+ |
+ |
8 |
Chroococcus sp. |
+ |
+ |
+ |
+ |
+ |
+ |
+ |
||
9 |
Cladophora sp. |
+ |
||||||||
10 |
Closterium sp. |
+ |
+ |
+ |
+ |
+ |
+ |
+ |
+ |
+ |
11 |
Coelastrum sp. |
+ |
+ |
+ |
+ |
+ |
+ |
+ |
||
12 |
Coelosphaerium sp. |
+ |
||||||||
13 |
Coenocystis sp. |
+ |
||||||||
14 |
Cosmarium sp. |
+ |
+ |
+ |
+ |
+ |
+ |
+ |
+ |
|
15 |
Crucigenia sp. |
+ |
+ |
+ |
+ |
+ |
+ |
+ |
+ |
+ |
16 |
Cyclotella sp. |
+ |
+ |
+ |
+ |
+ |
+ |
+ |
+ |
|
17 |
Cymbella sp. |
+ |
+ |
|||||||
18 |
Desmodesmus sp. |
+ |
+ |
+ |
||||||
19 |
Dictyococcus sp. |
+ |
+ |
+ |
+ |
+ |
+ |
+ |
||
20 |
Dictyosphaerium sp. |
+ |
+ |
+ |
+ |
+ |
+ |
+ |
+ |
|
21 |
Eudorina sp. |
+ |
||||||||
22 |
Euglena spp. |
+ |
+ |
+ |
+ |
+ |
+ |
+ |
+ |
+ |
23 |
Glaucocystis sp. |
+ |
+ |
+ |
+ |
|||||
24 |
Gloeocystis sp. |
+ |
||||||||
25 |
Golenkinia spp. |
+ |
+ |
+ |
+ |
|||||
26 |
Gomphonema sp. |
+ |
||||||||
27 |
Gonium spp. |
+ |
+ |
+ |
+ |
+ |
+ |
+ |
+ |
+ |
28 |
Gyrosigma sp. |
+ |
||||||||
29 |
Krichenerilla sp. |
+ |
+ |
+ |
+ |
+ |
+ |
+ |
+ |
+ |
30 |
Limnothrix sp. |
+ |
+ |
+ |
+ |
+ |
||||
31 |
Melosira sp. |
+ |
+ |
+ |
+ |
+ |
+ |
+ |
||
32 |
Merismopedia sp. |
+ |
+ |
+ |
+ |
+ |
+ |
+ |
||
33 |
Micracitinium sp. |
+ |
+ |
+ |
+ |
+ |
+ |
+ |
+ |
|
34 |
Microcystis sp. |
+ |
+ |
+ |
+ |
+ |
+ |
|||
35 |
Monoraphidium sp. |
+ |
+ |
+ |
+ |
+ |
+ |
+ |
+ |
|
36 |
Navicula sp. |
+ |
+ |
+ |
+ |
+ |
+ |
+ |
||
37 |
Nephrocystis sp. |
+ |
||||||||
38 |
Nitzschia sp. |
+ |
+ |
+ |
+ |
+ |
+ |
+ |
||
39 |
Oocystis sp. |
+ |
+ |
+ |
+ |
+ |
+ |
+ |
||
40 |
Ophiocytium sp. |
+ |
||||||||
41 |
Oscillatoria sp. |
+ |
+ |
+ |
+ |
|||||
42 |
Pandorina sp. |
+ |
+ |
+ |
+ |
|||||
43 |
Pediastrum sp. |
+ |
+ |
+ |
+ |
+ |
+ |
+ |
+ |
|
44 |
Phacus spp. |
+ |
+ |
+ |
+ |
+ |
+ |
+ |
+ |
+ |
45 |
Phormidium sp. |
+ |
+ |
+ |
+ |
+ |
+ |
+ |
||
46 |
Pinnularia sp. |
+ |
+ |
|||||||
47 |
Plantothrix |
+ |
+ |
+ |
||||||
48 |
Pseudanabaena sp. |
+ |
||||||||
49 |
Quadrigula sp. |
+ |
+ |
+ |
+ |
+ |
+ |
|||
50 |
Radiocystis sp. |
+ |
+ |
+ |
+ |
+ |
+ |
+ |
||
51 |
Scenedesmus spp. |
+ |
+ |
+ |
+ |
+ |
+ |
+ |
+ |
+ |
52 |
Schroederia sp. |
+ |
+ |
+ |
+ |
+ |
+ |
|||
53 |
Spirulina sp. |
+ |
+ |
+ |
+ |
+ |
+ |
+ |
||
54 |
Staurastrum sp. |
+ |
||||||||
55 |
Stichococcus sp. |
+ |
+ |
+ |
+ |
+ |
+ |
+ |
||
56 |
Surirella sp. |
+ |
+ |
+ |
||||||
57 |
Synechococcus sp. |
+ |
||||||||
58 |
Synedra sp. |
+ |
+ |
+ |
+ |
|||||
59 |
Synura sp. |
+ |
||||||||
60 |
Tetraedron spp. |
+ |
+ |
+ |
+ |
+ |
+ |
+ |
+ |
+ |
61 |
Tetraedron spp. |
+ |
||||||||
62 |
Tetrastrum sp. |
+ |
+ |
|||||||
63 |
Trachelomonas sp. |
+ |
+ |
+ |
||||||
64 |
Xanthidium sp. |
+ |
Figure 6: Composition of algae in Jakkur Lake
Figure 5: Composition of algae in Man Made Wetland System
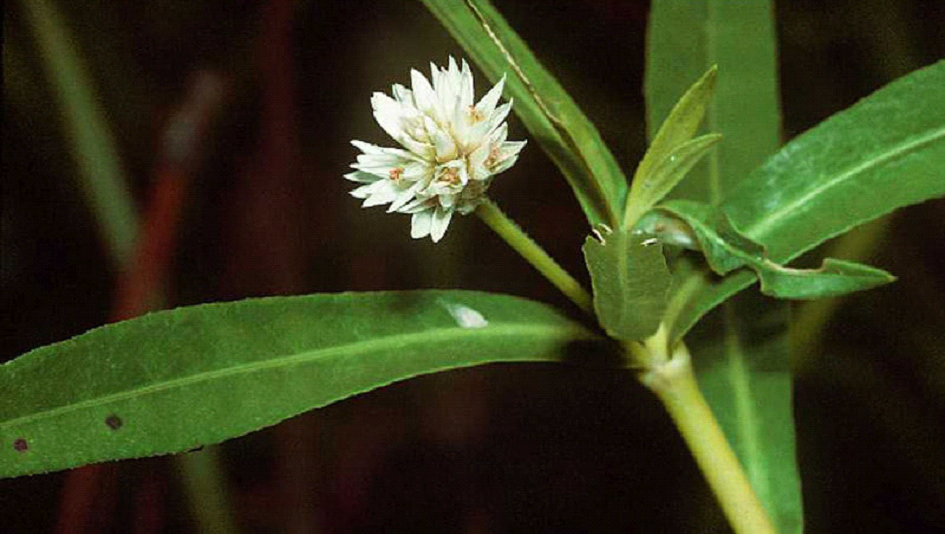
Similarly macrophytes play an important role in the effluent stabilisation. Table 5 lists the prominent macrophytes of wetlands ecosystem at Jakkur. The distribution of the macrophytes in the wetland area as well as at the outfalls of the lake is provided in Figure 7. Typha augustata species were dominating (54%) in the wetland area followed by Alternanthera philoxeroides (28%). However even though the macrophyte population was scarce in the lake, but still amongst them Eicchornia crassipes (84%) were dominating (Figure 8), which were only restricted to the outlet reaches due to fish nets, deployed for fishing in core area.
Figure 7: Composition of Macrophytes in Man Made Wetland System
Figure 8: Composition of Macrophytes in Jakkur Lake
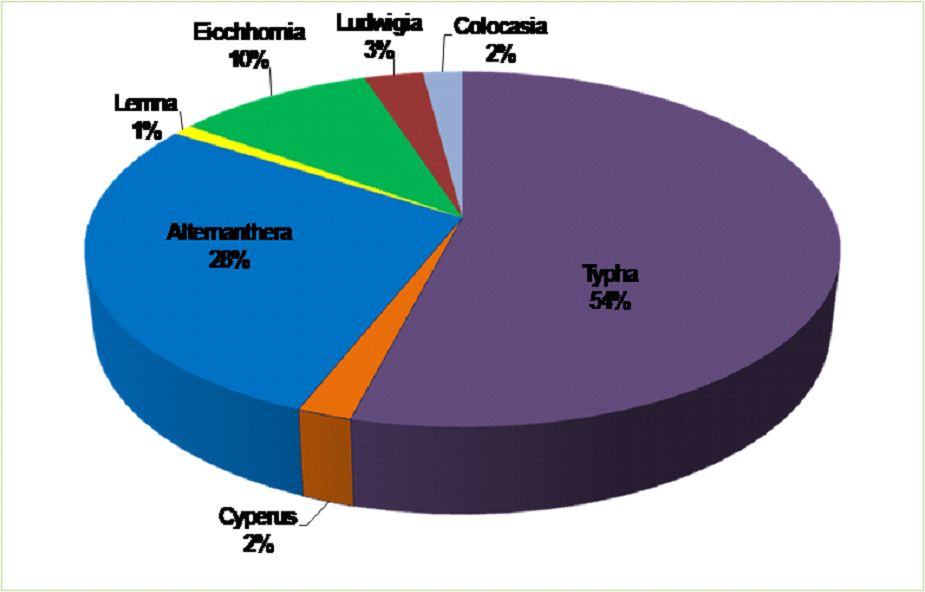
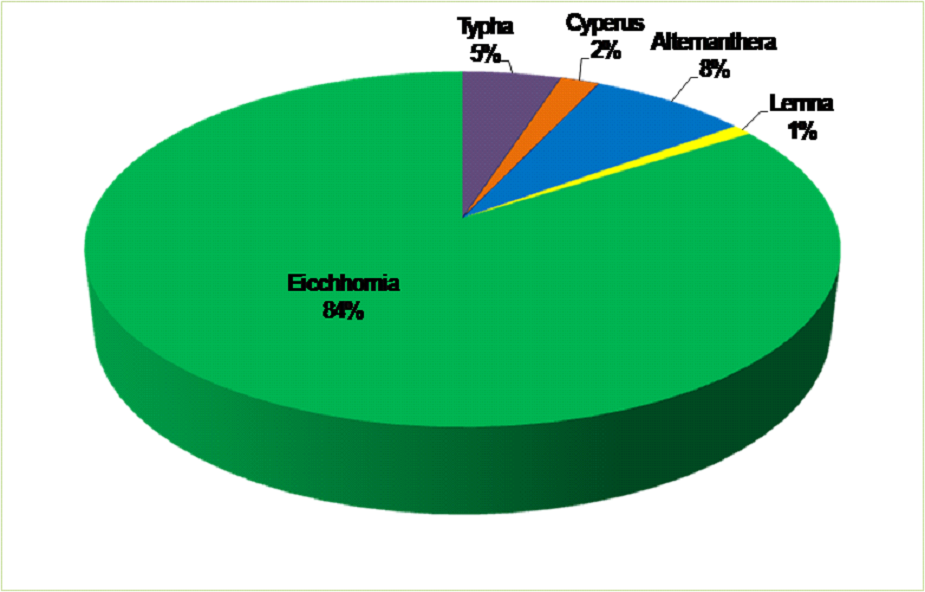
Table 5: Macrophytes of Wetlands at Jakkur
Name: Lemna Common name: Common duckweed Lemna minor: free-floating aquatic plants, with one, two or three leaves each with a single root hanging in the water; as more leaves grow, the plants divide and become separate individuals. The root is 1-2cm long. The leaves are oval, 1-8mm long and 0.6-5mm broad, light green, with three (rarely five) veins, and small air spaces to assist flotation. It propagates mainly by division, and flowers rarely produced. Habitat: Grows in water with high nutrient levels and a pH of between 5 and 9, optimally between 6.5 and 7.5, and temperatures between 6 and 33 oC. Significance: Important food resource for fish and birds(ducks) |
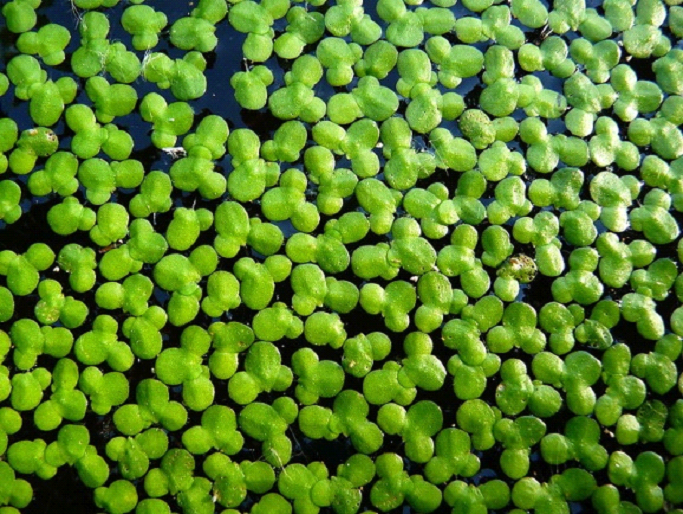 Lemna minor 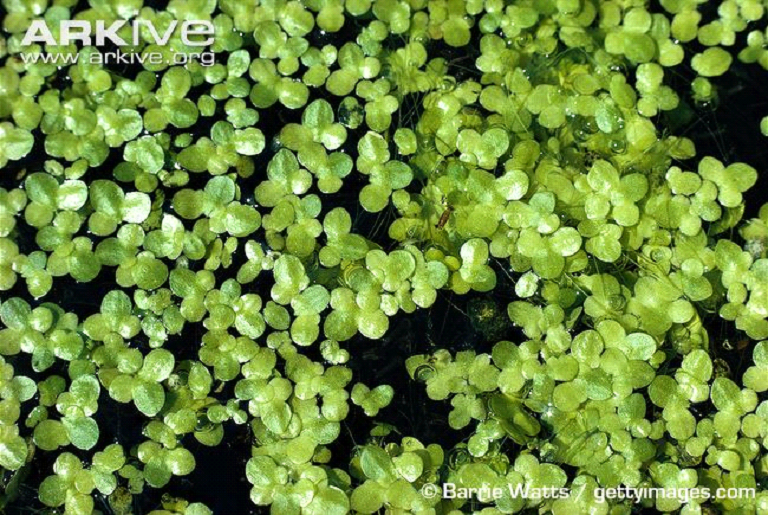 Lemna gibba |
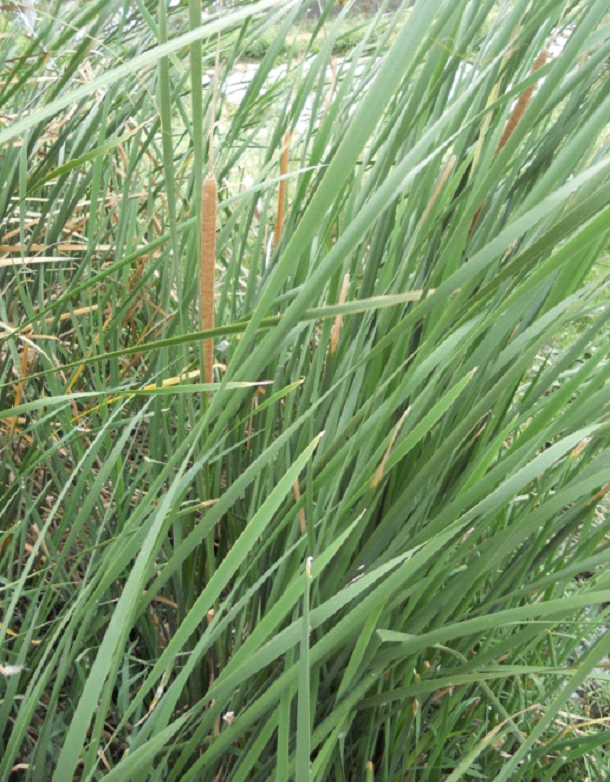
Name: Cyperus It is a perennial plant, which may reach a height of up to 40 cm. Common name: nut grass, nut sedge Habitat: Cyperus is found in cultivated fields, farmlands, neglected areas, wastelands, grasslands, at the edges of forests, and on roadsides, sandy or gravelly shores, riverbanks and irrigation canal banks. Grow profusely in nutrient rich environment. Leaves: Leaves sprout in ranks of three from the base of the plant. The flower stems have a triangular cross-section. The flower is bisexual and has 3 stamina and a three-stigma carpel. The fruit is a three-angled achene. Rhizome: The root system of a young plant initially forms white, fleshy rhizomes. Some rhizomes grow upward in the soil, then form a bulb-like structure from which new shoots and roots grow, and from the new roots, new rhizomes grow. Other rhizomes grow horizontally or downward, and form dark reddish-brown tubers or chains of tubers. Harvesting period: November/December Impacts/significance: It is a weed and the world's worst invasive weed based on its distribution and effect on crops. It contains several chemical compounds and used in medicines. |
  |
Name: Ludwigia Common name: Water Primrose, Water Dragon, marshy jasmine Habitat: Still or slow flowing freshwater habitats, occurring in marshes, swamps, ditches, ponds, and around lake margins, where they form dense floating mat. Shallow, nutrient-rich ponds, lakes, and drainage ditches provide ideal conditions for abundant growth of this weed. Aquatic floating herb, floats crowded at nodes, white Leaves alternate simple, ovate, obtuse entire Flowers: Axillary, solitary, peduncle 2.5 cm long, corolla 5, yellow, inserted on the rim of the disc, base narrow. Flowering: February-July Harvesting period: August Impacts: Once established, however, it forms dense, monotypic stands along shorelines and banks and then begins to sprawl out into the water and can form floating islands of vegetation. At this point, Ludwigia can clog waterways, damage structures and dominate native vegetation. Large accumulations of this species can lead to a depletion of oxygen levels in the water while also competing with native species for space and resources. |
  |
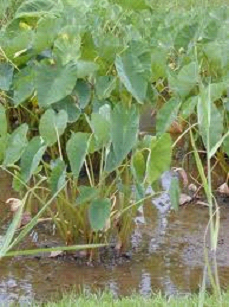
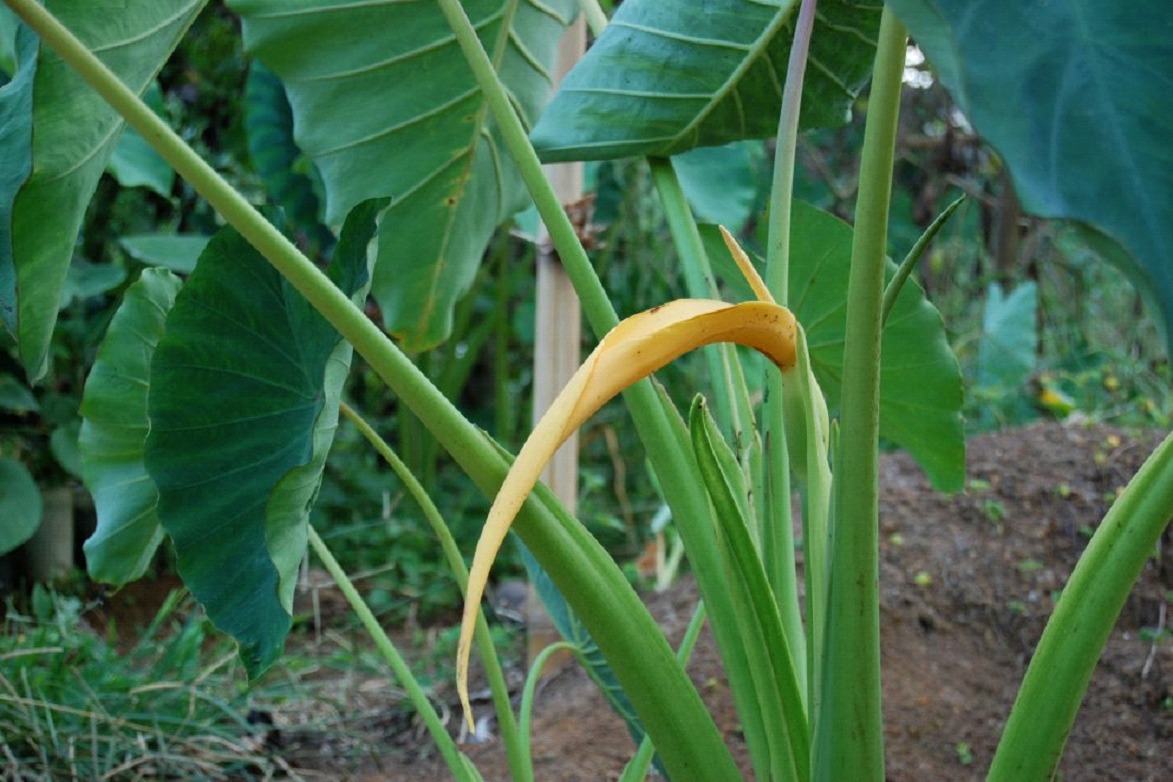
Name: Colocasia Common name: Green Taro, cocoyam Habitat: This species usually grows in wet fields and near the banks of ponds and streams. Description: plant is a perennial herb with clusters of long heart- or arrowhead-shaped leaves It produces heart shaped leaves 2-3 ft long and 1-2 ft across on 3 ft long stalks that all emerge from an upright tuberous rootstock, corm. The stems are usually several feet high. Plant bears a short underground stem called a corm, where the plant stores starch produced by the leaves. The inflorescence is a pale green spathe and spadix Flowers tiny, densely crowded on upper part of fleshy stalk, with female flowers below and male flowers above. Fruit a small berry, in clusters on the fleshy stalk. Significance: the plant is used for several purposes across the worlds such as fodder, medicine or as an ornamental plant |
  |
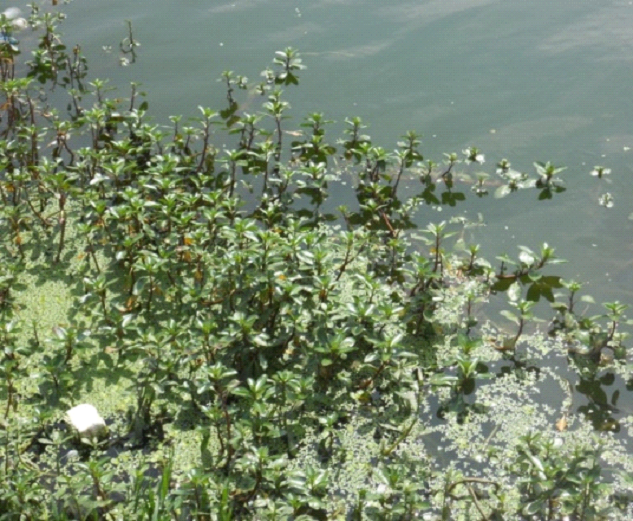
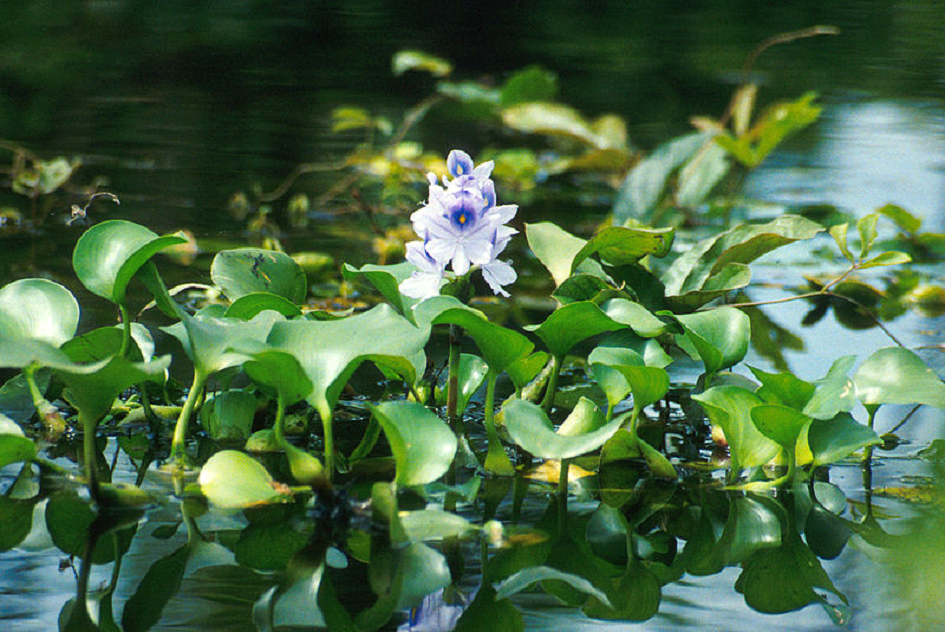
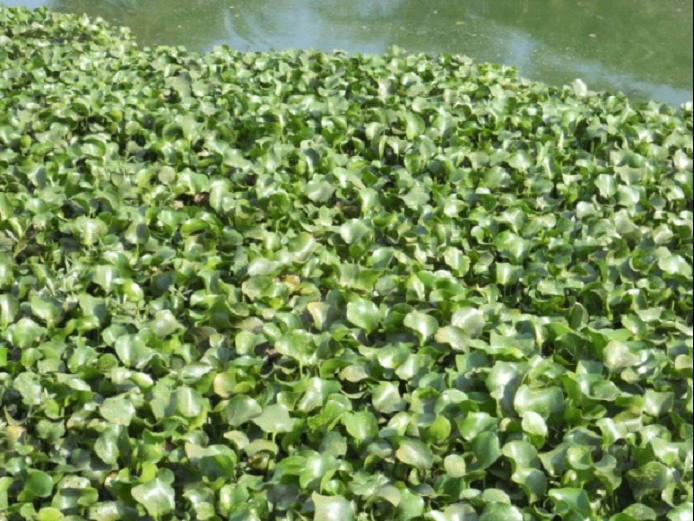
Name: Eichhornia crassipes Common Name: Water hyacinth Description: Water hyacinth is a free-floating perennial aquatic plant, with broad, thick, glossy, ovate leaves; leaves are 30-40 cm long with spongy petiole. Roots are fibrous and featherlike. Flowering: March-July Harvesting period: August Habitat: Water hyacinth grows in still or slow-flowing fresh water in tropical and temperate climates. Optimum growth occurs at temperatures of between 28oC and 30oC, and requires abundant nitrogen, phosphorus and potassium. Impact: Its wide spread occurrence in the fresh water lakes and riverbeds is harmful to fishing (depleting DO), rowing, and depleting water content from the water bodies and interfering in water utilization and other activities. Water hyacinth by its abundance of leaves, dense vegetation and innumerable rootlets in tertiary manner obstruct water flow in irrigation channels and displaces many aquatic grasses, which were useful as fodder for cattle, and suppresses the phytoplankton growth. Water hyacinth provides suitable breeding places for mosquitoes and other disease-carrying insects by stagnating the water in ditches and shallow areas. Uses: Phytoremediation, wastewater treatment |
  |
7.0 Land use (LU) Dynamics in Wetlands Catchment
Land use changes in the wetland catchments are the direct and indirect consequence of human actions to secure essential resources. These changes encompass the greatest environmental concerns of human populations today, including loss of biodiversity, pollution of water and soil, and changes in the climate. Monitoring and mitigating the negative consequences of LU changes, while sustaining the production of essential wetlands resources has therefore become a major priority today.
Land use change analyses is done using Landsat MSS (1973), IRS P6 data (2013) and Google Earth (http://earth.google.com). The Landsat data is cost effective, with high spatial resolution and freely downloadable from public domains like GLCF (http://glcfapp.glcf.umd.edu:8080/esdi/index.jsp) and USGS (http://glovis.usgs.gov/). IRS P6 LISS-IV (Indian Remote Sensing Satellite, part of the Indian Space Programme) data was procured from the National Remote Sensing Centre, Hyderabad (http://www.nrsc.gov.in).
Remote sensing data obtained were geo-referenced, rectified and cropped corresponding to the study area. Geo-registration of remote sensing data (Landsat data) has been done using ground control points collected from the field using pre calibrated GPS (Global Positioning System) and also from known points (such as road intersections, etc.) collected from geo-referenced topographic maps published by the Survey of India. In the correction process numerous GCP's are located in terms of their two image coordinates; on the distorted image and in terms of their ground coordinates typically measured from a map or located in the field, in terms of UTM coordinates as well as latitude and longitude. The Landsat data of 1973 are with a spatial resolution of 57.5 m x 57.5 m (nominal resolution), while IRS P6 are of 5.8 m.
Land use analyses involved (i) generation of False Color Composite (FCC) of remote sensing data (bands-green, red and NIR). This composite image helps in locating heterogeneous patches in the landscape, (ii) selection of training polygons by covering 15% of the study area (polygons are uniformly distributed over the entire study area) (iii) loading these training polygons co-ordinates into pre-calibrated GPS, (vi) collection of the corresponding attribute data (land use types) for these polygons from the field. GPS helped in locating respective training polygons in the field, (iv) supplementing this information with Google Earth and (v) 60% of the training data has been used for classification, while the balance is used for validation or accuracy assessment. The land use analysis was done using supervised classification technique based on Gaussian maximum likelihood algorithm with training data (collected from field using GPS).
Classifier based on Gaussian Maximum Likelihood algorithm has been widely applied as an appropriate and efficient classifier to extract information from remote sensing data. This approach quantitatively evaluates both the variance and covariance of the category spectral response patterns when classifying an unknown pixel of remote sensing data, assuming the distribution of data points to be Gaussian. After evaluating the probability in each category, the pixel is assigned to the most likely class (highest probability value). GRASS GIS (Geographical Resources Analysis Support System, http://ces.iisc.ac.in/grass) a free and open source software with the robust support for processing both vector and raster data has been used for analyzing RS data. Temporal remote sensing data have been classified through supervised classification techniques by using available multi-temporal "ground truth" information. Earlier time data were classified using the training polygon along with attribute details compiled from the historical published topographic maps, vegetation maps, revenue maps, land records available from local administrative authorities.
Figure 9: Land use dynamics in Jakkur lake catchment |
|||||||
1973 (57M) 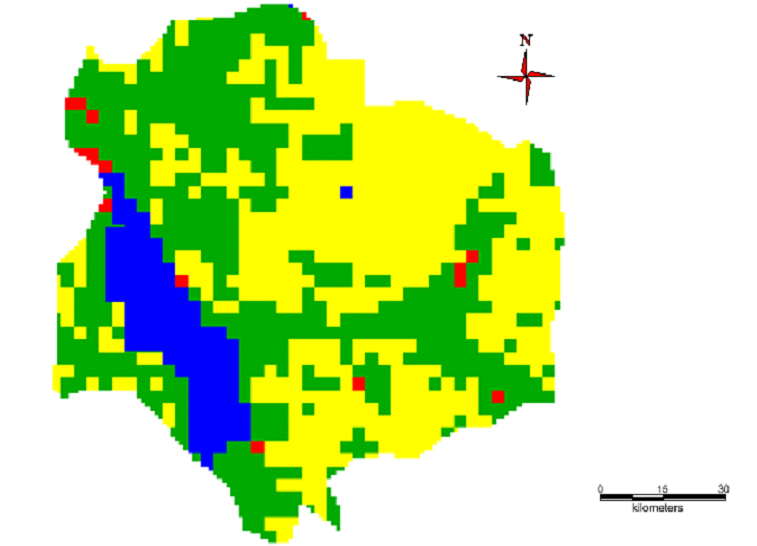 |
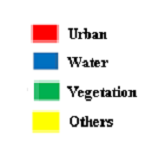 |
2013 (2.7M) 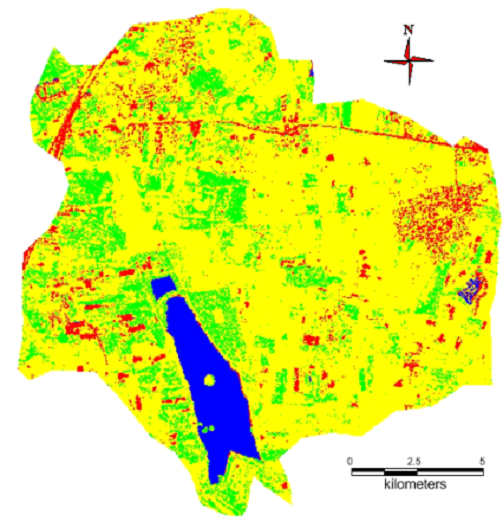 |
|||||
Table 6: Land use changes in Jakkur lake catchment (1973 -2013) |
|||||||
Land Use categories (%) |
|||||||
Years |
Urban |
Vegetation |
Water |
Others |
|||
1973 |
1.19 |
44.06 |
5.63 |
49.1 |
|||
2013 |
6.56 |
22.38 |
4.79 |
65.81 |
|||
% Change |
5.37 |
-21.68 |
-0.84 |
18.71 |
|||
Temporal remote sensing data of Landsat (1973) and IRS data (2013) were classified into four land use categories (Figure 9): tree vegetation, built-up, water-bodies and others (agriculture, open area, etc.). The analyses show decline of tree vegetation by 50% from 44.06% (1973) to 22.38% (2013), with an increase in built-up from 1.19 (1973) to 6.56% (2013). Details of land use analyses are listed in Table 6.
8.0 Integrated Wetlands Ecosystem: Sustainable Model to Mitigate Water Shortage in Bangalore
Performance assessment of an integrated wetland ecosystem at Jakkur provides vital insights towards mitigating water crisis in Bangalore. An integrated system as outlined in Figure 10. The integration of sewage treatment plant with wetlands (consisting of reed bed and algal pond) has helped in sustained treatment of water for reuse.
Figure 10: Integrated wetlands system for managing water and wastewater
8.1 Functional aspects of the integrated wetlands systems are:
- Sewage Treatment Plant (STP): The purpose of sewage treatment is to remove contaminants (Carbon and solids) from sewage to produce an environmentally safe water. The treatment based on physical, chemical, and biological processes include three stages - primary, secondary and tertiary. Primary treatment entails holding the sewage temporarily in a settling basin to separate solids and floatables. The settled and floating materials are filtered before discharging the remaining liquid for secondary treatment to remove dissolved and suspended biological matter. STP's effluents were still nutrient rich requiring further treatment (for nutrient removal) and stabilization for further water utilities in the vicinity.
- Integration with wetlands [consisting of reed (typha etc.) beds and algal pond] would help in the complete removal of nutrients in the cost effective way. A nominal residence time (~5 days) would help in the removal of pathogen apart from nutrients. However, this requires regular maintenance of harvesting macrophytes and algae (from algal ponds). Harvested algae would have energy value, which could be used for biofuel production. The wetland systems helps in the removal of ~77 % COD, ~90% BOD, ~33% NO3-N and ~75% PO43-P (Figure 11).
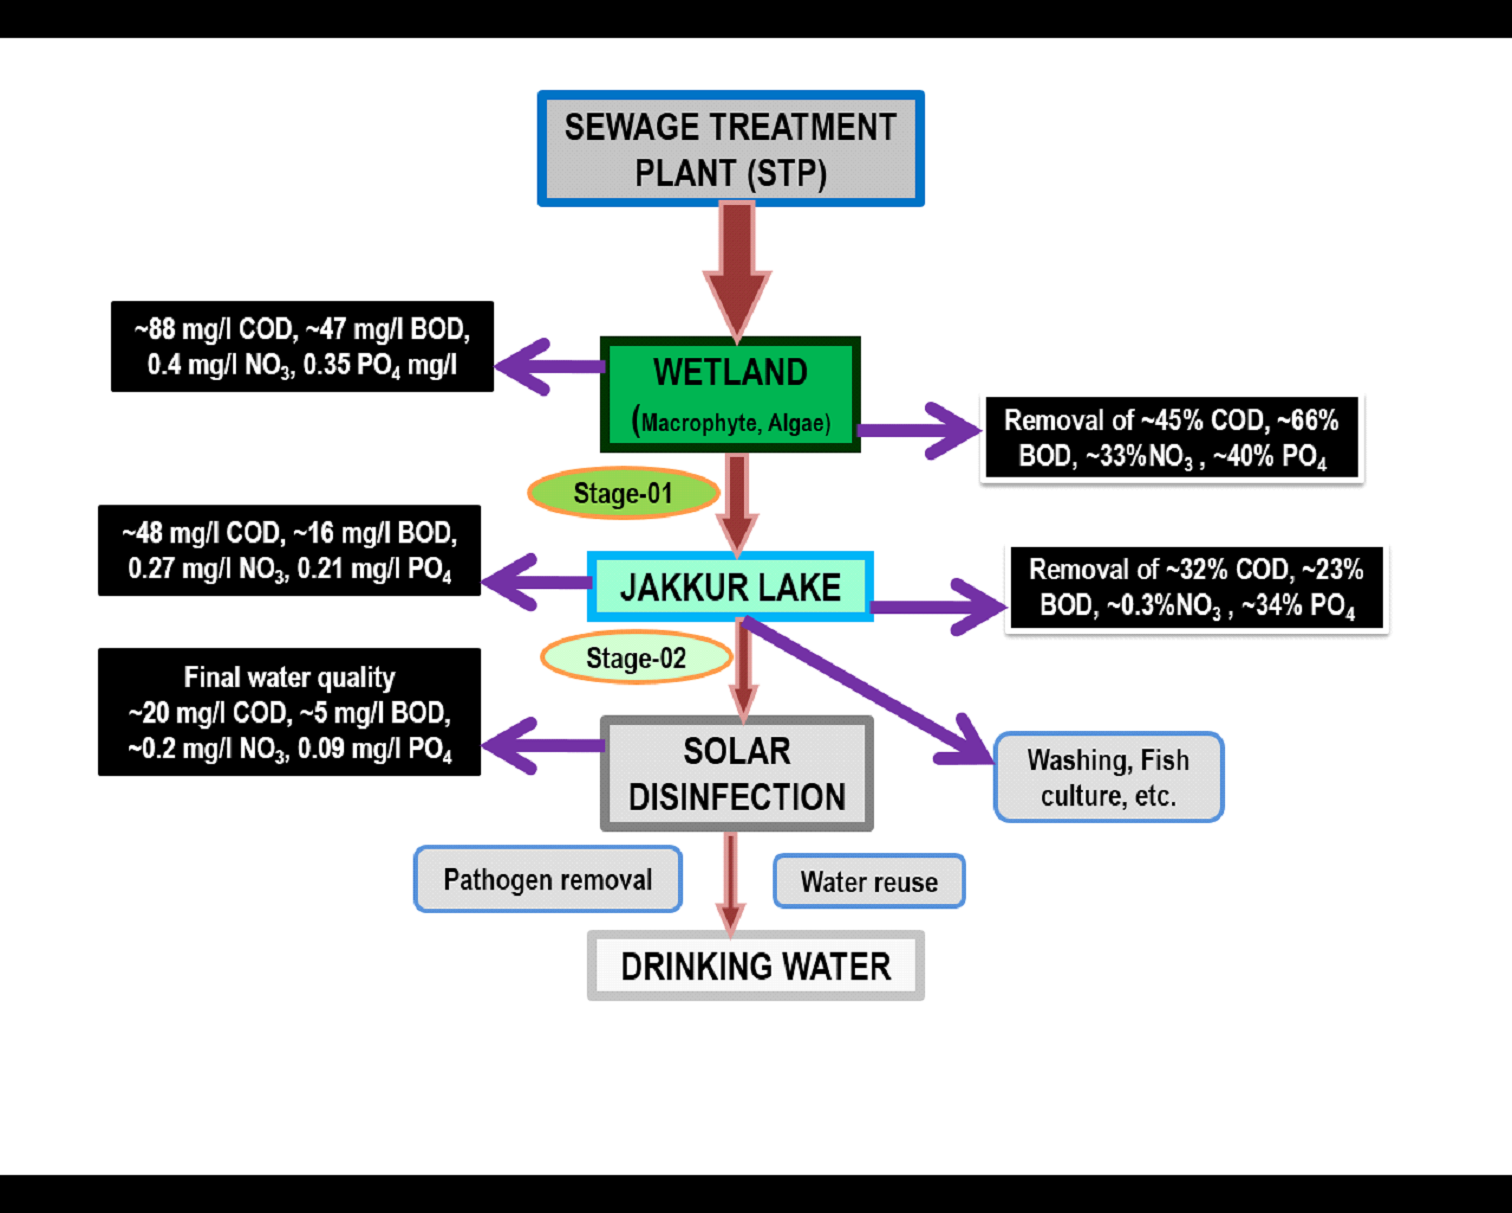
Figure 11: Level of treatment at various stages of integrated wetlands system
Pilot scale experiment in the laboratory has revealed nutrient removal of algae are 86%, 90%, 89%, 70% and 76% for TOC, TN, Amm.-N, TP and OP respectively (Figure 11) and lipid content varied from 18-28.5 % of dry algal biomass. Biomass productivity is of ~122 mg/l/d and lipid productivity of ~32 mg/l/d. Gas chromatography and mass spectrometry (GC-MS) analysis of the fatty acid methyl esters (FAME) showed a higher content of desirable fatty acids (biofuel properties) with major contributions from saturates such as palmitic acid [C16:0; ~40%], stearic acid [C18:0; ~34%] followed by unsaturates as oleic acid [C18:1(9); ~10%] and linoleic acid [C18:2(9,12); ~5%]. The decomposition of algal biomass and reactor residues with calorific exothermic heat content of 123.4 J/g provides the scope for further energy derivation (Mahapatra et al., 2014). Water that comes out of the wetlands is portable with minimal efforts for pathogen removal via solar disinfection.
Our earlier experiments have shown the vital role of wetlands in recharging the groundwater resources, evident from the decline of groundwater table to 200-300 m from 30 to 50 m with the removal of wetlands. This means, Jakkur lake system is helping in recharging the groundwater sources. There need to be regulation on the exploitation of groundwater in Bangalore. Over exploitation of groundwater through borewells by commercial private agencies would harm the sustainability, depriving the local residents in the vicinity who are dependent on borewells in the absence of piped water supply from the government agency.
Measures required to mitigate water crisis in burgeoning Bangalore are: