 |
Sahyadri ENews: LXIX
HYDRO-ECOLOGICAL FOOTPRINT OF SHARAVATHI RIVER BASIN
|
 |
Issues:
1
2
3
4
5
6
7
8
9
10
11
12
13
14
15
16
17
18
19
20
21
22
23
24
25
26
27
28
29
30
31
32
33
34
35
36
37
38
39
40
41
42
43
44
45
46
47
48
49
50
51
52
53
54
55
56
57
58
59
60
61
62
63
64
65
66
67
68
HYDRO-ECOLOGICAL FOOTPRINT OF SHARAVATHI RIVER BASIN
(PDF)
Vinay. S1,2, Bharath, S1, Chndran, M. D. S1,Bharath, H. A1,3, Shashishankar, A2,4, Ramachandra. T. V1
1Energy and Wetlands Research Group, Centre for Ecological Sciences, Indian Institute of Science, Bangalore
2Visvesvaraya Technological University, Belgaum
3RCGSIDM, IIT Kharagpur, Kharagpur
4AMC Engineering College, Bannerghatta Road, Bangalore
4. Results and Discussion:
Land use of Sharavathi basin is depicted in Figure 5 and Table 1. Sharavatiriver has 3 major storage structures namely Linganamakki, Mahatma Gandhi Balancing reservoir and Gersoppa. The water bodies in Sharavati cover about 6.9% of the catchment area. Forests of Sharavathi (Figure 6) cover about 42.8% of catchment area of which evergreen forests cover 19.6%, deciduous forest cover 14.6%. Sharavathi eastern regions are comparatively flat as against the Ghats and are rich with tropical savannas whereas the Ghats are dominated by evergreen forest patches with deciduous species. Due to presence of diversion works, the valleys are rich in horticulture and agriculture which together contribute to 26.1%. Monoculture such as Cashew, Acacia, Eucalyptus, Teak are found across the basin, contributing to 22.1% of Sharavati landscape. Built up area in the catchment is about 1%, concentrated primarily at the Coastal City of Honavar, Talaguppa
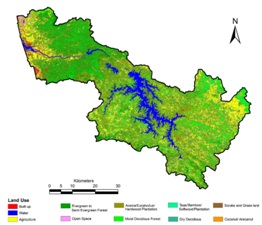 Figure 5: Sharavati Basin Land use
| Land use |
Area |
| Built up |
1.0% |
| Water |
6.9% |
| Crop land |
14.1% |
| Open Space |
1.1% |
| Deciduous |
14.1% |
| Evergreen - Semi Evergreen Forest |
19.6% |
| Scrub/Grass land |
9.1% |
| Acacia/Eucalyptus/Casuarina |
13.6% |
| Teak/Bamboo/Cashew |
8.5% |
| Arecanut/Coconut |
12.0% |
Table 1: Land use statistics of Sharavati river basin
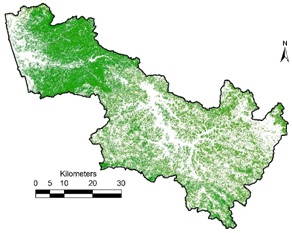 Figure 6: Forest cover of Sharavati basin
Flow measurements were carried out at 10 stations as depicted in figure 7. Closer to the coasts in the transition zones towards the Ghats, Chikkolli and Gundbala rivers were monitored, whereas towards the Ghats five streams in Kattalekan, two in Kodkani and one at Hulkodu were monitored. Chikkolli is sub water shed of Gundbala river catchment, similarly Kattalekan sites1, 2 and 3 are sub catchments of stream Kattalekan site 5. Among all the watersheds Hulkodu was the smallest with an area nearly 9 hectares, followed by Kattalekan site 2 with 11 hectares, whereas Gundbala has highest catchment area of 130.6 sq.km. Land use variation along these stream catchments are as shown in figure 8 and described in tables 2 and 3. Land use assessment shows that all the catchments have good forest cover over 60%. Kodkani site 1 and site 2 had forest cover close to 61% and 63% respectively with evergreen forest cover close to 48.5%, agriculture lands in the valley zone contributed to over 18.3% and 22.1% of the catchment area, grasslands on the hilltops in both catchments covered nearly 9.5% of the area. Hulkod being smallest of the gauged catchments had evergreen forest covering 68.5% and grasslands covering 31.5% towards the hilltops. All other seven catchments had forest cover over 84%. Gundbala and Chikkolli is dominated with horticulture activities and agriculture in the valley zones contributing 7 to 10% of the catchment area. Of the five stations monitored at Kattalekan, field observations revealed that only Kattalekan site 4 and Kattalekan site 5 had horticulture and agriculture activities. Stream flow dynamics across the selected catchments are depicted in Figures 9 to 11. and summarized in tables 2 and 3. Streams gauged at sites namely Kattalekan site 2 (Kattalekan 2), Kattalekan site 4 (Kattalekan 4), Kattakekan site 5 (Kattalekan 5) and Hulkodu were perennial with high yield post monsoons. The ratio of non-monsoon yield to rainfall was found to be in the range of 10 % to 13% in these perennial streams. Drafting of water for horticulture in Kattalekan site 5 catchment has reduced water yield in pre monsoons, which is evident from flows compared at Kattalken 2. Kattalekan site1 and site 3 were intermittent with flow duration of 8 to 10 months. Measurements at Kattalekan showed that Kattalekan 2 had highest water yield during summer followed by Kattalekan 4 and 5 (Figure 7.17). Gundbala, Chikkolli, Kodkani 1 & 2 have flow duration of 10 to 11 months, with streams drying in month of April, this could be attributed to exploitation of water for horticulture though pumping from the neighboring stream/rivers. non-monsoon water yield in the catchment of Gundbala, Chikolli, Kodkani 1 and Kodkani 2 ranges between 5 to 11% of annual rainfall.
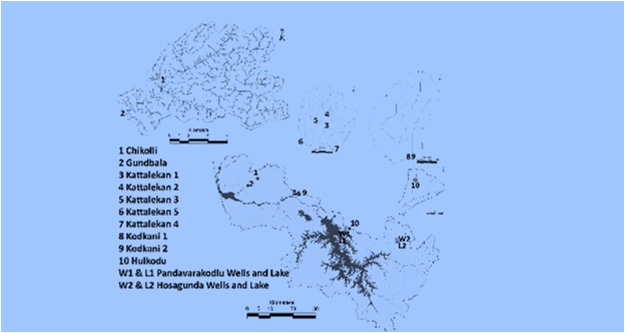 Figure 7: Monitoring stations in Sharavathi river basin
| Location |
Kattalekan 1 |
Kattalekan 2 |
Kattalekan 3 |
Kattalekan 4 |
Kattalekan 5 |
| Rainfall (mm) |
5025 |
4954 |
4976 |
4997 |
5013 |
| Area in sq.m |
259697 |
112813 |
275980 |
162098 |
1134055 |
| Land use |
| Water |
0.0% |
0.0% |
0.0% |
0.0% |
0.0% |
| Built up |
0.0% |
0.0% |
0.0% |
0.0% |
0.0% |
| Evergreen Forest |
92% |
87% |
79% |
84% |
86% |
| Deciduous Forest |
0% |
6% |
9% |
2% |
4% |
| Forest Plantation |
0% |
1% |
0% |
2% |
0% |
| Horticulture |
2% |
3% |
3% |
5% |
2% |
| Agriculture |
0% |
1% |
3% |
2% |
3% |
Rocky outcrop |
0% |
0% |
0% |
0% |
0% |
| Grassland |
5% |
2% |
5% |
5% |
5% |
| Catchment Characteristics |
| Flow Duration (months) |
8 |
12 |
10 |
12 |
12 |
| Post Monsoon Flow (mm) |
309.363 |
487.513 |
583.864 |
450.618 |
511.166 |
| Pre Monsoon Flow (mm) |
0.000 |
154.775 |
15.003 |
53.581 |
54.892 |
| Total non-monsoon flow to rainfall ratio |
6.2% |
13.0% |
12.0% |
10.1% |
11.3% |
| Order of Stream |
1 |
1 |
1 |
1 |
2 |
| Average Catchment Slope |
30% |
38% |
28% |
30% |
27% |
| Average Catchment Elevation (m) |
564 |
600 |
574 |
563 |
553 |
Table 2: Features of stream catchment monitored – Sharavathi - 1
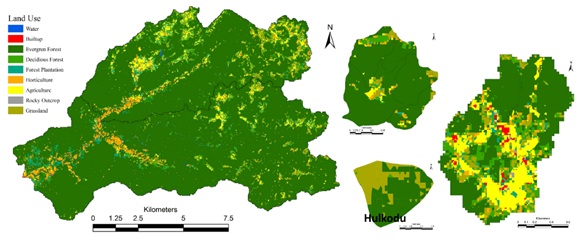 Figure 8: Land use – Sharavathi Catchments
| Location |
Chikkolli |
Gundbala |
Kodkani 1 |
Kodkani 2 |
Hulkod |
| Rainfall (mm) |
4790 |
4702 |
4739 |
4677 |
3300 |
| Area in sq.m |
50018380 |
130602038 |
1530056 |
886720 |
89910 |
| Land use |
| Water |
0.2% |
0.2% |
0.2% |
0.1% |
0.0% |
| Built up |
0.1% |
0.1% |
2.1% |
1.5% |
0.0% |
| Evergreen Forest |
76% |
83% |
48% |
49% |
68% |
| Deciduous Forest |
7% |
5% |
14% |
12% |
0% |
| Forest Plantation |
3% |
2% |
3% |
2% |
0% |
| Horticulture |
3% |
3% |
4% |
3% |
0% |
| Agriculture |
6% |
4% |
18% |
22% |
0% |
Rocky outcrop |
0% |
0% |
0% |
1% |
0% |
| Grassland |
3% |
2% |
10% |
9% |
32% |
| Catchment Characteristics |
| Flow Duration (months) |
10 |
11 |
11 |
11 |
12 |
| Post Monsoon Flow (mm) |
281.6 |
221.0 |
296.7 |
479.7 |
308.9 |
| Pre Monsoon Flow (mm) |
10.5 |
21.4 |
30.7 |
47.3 |
48.1 |
| Total non-monsoon flow to rainfall ratio |
6.1% |
5.2% |
6.9% |
11.3% |
10.8% |
| Order of Stream |
5 |
6 |
3 |
2 |
1 |
| Average Catchment Slope |
30% |
28% |
18% |
21% |
25% |
| Average Catchment Elevation (m) |
29 |
19 |
524 |
523 |
670 |
Table 3: Features of stream catchment monitored – Sharavathi – 2 and 3
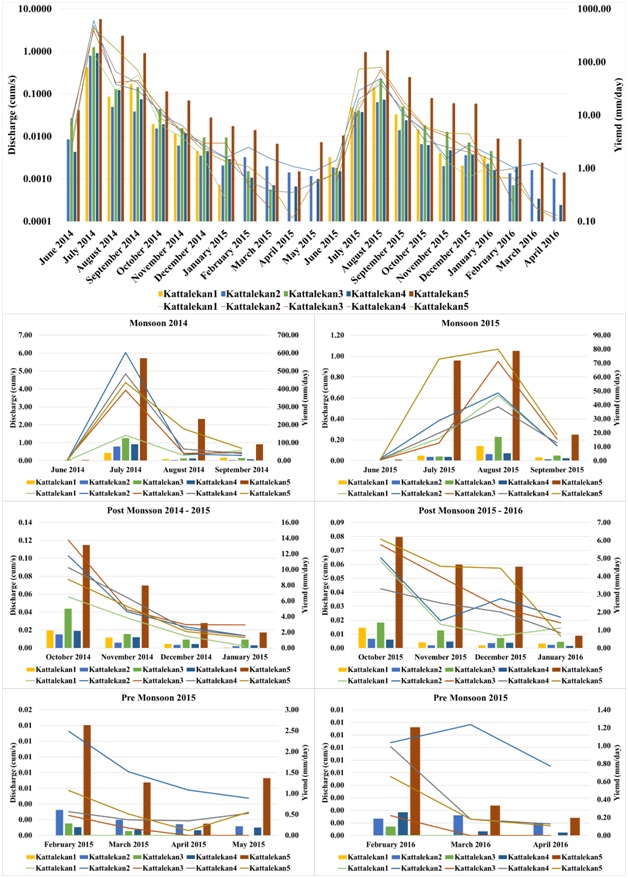 Figure 9: Stream Flow Dynamics (Monthly and Seasonal) in Sharavathi - 1
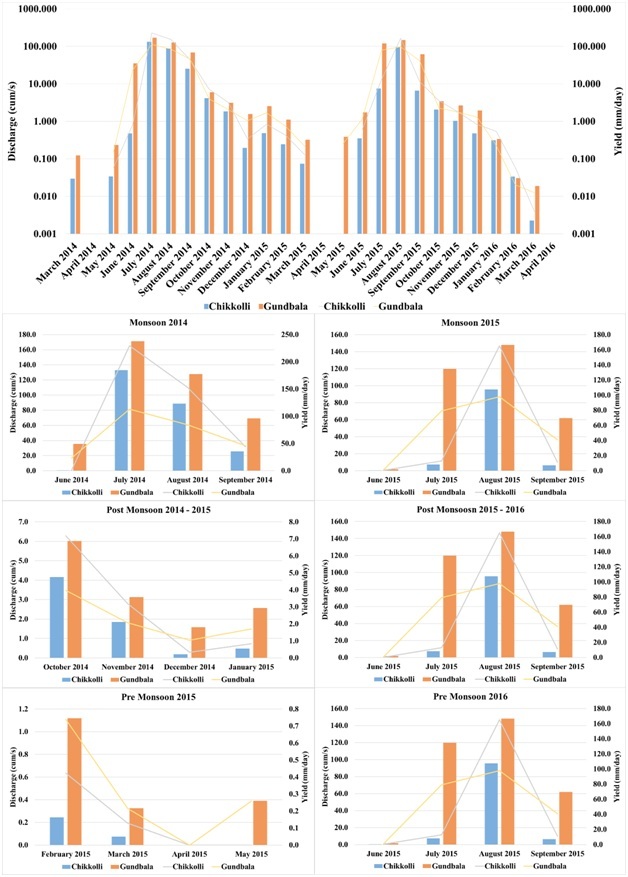 Figure 10: Stream Flow Dynamics (Monthly and Seasonal) in Sharavathi - 2
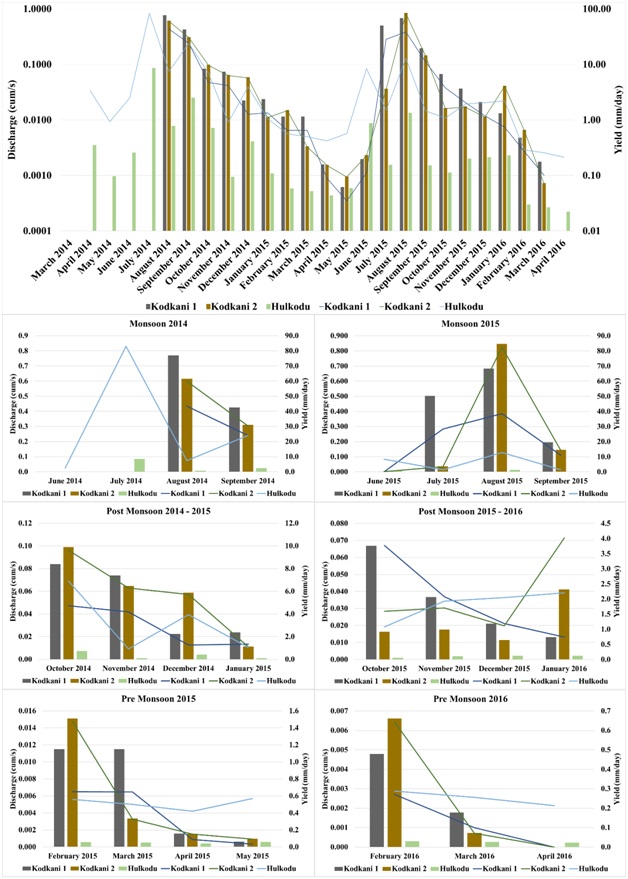 Figure 11: Stream Flow Dynamics (Monthly and Seasonal) in Sharavathi – 3
To derive Ecological flow requirements in Western Ghats, undisturbed catchments were considered. Ecological flow in the catchments are estimated as function of observed non monsoon flows to the modeled stream flow as well as function of observed non-monsoon flow to the total rainfall in the catchment. Based on Mean Annual Runoff (MAR) i.e., annual stream flow in the catchment, Eflow ranges between 25% (Kattalekan 5) to 30% (Hulkodu).(table 4).
| Catchment |
Rainfall (mm) |
Total flow (MAR – mm) |
Observed Non monsoon flow (mm) |
Eflow (%MAR) |
Eflow (%Rainfall) |
| KK4 |
3572 |
1998 |
504 |
25% |
14% |
| KK5 |
3574 |
2252 |
566 |
25% |
16% |
| KK2 |
3497 |
2200 |
642 |
29% |
18% |
| Hulkodu |
2424 |
1188 |
357 |
30% |
15% |
Table 4: Environmental flow in Undisturbed catchments
Stepwise regression was carried out in order to understand the role of various factors influencing stream flow duration. Flow duration shows good correlation with catchment slope (+), evergreen forest cover (+), deciduous forest cover (-). Step wise multivariate (multi regression) analysis carried out considering combination of various parameters that had significant impact on flow duration such as Slope, Evergreen forest cover, Deciduous forest cover, and monoculture. Multivariate statistical model defining flow duration is as represented in equation 1. The multivariate model had ‘R2’0.72 and ‘r’ of 0.82 signifying predicting capabilityStepwise regression was carried out in order to understand the role of various factors influencing stream flow duration. Flow duration shows good correlation with catchment slope (+), evergreen forest cover (+), deciduous forest cover (-). Step wise multivariate (multi regression) analysis carried out considering combination of various parameters that had significant impact on flow duration such as Slope, Evergreen forest cover, Deciduous forest cover, and monoculture. Multivariate statistical model defining flow duration is as represented in equation 1. The multivariate model had ‘R
2’0.72 and ‘r’ of 0.82 signifying predicting capabilityStepwise regression was carried out in order to understand the role of various factors influencing stream flow duration. Flow duration shows good correlation with catchment slope (+), evergreen forest cover (+), deciduous forest cover (-). Step wise multivariate (multi regression) analysis carried out considering combination of various parameters that had significant impact on flow duration such as Slope, Evergreen forest cover, Deciduous forest cover, and monoculture. Multivariate statistical model defining flow duration is as represented in equation 1. The multivariate model had ‘R2’0.72 and ‘r’ of 0.82 signifying predicting capability
FD=11.08-2.44(Sl)+1.73(Eg)-9.03(De)-6.31(Fp).................(eq1)
Where FD - Flow duration in months, Sl – Average catchment slope (fraction), Eg – Evergreen forest area in catchment (fraction), De – Deciduous forest area in catchment (fraction), Fp – Area under forest plantation in catchment (fraction).
Evaluation of regression equation against measured values shows predictable accuracy of model with Nash-Sutcliffe efficiency 0.67 and percent bias ~1%.Evaluation of regression equation against measured values shows predictable accuracy of model with Nash-Sutcliffe efficiency 0.67 and percent bias ~1%.Evaluation of regression equation against measured values shows predictable accuracy of model with Nash-Sutcliffe efficiency 0.67 and percent bias ~1%.
Average Rainfall in the catchment is about 4230 mm. Interception loss in the basin ranges between 450 mm and 1400 mm with an average of 1047 mm. Net rainfall in Sharavathi basin is about 3183 mm i.e., about 9262 Million
Cubic meters. Riverscape of Sharavathi has over 42.8% forest dominated towards Ghats indicating relating to higher Infiltration and lower monsoon yield. Runoff in the basin is about 3075 Million cubic meters and Infiltration of 5370 Million cubic meters. Ground water recharge in the catchment ranges between 274 mm to 1250 mm in the plains and Ghats respectively, on an average 897 mm in contributed to ground water recharge accounting to 2577 Million cubic meters. Water available in the hypomorhpic layer is about 2693Million cubic meters. Pipeflow in the basin is about 743 Million cubic meters whereas baseflow is about 207 Million cubic meters both together contributing to a sub-surface flow of 950 Million cubic meters.. Agriculture demand in the basin is about 1798 Million cubic meters. Livestock demand in the basin is about 7.9 Million cubic meters. Domestic water requirement in the basin is about 18.5 Million cubic meters across the basin. Both livestock and human population combined together has a domestic footprint of 26.4 Million cubic meters.
Terrestrial demand is function of evapotranspiration from forested landscapes, which is about 1795 Million cubic meters during non-monsoons could be catered by the water in the hypomorphic layer (vadose water). Annual average flow in the basin considering runoff and sub-surface flows is about 4025 Million cubic meters, with respect to which, Environmental flow is about 1207 Million cubic meters. Demand footprint of the basin is about 4827 Million cubic meters and of this 3619 Million Cubic meters is the water footprint in agriculture, domestic, livestock and evapotranspiration from forests.Eco-Hydrological Footprint (Figure 12) shows water scarce situation in sub-basins located in the eastern transition zone at Shimoga and Hosanagara whereas sub-basins in the Ghats show sufficient water availability to cater domestic, irrigation, horticulture, livestock, and ecological needs. Presence of dense forest cover in the Ghats make it more favorable to cater most of the Environmental flow demands in each sub-basin and ecological flow demands in the river downstream.
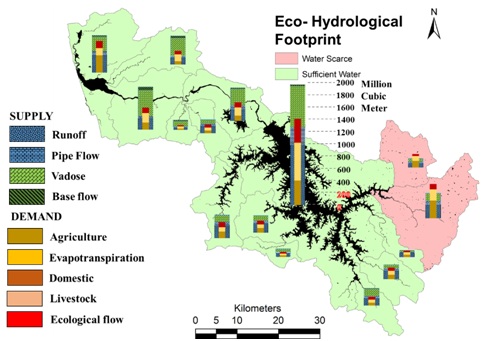 Figure 12: Eco-Hydrological footprint of Sharavathi river basin
Streams in the Sharavathi river showed sufficient water availability during all seasons when the catchment was dominated by native vegetation in the Ghats and Coasts, whereas the transition zones between Ghats and Plains, and Plain lands with the large-scale monoculture plantations and agricultural activities are witnessing water scarcity of 4 to 6 months respectively. Ghats and Coasts have perennial streams as against the eastern transition where the stream flows were intermittent to seasonal. Based on the duration of flow in the streams, they are grouped into 4 categories (A, B, C, D). Perennial streams are categorised under A (with 12 months flow), intermittent river are with 9-11 months flow (category B), 8 to 6 months (category C), where as seasonal streams were classified under D category. Accordingly the Ghats and coasts have perennial river system as against the upper plainlands (Figure 13).
Flora and faunal distribution in Sharavathi river catchment is as depicted in figure 13. Considering ecology and hydrological regime in the catchments, it is evident that higher species diversity occurs in the sub catchments with the perennial streams and catering the domestic and environmental/ecological needs. This also highlights that streams are perennial in the catchment dominated by native vegetation with higher endemic plant species confirming the linkage between ecology, hydrology with the land use dynamics.
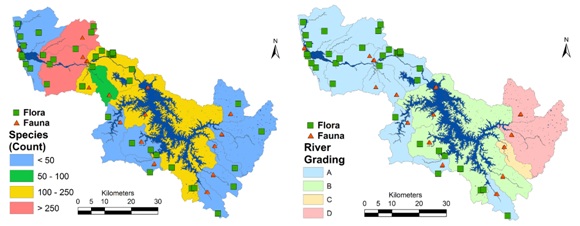 Figure 12: Eco-Hydrological footprint of Sharavathi river basin
NEXT
Figure 12: Eco-Hydrological footprint of Sharavathi river basin
NEXT