Issues: 1 2 3 4 5 6 7 8 9 10 11 12 13 14 15 16 17 18 19 20 21 22 23 24 25 26 27 28 29 30 31 32 33 34 35 36 37 38 39 40 41 42 43 44 45 46 47 48 49 50 51 52 53 54 55 56 57 58 59 60 61 62 63 64 65 66 67 68
Vinay. S1,2, Bharath, S1, Chndran, M. D. S1,Bharath, H. A1,3, Shashishankar, A2,4, Ramachandra. T. V1 3. Study Area: River Sharavathi is spread across Uttara Kannada and Shimoga districts of Karnataka (Figure 1). Originating at Ambutirthha (Tirthahalli) (Figure2) [27], Sharavathi flows for a distance of nearly 128 km [28] before it joins Arabian Sea at Karki (Honnavar) (Figure 2). Tributaries of Sharavathi include, Nandiholé, Haridravathi, Sharmanavathi, Hilkunjiholé, Nagodiholé, Hurliholé, Yenneholé, Mavinaholé, Gundabalaholé, Kalkatteholé, Kandodiholé and many more. Sharavatiriver has a catchment area of 3042 sq.km spread across districts of Uttara Kannada (Honavara, Siddapura, Kumta) and Shimoga (Sagara, Hosanagara, Tirthahalli). The variations in the terrain have led to the formation of various water falls such as the Jog falls, Apsarakonda, Mavinagundi falls, Dabbe fall etc. The plain regions of the catchment are dominated by lakes whereas the Ghats are dominated by streams. Alterations in the physical integrity through the construction of series of dams have also altered the estuary productivity and diversity. Population in the catchment has increased from 319380 in 2001 to 353800 in 2011[29] and is projected to increase to 388190 in the year 2021 at a growth rate of 9.72% per decade. Population density in the catchment is 124.2 persons per square kilometer as on 2018. Major Population is contained at towns such as Honnavar, Sagar, Talguppa. Rainfall assessment in Sharavati river catchment (Figure 3) indicates that rainfall in the catchment is orographic. Temporal pattern of rainfall in Sharavathi shows nearly 77% of the rainfall occurs due to the South West monsoon. Average annual rainfall in the catchment is about 4230 mm and varies between 1600 mm at the plains of Shimoga and Hosanagara to over 5500 mm at the Ghats of Sagar, Siddapur, Honnavar and Hosanagaratalluks. Coastal belt of Honavar receive annual rainfall of 3500 mm and 4000 mm. 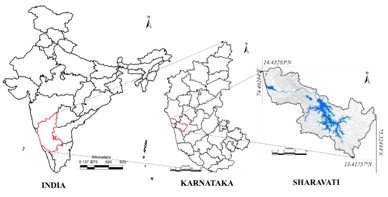 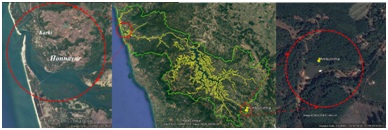 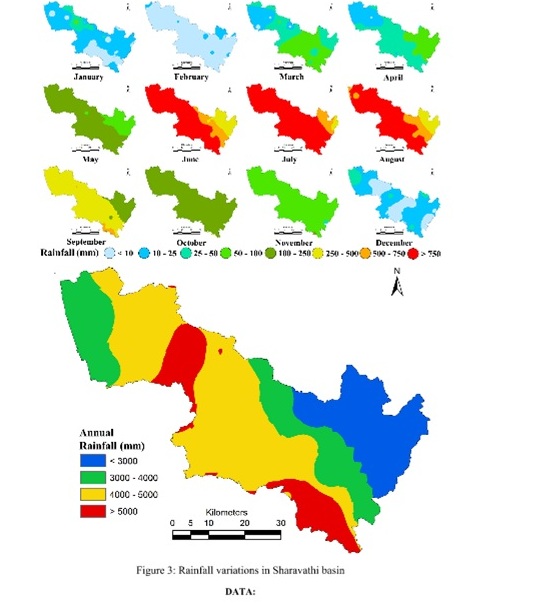 Optical remote sensing data acquired through Landsat OLI sensors for 2016 was used to assess the landscape dynamics [30]. Long term rainfall data between 1901 to 2010 were collected from the Directorate of Economics and data across all the three districts were obtained from respective district at a glance [32]. Temperature data were downloaded from WorldClim[33], extra-terrestrial solar radiation from FAO [34]. Crop calendar and growth phase wise crop water requirements was acquired from Agriculture Department of Karnataka and National Food Statistics[31] across rain gauging stations spread across the regions - Uttara Kannada, and Shimoga districts. Population data were obtained between 1991 and 2011 from Census of India [29], Livestock population and Crop data across all the three districts were obtained from respective district at a glance [32]. Temperature data were downloaded from WorldClim[33], extra-terrestrial solar radiation from FAO [34]. Crop calendar and growth phase wise crop water requirements was acquired from Agriculture Department of Karnataka and National Food Security Mission [35], [36]. Digital Elevation Model from SRTM [30], [37]. In addition to these data, Virtual data such as Google Earth[38], NRSC-Bhuvan[39], Survey of India Topographic sheets [28], French Institute maps[40] were used for the spatial analysis. Method involved in understanding the overall water footprint and to understand the sustenance of water resource as depicted in figure 4. Assessment of eco-hydrological footprint in the catchment involved the following: Land use in the catchment plays a decisive role in the hydrological processes such as infiltration, surface and subsurface flows and storages, etc., which define the hydrologic regime. Assessment of constituents in the landscape under different vegetation type such as agriculture, forest, plantation helps in assessing the water demand in these sectors. Land use analysis was carried out using supervised classifier based on Gaussian Maximum likelihood algorithm [41]–[43]. SRTM DEM, SOI (the Survey of India; http://thesurveyofindia.gov.in) Topographic maps were used to delineate sub basins in the river catchment. Hydrologic footprint is a function of land use, climatic factors (such as rainfall, surface and subsurface flows, ground water, vadose water), etc. Spatial and temporal (monthly variability) patterns of rainfall is assessed using data from all rain gauge stations of 110 years. Net rainfall in each sub basis were quantified based by deducting interception storage in each land use. Runoff in the basin was quantified using Rational equation [44], runoff coefficients were based on the earlier field estimations carried out in Sharavati basin and Aghanashini basin [45]. Infiltration is quantified as difference between Net rainfall and runoff (overland flow). Ground water recharge was estimated using Krishna Rao equation[46] which considers rainfall as a parameter. Water in the hypomorphic zone (vadose zone) was estimated as difference between net rainfall, runoff and ground water recharge. Subsurface flows were derived[45] based on soil and lithological characteristics of the catchment. Ecological footprint was derived as function of ecological, agriculture, domestic and livestock water demands. Based on the cropping pattern, growth phase and water requirement for each crop, agriculture water demand was quantified. Based on the livestock census and water requirement for each animal per day was used to estimate water demand for livestock. Similarly, water demand for domestic sector is assessed based on the population and per capita water demand. Evapotranspiration from forests were used as a part of terrestrial natural water demand and quantified using maximum, minimum temperatures and extra-terrestrial solar radiation[46]–[48] based on the modified Hargreaves [49] method. Environmental flow was arrived based on long-term field measurements carried out at specific sub catchments of Sharavathi river basin. Eco-Hydrological footprint is evaluated using eco-hydrological indices developed in the model to understand the role of forests in maintaining the hydrological cycle and catering the biotic demands. Eco-hydrological index is quantified as the ratio of infiltration to evapotranspiration in the catchment. Lower the values of infiltration i.e., less than 1 indicates poor water availability and values greater than 1 indicated better water availability sustaining the domestic and ecological demands. Month wise hydrological supply and ecological demand were analysed to understand the eco-hydrological status. The region indicates deficit situation if supply is below demand and surplus situation if supply is higher than the demand. 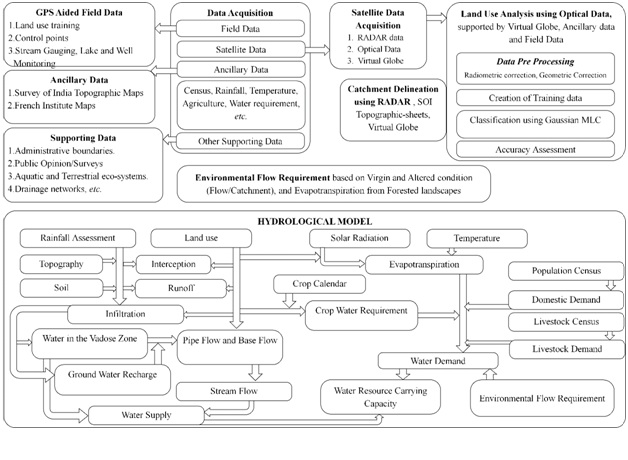 NEXT
|