Issues: 1 2 3 4 5 6 7 8 9 10 11 12 13 14 15 16 17 18 19 20 21 22 23 24 25 26 27 28 29 30 31 32 33 34 35 36 37 38 39 40 41 42 43 44 45 46 47 48 49 50 51 52 53 54 55 56 57 58 59 60 61 62 63 64 65 66 67 68
BharathSetturu1, Vinay S1Ramachandra, T V* 4. Materials & Method The spatio temporal land use analysis:The land use analysis highlights the loss of forest cover due to uncontrolled expansion of coffee plantations and other driving forces. The region has under gone tremendous changes in its forest cover due to the pressures such as tourism and plantations. Figure 3 and Table 1 depicts the change across each land use categories. The major cover of evergreen forest (40.47 to 27.14%) has lost due to expansion of coffee plantations in across the district. The interventions in terms of road, built-up areas and other changes have led to loss of forest cover. Around 66,892 ha of pristine forest cover was lost due to un-interrupted exploitation. The Kushalnagara and Madikeretaluks have lost major chunk of forests due to innumerable homestays, villas construction. The regularizing encroachments till 1991 under various schemes has also caused tremendous changes in land use pattern of the district through increase in coffee extent, rubber plantations etc
Modelling and visualization of LU:Simulation of 2018 and 2026 has been performed by accounting transition from 2010-2018. The consistency ratio of less than 0.1 has been achieved with multi criteria evaluation of factors. Land use modeling for the year 2026 shows the likely loss of the forest cover to 45.18%. The major LUchanges are noticed in the regions of Bhagamandala, Titimatti, Makutta and closer to major city centers where in forests are converted to horticulture, forest plantation. Horticulture would increase to 38.63% and agriculture to 10.31% which mostly towards the transition zones and plain region of Kushalnagara and north, Bhagamandala, Virajpet, Gonikoppa, Ponnampet and surroundings (Figure 4, Table 2).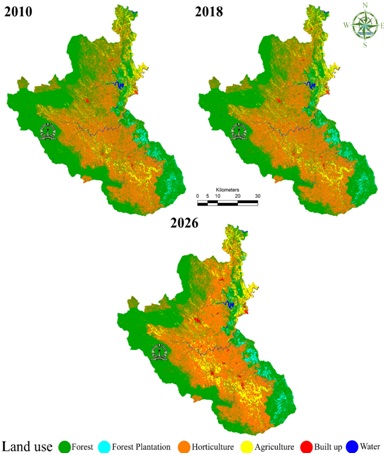
Identification of Ecological Fragile zones:Mapping of ecological fragile zones offers a comprehensive representation and prioritisation for conservation of Kodagu region based on various themes such as Land, Ecology, Geo-climatic, Hydrology, Social diversity. Each theme has set of representative factors, which are weighted based on their prominence at grid wise. The results have been analysed theme wise and aggregated weightage metric score has been computed. The greater forest cover (> 80%) is represented by grids of Talcauvery, Pushpagiri, Bramhagiri WLS region, which were assigned higher weightages.The protected areas of Kodagu and elephant migratory path are considered as another prime variables as large tracts of forest are being protected under Pushpagiri WLS, Bramhagiri WLS, Talacauvery WLS, Nagarhole NP. These grids were assigned higher weightages that covered in protected areas. Geo-climatic information of region has been analyzed to identify sensitive zones by considering altitude, slope, soil, geomorphology, lithology and agro-climatic zones. The weightages are assigned based on each variable specific characteristics to the respective grids.The population density of each grid is analyzed based on census data of 2011. The higher population density has considered as least priority weightages (1) and lower density regions are projected as higher conservation priority weightages (10). The forest-dwelling communities of the region are considered as one of the key variables in prioritization. The presence of tribes considered as higher weightages and absence is assigned least value. The aggregated weightage metric score associated with each theme has been computed and it resulted in ecological fragile zones of 1, 2, 3 and 4. The categories of 1 is considered as high ecological fragile zone (36 grids), 2 as moderate (24 grids), 3 &4 as fragile zones of medium 1 and 2 (6, 4 grids). High and moderate constitute 95% of the Kodagu signifies its importance for conservation. The further degradation should not be allowed in this regions. The village wise analysis highlight high ecological fragile zones of 117 villages and moderate covers 143 villages, medium 1, 2 covers 35, 3 villages respectively.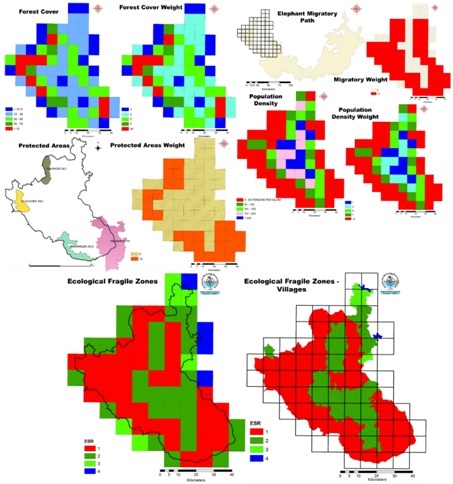
|
||||||||||||||||||||||||||||||||||||||||||||||||||||||||||||||||||||||||||||||||||||||||||||||||||||||||||||||||||||||||||||||||||||||||||||||||||||||||||||||||||