|
LANDSCAPE DYNAMICS IN WESTERN GHATS
(PDF)
Sai Omkari, P1., Bharath, S2., Udayasimha.L1, Ramachandra, T. V2,*.,
1 BMS College of Engineering, Basavanagudi, Bengaluru 560019
2Energy and Wetlands Research Group, CES, IISc, Bengaluru 560012
*Correspondence author: tvr@iisc.ac.in
2.0 MATERIAL AND METHOD
2.1 Study Area
Western Ghats considered as one of the eighth hottest hot-spot in the world by UNESCO and one among 35 global biodiversity hotspots by IUCN. Western Ghats ranges from Gujarat to Tamil Nadu covering an area of 164280 km2, spread across 63 districts. The region with exceptional biodiversity of endemic flora and fauna of 4,600 species of flowering plants with 38% endemics, 330 butterflies with 11% endemics, 156 reptiles with 62% endemics, 508 birds with 4% endemics, 120 mammals with 12% endemics, 289 fishes with 41% endemics and 135 amphibians with 75% endemics [9]. Anshi-Dandeli Tiger reserve, Sharavathy wildlife sanctuary, Mookambika wildlife sanctuary, Someshwara wildlife sanctuary, Kudremukh national park, Bhadra tiger reserve, Pushpagiri wildlife sanctuary etc. are the major national parks in this region. Regarding vegetation types commonly seen are tropical evergreen forests, moist deciduous forests, scrub forests, sholas, and savannas including the high rainfall savannas. Western Ghats has numerous watersheds that feed perennial rivers of peninsular India [10]. It forms the basis for major watersheds in the Deccan plateau with major rivers as Cauvery, Bedthi, Aghanashini, Sharavathi etc. It comprises of east and west flowing rivers which meets up at Arabian Sea and Bay of Bengal respectively forming the catchment for the Deccan Plateau. This region receives an average rainfall of 3000-4000 mm with localized extremes to about 9000 mm. The latitude and longitude are as shown in the Figure 1. The ecological and biological richness of this region is highly being influenced with the developmental pressures in these regions.
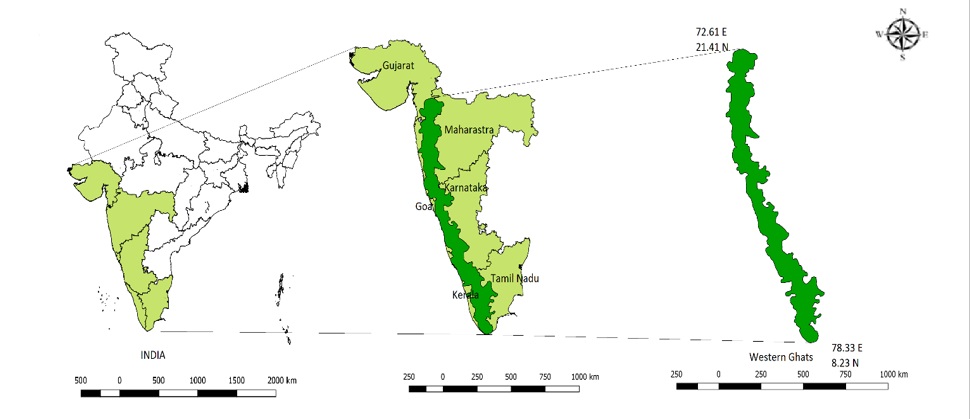 Figure 1: Study area - Western Ghats, India
2.2 METHOD:
Figure 2 explains in detail the method employed for this process. Land use classification is done through supervised classifier based on Gaussian Maximum likelihood algorithm considering remote sensing data with ground truth (field) data.
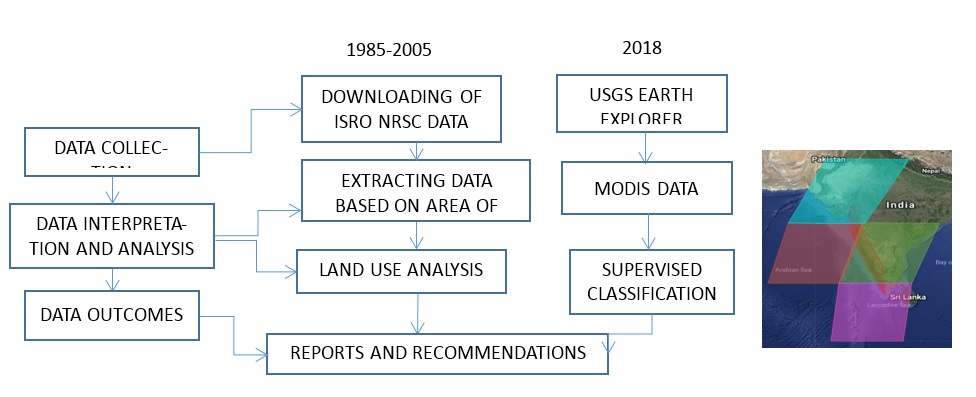 Figure 2: Method of land use dynamics analyses
The data for the period 1985-2005 was obtained from decadal data by ISRO and NASA of 100 m resolution with a minimum mapping unit of 2.5 hectares. The data were derived from Landsat 4 and 5 Thematic Mapper (TM), Enhanced Thematic Mapper Plus (ETM+), and Multispectral (MSS) data, India Remote Sensing satellites (IRS) Resource-sat Linear Imaging Self-Scanning Sensor-1 or III (LISS-I, LISS-III) data, ground truth surveys, and visual interpretation. The data were classified according to International Geosphere-Biosphere Programme (IGBP) classification scheme. (Roy et al., 2015; Meiyappan et al., 2016 in review).
Figure 2: Method of land use dynamics analyses
The data for the period 1985-2005 was obtained from decadal data by ISRO and NASA of 100 m resolution with a minimum mapping unit of 2.5 hectares. The data were derived from Landsat 4 and 5 Thematic Mapper (TM), Enhanced Thematic Mapper Plus (ETM+), and Multispectral (MSS) data, India Remote Sensing satellites (IRS) Resource-sat Linear Imaging Self-Scanning Sensor-1 or III (LISS-I, LISS-III) data, ground truth surveys, and visual interpretation. The data were classified according to International Geosphere-Biosphere Programme (IGBP) classification scheme. (Roy et al., 2015; Meiyappan et al., 2016 in review).
The data of 2018 was obtained from USGS [11]. MODIS data was also used for the analysis of landscape dynamics. MOD09A1 product was used for the study. Initially the data for the study area of Western Ghats was extracted with no or minimum cloud cover, which was covered in 4 scenes. Using MODIS re-projection tool the data was projected to WGS 84. Land use classifications using temporal data were carried out through the open source program GRASS - Geographical Resources Analysis Support System. The process involved (i) generation of FCC, from band 1(250 m-red), 2 (250 m- near infrared), 4 (500 m-green; resampled to 250 m) (ii) selection of training sets covering at least 15 % of the study area which is uniformly distributed over the study region. Of the selected data, 60 % of the data was used for classification while the remaining 40% for validation.
Supervised classification was carried out using Gaussian maximum likelihood algorithm [12] to classify the data which preserves the land use characteristics through statistical classification techniques using a well distributed training pixels. The following different classes were examined i.e., Evergreen Forest, Deciduous forest, Scrub land, Cropland, Plantations, Water Bodies, Open spaces and Built-up Land. Accuracy assessment is used to assess the classification of data. This assessment was carried out with the generation of confusion or error matrix and kappa statistics.
Next
|