|
The knowledge of land cover and land use is very important in understanding natural resources conservation and management. Land cover, land use intensity and land use diversity are land quality indicators for sustainable land management. Optimal management of resources aids in maintaining the ecosystem balance and thereby ensures the sustainable development of a region. Land cover refers to the physical and biological cover over the surface of land, including water, vegetation, bare soil, and/or artificial structures. Land use is a more complicated term, is the human modification of natural environment or into built-up such as fields, pastures, and settlements. The land-cover changes occur naturally in a progressive and gradual way, however sometimes it may be rapid and abrupt due to anthropogenic activities.
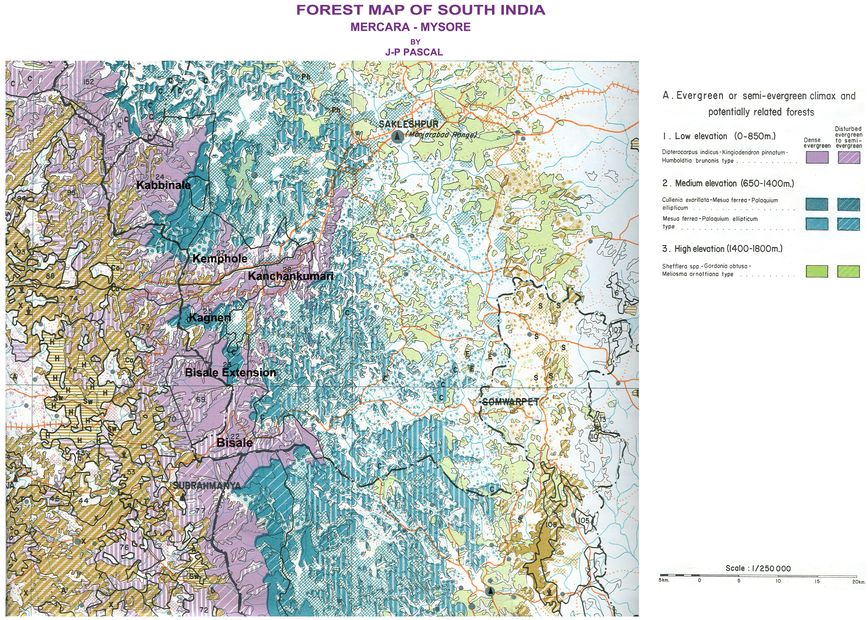
Gundia river basin is situated along the narrow belt of evergreen and semi-evergreen climax and potentially related forests (Figure 1.1), which is of two categories according to Pascal et.al (1982). The first category is Dipterocarpus indicus – Kingiodendron pinnatum- Humboldia brunonis type of low elevation (0-850 m elevation). The second type is Mesua ferrea – Palacuim ellipticum type of medium elevation (650-1400 m).
Figure 1.1: Evergreen and semi-evergreen climax and potentially related forests of Gundia basin
Netravathi River and Kumaradhara Rivers of Central Western Ghats, Karnataka are two west flowing rivers. The river systems with numerous perennial streams with typical tropical evergreen forested catchment areas are the regions of high conservation value. Highlights of the riparian vegetation are the naturally grown Vateria indica trees in the upper Ghat region and the presence of Gymnacranthera canarica in the lower reaches of the Ghats. Over 5000 mm of annual rainfall complement to the ecological rich habitats.
The Malnad part of the district has seen large scale land cover changes with the overexploitation of vegetation during the last two centuries. It was probably during the direct British rule of the district from 1831 to 1881 that several parts of Malnad was thrown open to the British planters often ex-army men who had changed over to civilian occupation at the end of the Anglo-Mysore wars. Kadamane, Biccodu, Cognur, Karadi-betta, Barchinhullu, Matsagar are only few of the estates dating from this period. The early planters gradually cleared forest tracks and planted them with the shade loving coffee and cardamom, the tall areca and the bushy orange. Tea was introduced at Kadamane in the early twentieth century and now it constitutes one of the major produces of this estate (Saldanha, et al. 1978).
Since 1945 there has been a spurt in the plantation industry so that the original vegetation had been greatly altered. There is scarcely any virgin forest in private hands. Major state forests have also been subjected to selective felling of hard structural timbers as well as soft woods for the plywood and matchstick industries. Large tracts of revenue lands with dense evergreen to semi-evergreen forests are being swiftly and completely logged to pave way for other land uses such as plantations.
Study Land use dynamics reveal the temporal change in the region with respect to land cover. Remote sensing data of better resolution as available from different sources, at different time interval help in analysing the rate of changes as well as factors that cause of changes. Here we analyse temporal remote sensing data to understand temporal changes in land use of Gundiya region in Western Ghats. This has been done using temporal Landsat TM,ETM+ data which is downloaded from public domain (USGS website http://landsat.usgs.gov). Landsat data contains 7 bands (Blue, green, Red, NIR, Mid IR) of resolution 30 m and thermal band (6th band) of 120 m resolution. This data has been analysed using open source GIS software – GRASS (http://ces.iisc.ac.in/grass). Method involved is as follows:
- Extraction of bands
- Generation of FCC (False Colour Composite) and identification of training sites on FCC. False colour composite (FCC) is generated using bands 2, 3 &4.
- Collection of training data, ground control points using GPS
- Compilation of attribute information using Google earth and field investigations.
- Classification of remote sensing data (1999,2003 and 2010) to dominant land use categories
- Change detection analysis,
- Validation and accuracy assessment
- Detection, visualisation and assessment of change analysis.
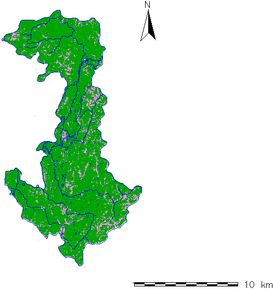
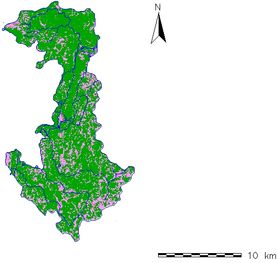
Land use analysis was done using Gaussian Maximum Likelihood Classifier (GMLC). The temporal data (1999,2003,2010) was classified into four categories (built-up, vegetation , water, other (cropland ,rock, open space). Land use details are given in Figure 1.2 and Table 1.1. Accuracy assessment statistics for the respective data is given in Table 1.2.
Figure 1.2: Temporal land use dynamics in Gundia river basin
25 FEB 1999 |
27 JAN 2003 |
03 MARCH 2010 |
 |
 |
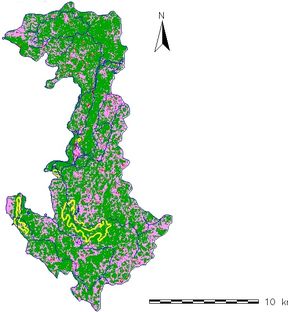 |
Table 1.1: Land use statistics for Gundia river catchment
| YEAR |
1999 |
2003 |
2010 |
| Land use |
Area(ha) |
% |
Area (ha) |
% |
Area (ha) |
% |
| Vegetation |
15128.52 |
77.56 |
15128.52 |
77.56 |
12784.46 |
65.55 |
| Water |
163.96 |
0.84 |
163.96 |
0.84 |
48.62 |
0.25 |
| Other (Cropland, Rock, open area, etc.) |
4164.82 |
21.35 |
4164.82 |
21.35 |
6358.96 |
32.60 |
| Urban |
47.18 |
0.24 |
47.18 |
0.24 |
312.43 |
1.60 |
Table 1.2: Accuracy assessment
| Year |
Kappa Coefficient |
Accuracy (%) |
| 25 Feb 1999 |
0.99 |
99.5 |
| 27 Jan 2003 |
0.94 |
97.02 |
| 03 Mar 2010 |
0.99 |
99.94 |
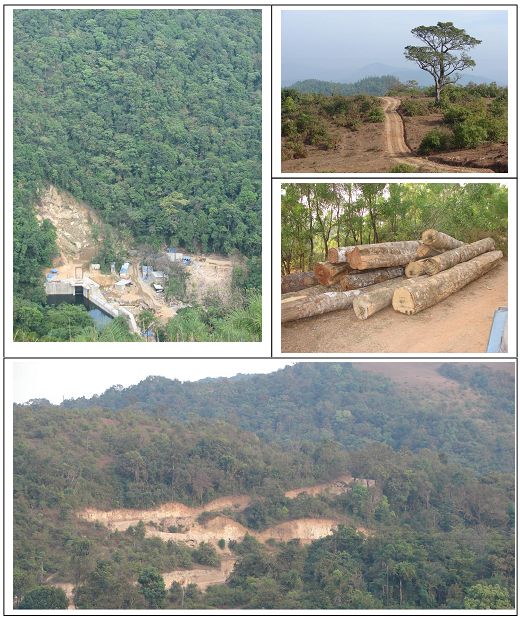
Decline in forest cover in Gundia catchment during 2003-2010 is mainly due to
- Mini hydel project at Kempholé and subsequent conversion of forest land for setting up the power station, transmission network and roads. This is evident from Figure 1.3.
- Construction of roads and subsequent illegal logging of trees due to the availability of better transportation network
- The announcement of Gundia power project during post 2000 and subsequent removal of timber trees in private lands (revenue lands)
- Encroachment of forest lands for ginger and rubber cultivations
Figure 1.3: View of land cover at Kempholé mini power plant, approach roads, illegal logging
 |
