4.1 Characteristics of the adsorbent
The approximate percentages of total carbon, nitrogen and hydrogen in the four husks are shown in Table 14. The greater percentage of carbon content in all the four husks reveal that carbon compounds might be responsible for adsorption of dyes [methylene blue, amaranth, rhodamine B and fast green]. The protein content is less in all the four husks, as revealed by low nitrogen values. The approximate percentages of total carbon, nitrogen and hydrogen in the four husks are listed in Table 14.
Table 14 : Percentage content of carbon, hydrogen and nitrogen in the four husks

The preliminary results showed that coffee husk was not efficient in the biosorption of dyes. Hence the results of biosorption of dyes by coffee husk are not presented here.
4.2 Infrared spectroscopic studies
Unreacted samples of BGH, TDH, TH and CH were subjected to Fourier transform infrared spectroscopy and the percentage transmissions for various wavenumbers are presented in Figures 2 to 5 respectively. The absorption bands identified in the spectra and their assignment to the corresponding functional groups are discussed in detail in the discussion section.
Figure 2 : Infrared spectra of BGH

Figure 3 : Infrared spectra of TDH

Figure 4 : Infrared spectra of CH

Figure 5 : Infrared spectra of TH

4.3 Batch mode adsorption studies
4.3.1 Effect of agitation time
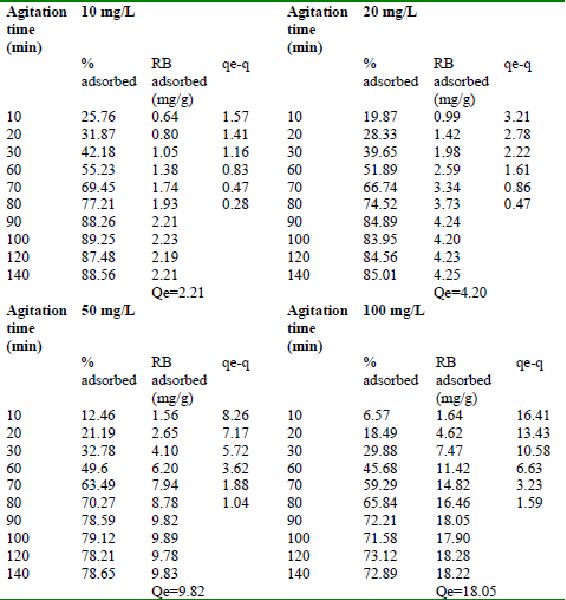
The results on the effect of agitation time at various dye concentrations are presented in Tables and Figures. Adsorption of amaranth by bengal gram husk; tur dal husk and tamarind husk are presented in Tables 15 to 17 and Figures 6-8. Tables 18 to 20 and Figures 9 -11 present the results of agitation time of Methylene blue by bengal gram husk; tur dal husk and tamarind husk. Similarly, Figures 12 - 14 and Tables 21 to 23 represent the agitation time of adsorption of Fast green by bengal gram husk; tur dal husk and coffee husk. Adsorption of rhodamine B by the various husks is given in Figures 15 - 17 and Tables 24 to 26.
Amaranth was maximally adsorbed within 50 minutes of contact between the adsorbent and dye molecules. The agitation time was dependent on initial dye concentration for biosorption of methylene blue by BGH and TH. The adsorption of fast green by BGH and TH was independent of time. An equilibrium time of 60 minutes was required for the bioremoval of Fast green by TDH. The amount of rhodamine B biosorbed was least in TH and maximum by Tur dal husk. Generally, among all the dyes, the equilibrium time for Rhodamine B was higher than for all the other dyes Tur dal husk exhibited maximum uptake of the dyes followed by BGH and TDH.
Figure 6-8 : Effect of agitation time on the amaranth biosorption by BGH, TDH and TH
respectively (♦ 10 mg/L ■ 20 mg/L ▲ 50 mg/L ● 100mg/L)
 Figure : 6 Figure : 6 |
 Figure : 7 Figure : 7 |
 Figure : 8
Figure 9-11 : Effect of agitation time on the Methylene blue biosorption by BGH, TDH
and TH respectively (♦ 10 mg/L ■ 20 mg/L ▲ 50 mg/L ● 100mg/L)
 Figure : 9 Figure : 9 |
 Figure : 10 Figure : 10 |

Figure : 11
Figure 12-15 : Effect of agitation time on the Fast green biosorption by BGH, TDH and
TH respectively (♦ 10 mg/L ■ 20 mg/L ▲ 50 mg/L ● 100mg/L)
 Figure : 12 Figure : 12 |
 Figure : 13 Figure : 13 |
 Figure : 15
Figure 16-18 : Effect of agitation time on the Rhodamine B biosorption by BGH, TDH and TH
respectively (♦ 10 mg/L ■ 20 mg/L ▲ 50 mg/L ● 100mg/L)
 Figure : 16 Figure : 16 |
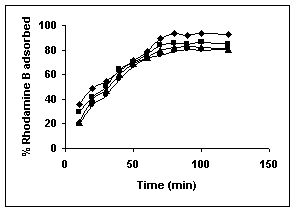 Figure : 17 Figure : 17 |
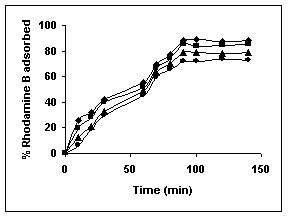
Figure : 18
Table 15 : Effect of agitation time and initial dye
concentration on Amaranth adsorption by bengal gram husk (Adsorbent dose = 0. 25 g/100mL)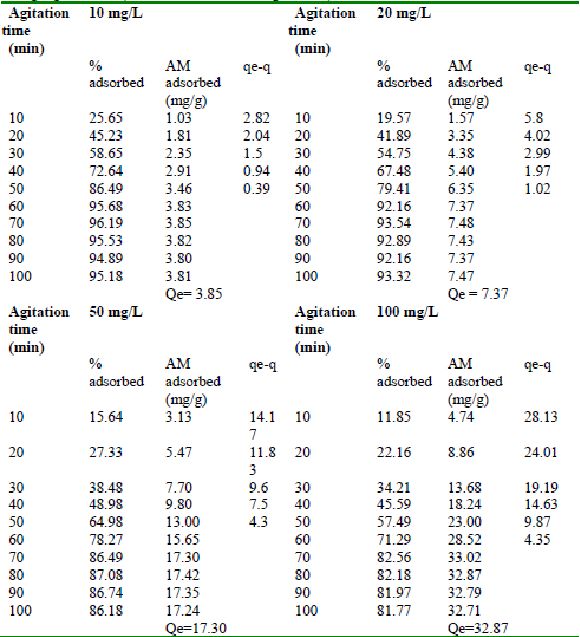
Table 16 : Effect of agitation time and initial dye
concentration on Amaranth adsorption by Tur dal husk (Adsorbent dose = 0.3 g/100mL)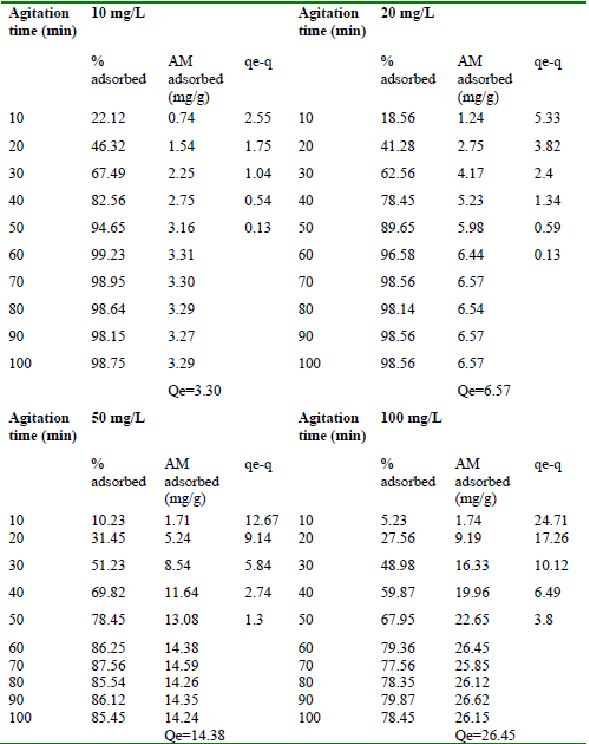
Table 17 : Effect of agitation time and initial dye
concentration on Amaranth adsorption by Tamarind husk. (Adsorbent dose = 0.25 g/100mL)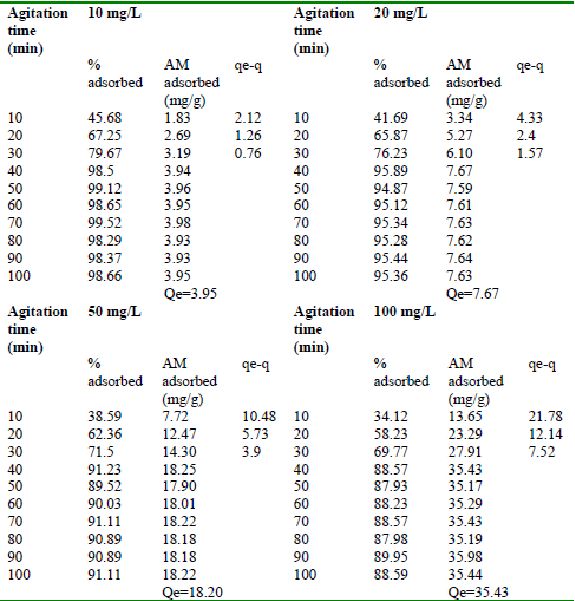
Table 18 : Effect of agitation time and initial dye concentration on
Methylene Blue adsorptionby bengal gram husk (Adsorbent dose = 0.15 g/100mL)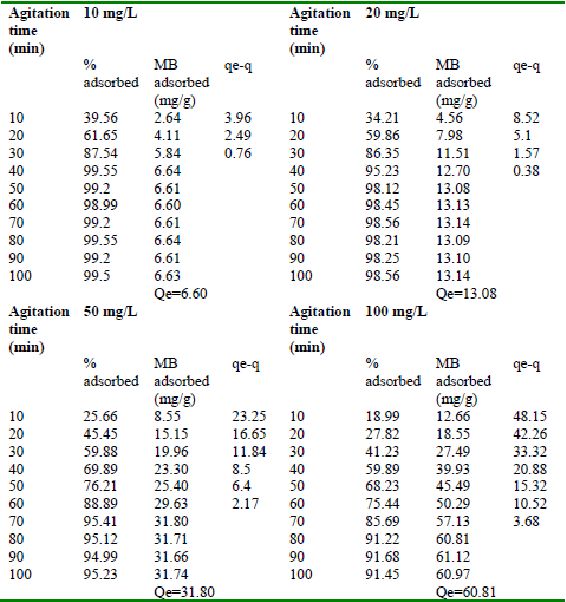
Table 19 : Effect of agitation time and initial dye concentration on
Methylene Blue adsorption by Tur dal husk (Adsorbent dose = 0.1 g/100mL)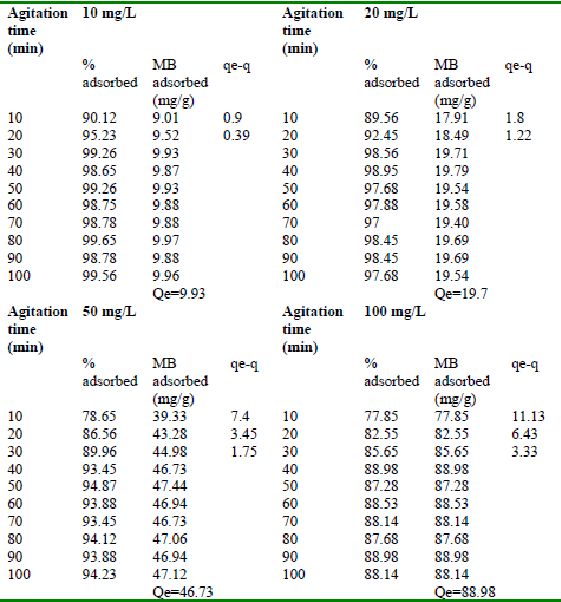
Table 20 : Effect of agitation time and initial dye concentration on
Methylene Blue adsorption by Tamarind husk (Adsorbent dose = 0.2 g/100mL)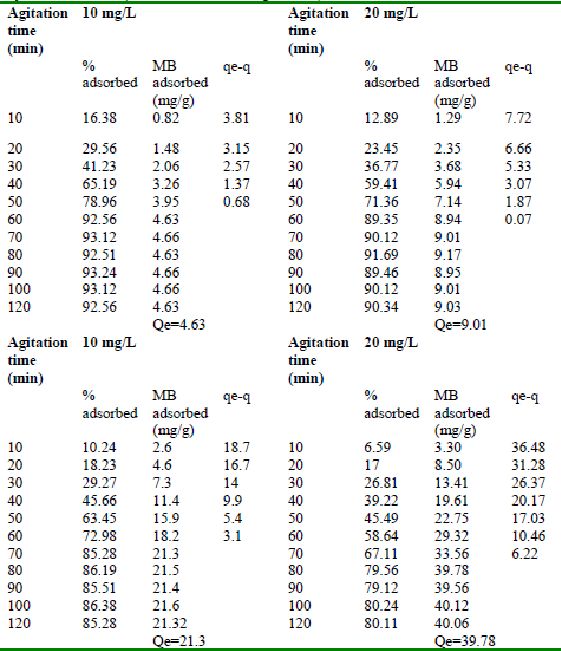
Table 21 : Effect of agitation time and initial dye concentration on
Fast green (FCF) adsorption by bengal gram husk (Adsorbent dose = 0. 3 g/100mL) />
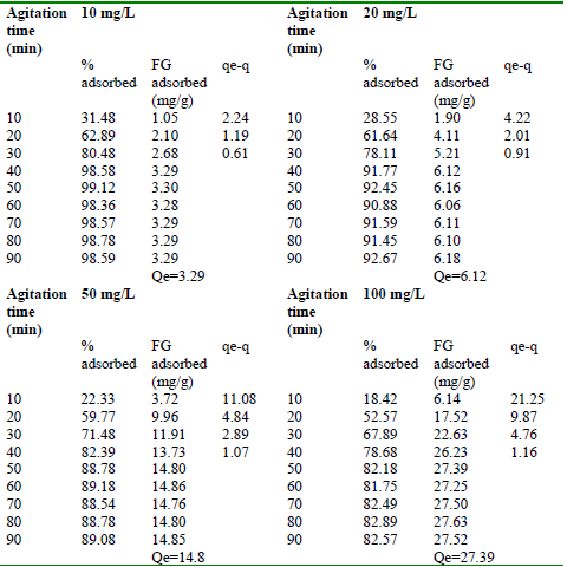
Table 22 : Effect of agitation time and initial dye concentration on
Fast green adsorption by Tur dal husk (Adsorbent dose = 0.15g/100mL)
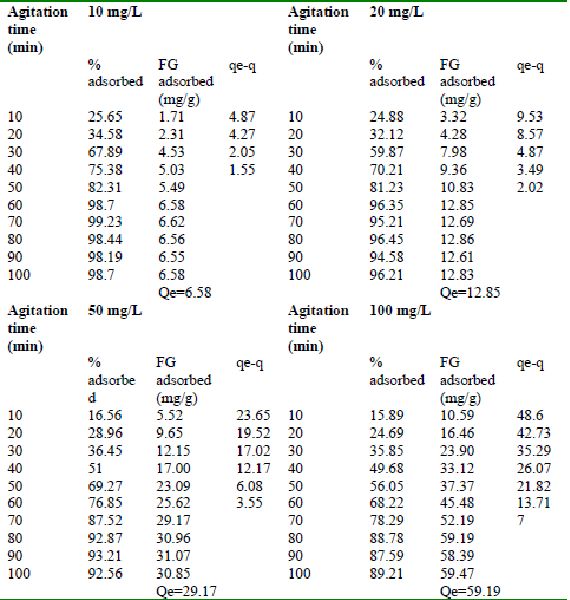
Table 23 : Effect of agitation time and initial dye concentration on
Fast green (FCF) adsorption by Tamarind husk (Adsorbent dose = 0. 3 g/100mL)
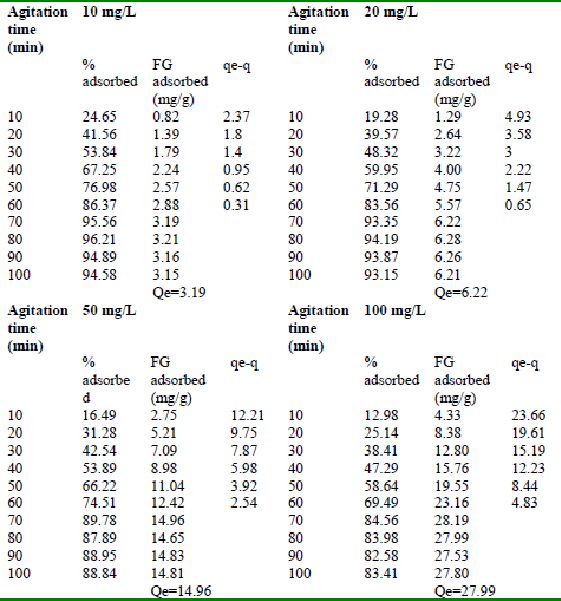
Table 24 : Effect of agitation time and initial dye concentration on
Rhodamine B by bengal gram husk (Adsorbent dose = 0. 35 g/100mL)
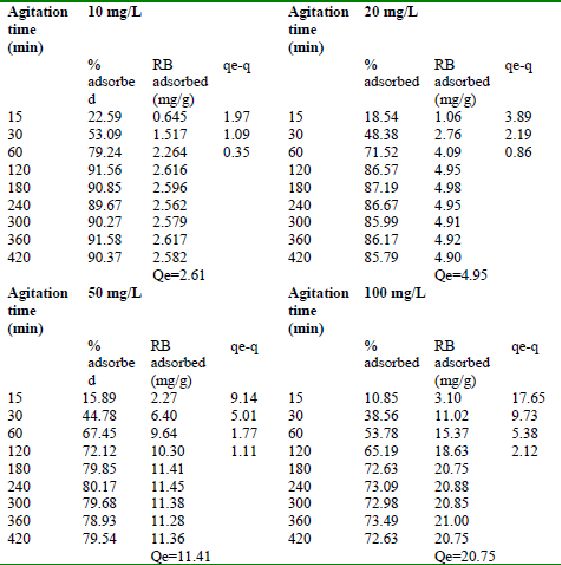
Table 25 : Effect of agitation time and initial dye concentration on
Rhodamine B adsorption by Tur dal husk (Adsorbent dose = 0.5 g/100mL)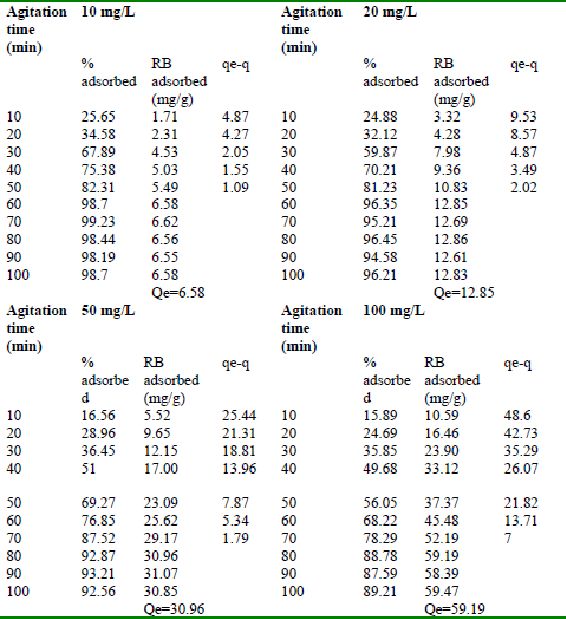
Table 26 : Effect of agitation time and initial dye concentration on
Rhodamine B adsorption by Tamarind husk (Adsorbent dose = 0. 4 g/100mL)
4.3.2 Effect of adsorbent dosage
Results on the effect of adsorbent dosage at various initial dye concentrations are presented in this section. The effect of adsorbent dosage on biosorption of dyes at different husks is given in Figures 19 to 29 Figures 19 to 21 show the effect of adsorbent dosage on the bioremoval of amaranth by bengal gram husk; amaranth removal by tur dal husk and tamarind husk. Similarly Figures 22 to 24 represent removal of methylene blue by the three husks followed by fast green (Figures 25 to 27) and rhodamine B by BGH, TDH and TH (Figures 28 to 30). It was seen from the results that maximum percentage of dye removal occurred with Tur dal husk at a given adsorbent dosage. Most of the dyes were removed at an adsorbent dosage of 0.5 to 2 g/L for all the husks at initial dye concentrations of 10, 20 and 50 mg/L.
Figure 19-21 Effect of adsorbent dose on the Amaranth biosorption by BGH, TDH and
TH respectively (♦ 10 mg/L ■ 20 mg/L ▲ 50 mg/L)
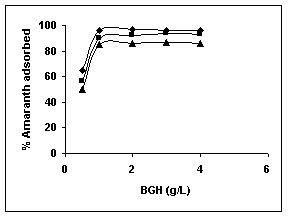 Figure : 19 Figure : 19 |
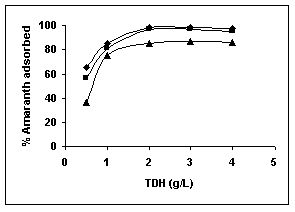 Figure : 20 Figure : 20 |
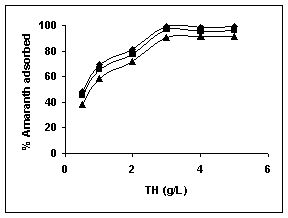 Figure : 21
Figure 22-24 : Effect of adsorbent dose on the Methylene blue biosorption by BGH, TDH and
TH respectively (♦ 10 mg/L ■ 20 mg/L ▲ 50 mg/L)
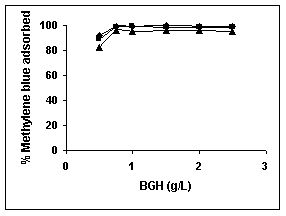 Figure : 22 Figure : 22 |
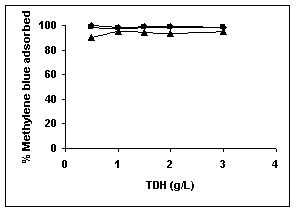 Figure : 23 Figure : 23 |
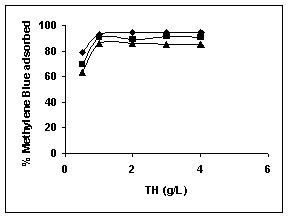
Figure : 24
Figure 25-27 : Effect of adsorbent dose on the Fast green biosorption by BGH, TDH and
TH respectively (♦ 10 mg/L ■ 20 mg/L ▲ 50 mg/L)
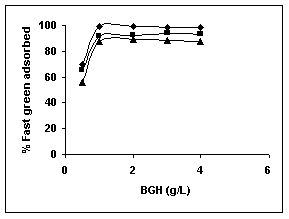 Figure : 25 Figure : 25 |
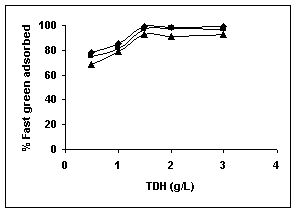 Figure : 26 Figure : 26 |
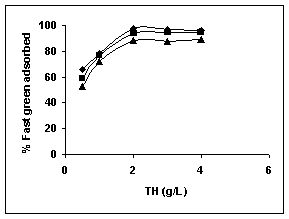 Figure : 27
Figure 28-30 : Effect of adsorbent dose on the Rhodamine B biosorption by BGH, TDH and
TH respectively (♦ 10 mg/L ■ 20 mg/L ▲ 50 mg/L)
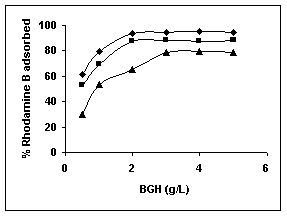 Figure : 28 Figure : 28 |
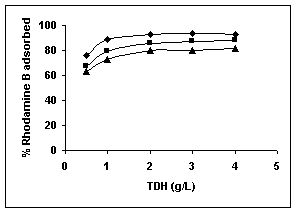 Figure : 29 Figure : 29 |
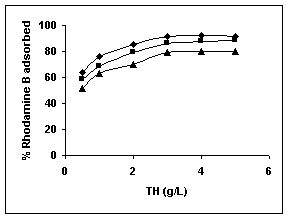
Figure : 30
| 4.3.3 Effect of pH |
 |
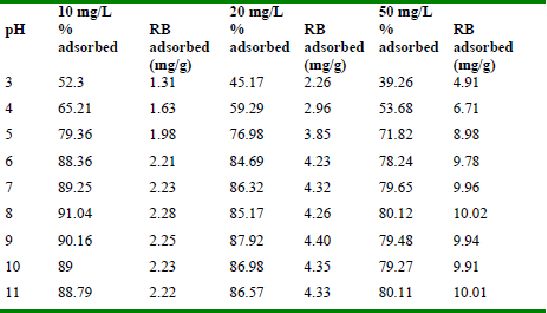
The effect of pH on adsorption of various dyes at different initial dye concentrations is given in Tables and Figures. The adsorption of amaranth by bengal gram husk; tur dal husk and tamarind husk is given in Figures 31 to 33 and Tables 27 to 29. pH effects on Methylene blue by bengal gram husk, tur dal husk and tamarind husk are given in Tables 30-32 and Figures 34 to 36 respectively. Fast green adsorption by the three husks is given in Tables 33 to 35 and Figures 37 to 39. pH effects on Rhodamine B by bengal gram husk, tur dal husk and tamarind husk are given in Tables 36-38 and Figures 40 to 42 respectively.
The maximum percentage of anionic dyes namely amaranth and fast green was biosorbed at pH 2.0. Methylene blue exhibited an optimum range of 6-11 and rhodamine B was adsorbed at pH 7-11.
Figure 31-33 : Effect of pH on the Amaranth biosorption by BGH, TDH and
TH respectively
(♦ 10 mg/L ■ 20 mg/L ▲ 50 mg/L)
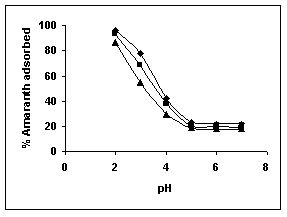 Figure : 31 Figure : 31 |
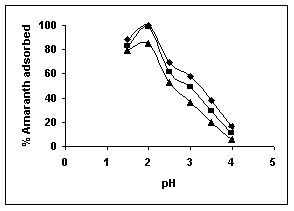 Figure : 32 Figure : 32 |
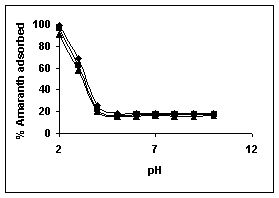 Figure : 33
Figure 34-36 : Effect of pH on the Methylene blue biosorption by BGH, TDH and TH respectively
(♦ 10 mg/L ■ 20 mg/L ▲ 50 mg/L)
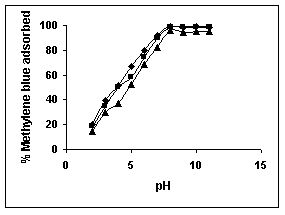 Figure : 34 Figure : 34 |
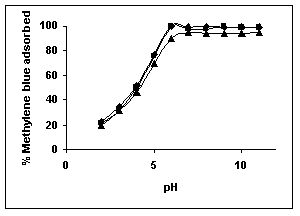 Figure : 35 Figure : 35 |
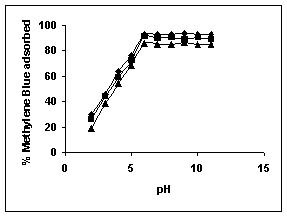 Figure : 36
Figure 37-39 : Effect of pH on the Fast green biosorption by BGH, TDH and TH respectively
(♦ 10 mg/L ■ 20 mg/L ▲ 50 mg/L)
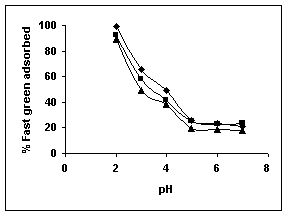 Figure : 37 Figure : 37 |
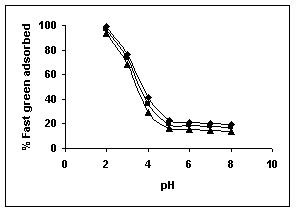 Figure : 38 Figure : 38 |
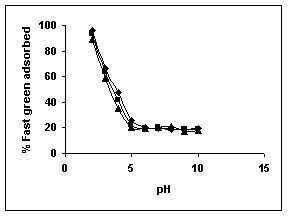 Figure : 39
Figure 40-42 : Effect of pH on the Rhodamine B biosorption by BGH, TDH and TH respectively
(♦ 10 mg/L ■ 20 mg/L ▲ 50 mg/L)
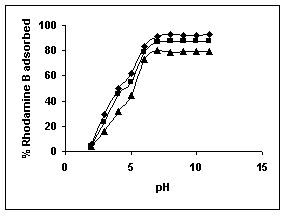 Figure : 40 Figure : 40 |
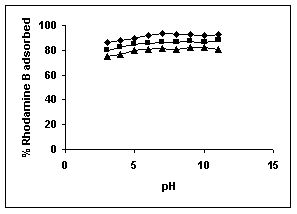 Figure : 41 Figure : 41 |
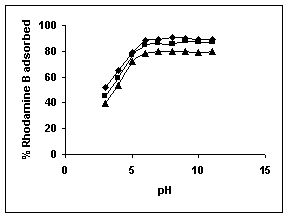
Figure : 42
Table 27 : Effect of pH and initial dye ion concentration on
Amaranth adsorption by Bengal gram husk (Adsorbent dose = 0.25g/100ml)
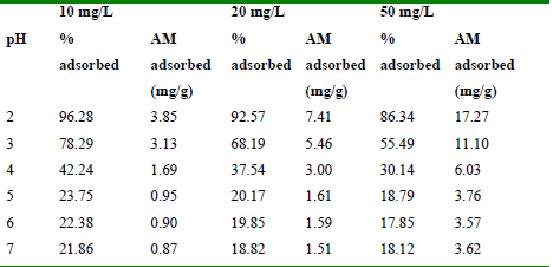
Table 28 : Effect of pH and initial dye ion concentration on
Amaranth adsorption by Tur dal husk (Adsorbent dose = 0.3g/100ml)
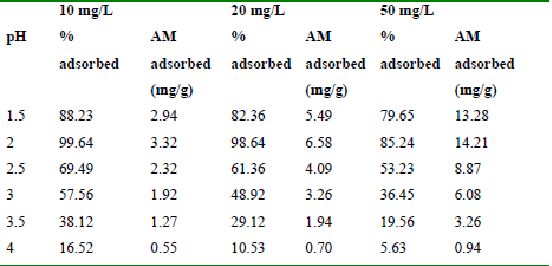
Table 29 : Effect of pH and initial dye ion concentration on
Amaranth adsorption by tamarind husk (Adsorbent dose = 0.25g/100ml)
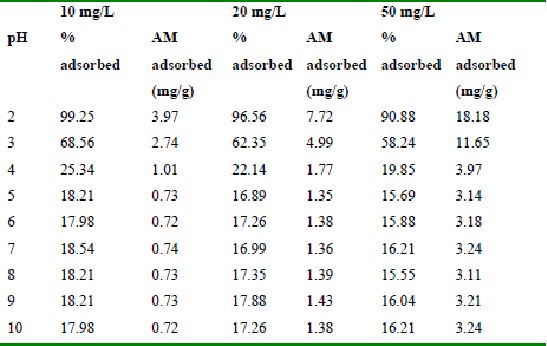
Table 30 : Effect of pH and initial dye ion concentration on
Methylene Blue adsorption by bengal gram husk (Adsorbent dose = 0.15g/100ml)
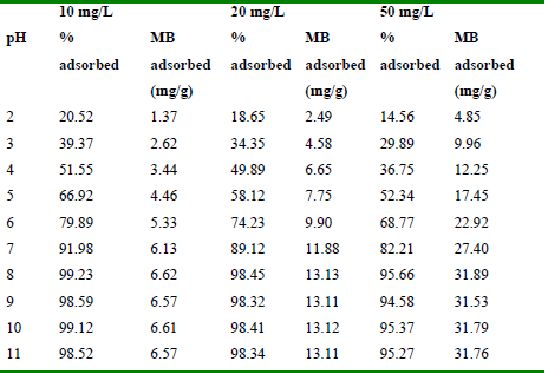
Table 31 : Effect of pH and initial metal ion concentration on
Methylene Blue adsorption by Tur dal husk (Adsorbent dose = 0.1g/100ml)
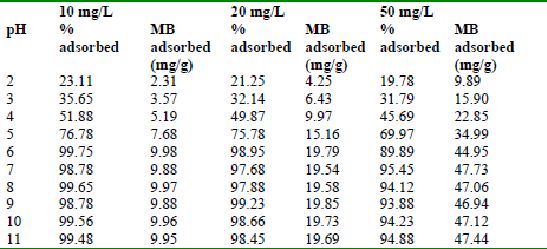
Table 32 : Effect of pH and initial dye ion concentration on
Methylene blue adsorption by tamarind husk (Adsorbent dose = 0.2 g/100ml)
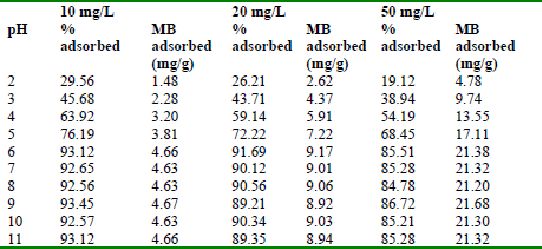
Table 33 : Effect of pH and initial metal ion concentration on
Fast green adsorption by bengal gram husk (Adsorbent dose = 0.3g/100ml)
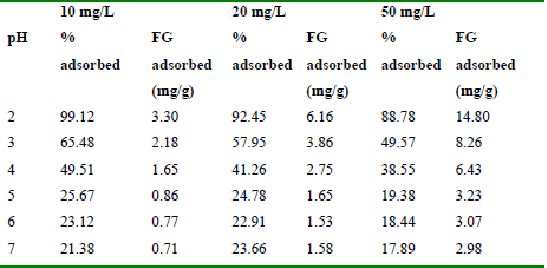
Table 34 : Effect of pH and initial dye ion concentration on
Fast green adsorption by Tur dal husk (Adsorbent dose = 0.15g/100ml)
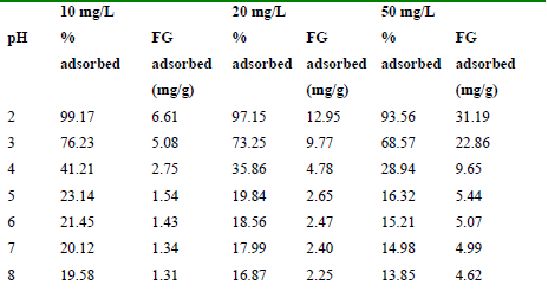
Table 35 : Effect of pH and initial dye ion concentration on
Fast green adsorption by Tamarind husk (Adsorbent dose = 0.3g/100ml)
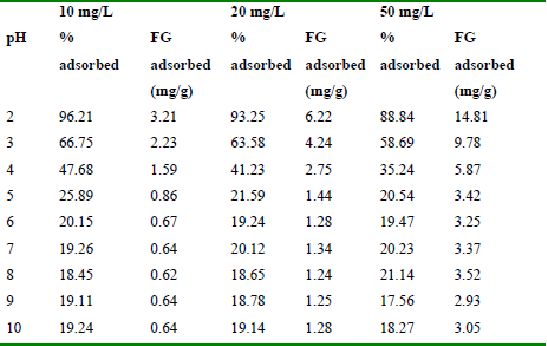
Table 36 : Effect of pH and initial dye ion concentration on
Rhodamine B adsorption by bengal gram husk (Adsorbent dose = 0.35g/100ml)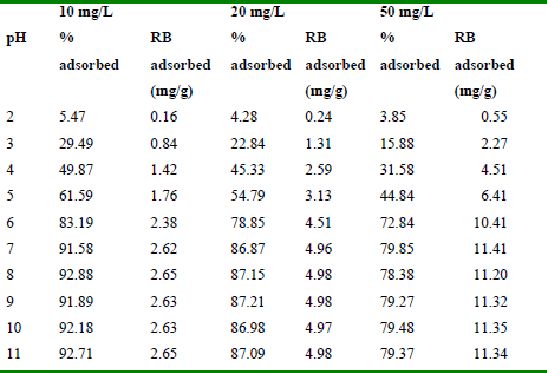
Table 37 : Effect of pH and initial dye ion concentration on
Rhodamine B adsorption by tur dal husk (Adsorbent dose = 0.5g/100ml)
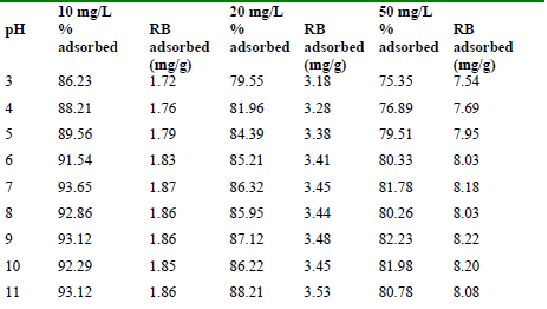
Table 38 : Effect of pH and initial dye ion concentration on
Rhodamine B adsorption by tamarind husk (Adsorbent dose = 0. 4g/100ml)
4.3.4 Adsorption Isotherms
Langmuir adsorption isotherms for amaranth adsorption by bengal gram husk, Tur dal husk and tamarind husk in Figures 43 to 45. Langmuir isotherms for methylene blue adsorption by the three adsorbents in Figures 46-48 and Figures 49 to 51 present the Langmuir isotherms for fast green adsorption. Langmuir plots for rhodamine B adosrption by BGH, TDH and TH are presented in Figures 52 to 54. The linear plots between Ceq vs Ceq/q shows that the three adsorbents namely BGH, TDH and TH followed Langmuir adsorption isotherm.
Figure 43-45 : Langmuir adsorption isotherm for Amaranth by BGH, TDH and TH respectively
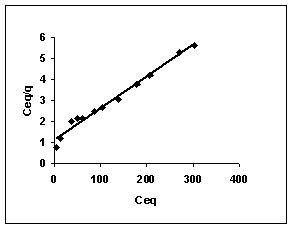 Figure : 43 Figure : 43 |
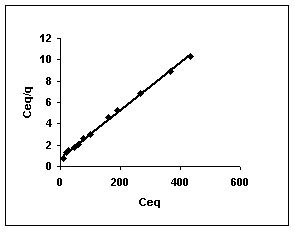 Figure : 44 Figure : 44 |
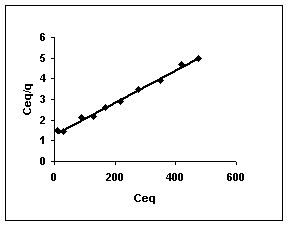 Figure : 45
Figure 46-48 :Langmuir adsorption isotherm for Methylene blue by BGH, TDH and TH respectively
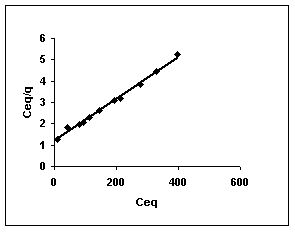 Figure : 46 Figure : 46 |
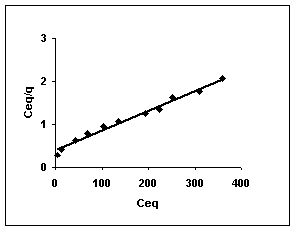 Figure : 47 Figure : 47 |
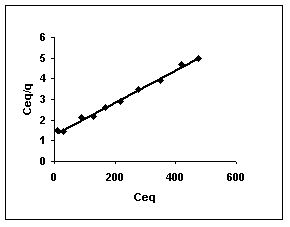
Figure : 48
Figure 49-51 : Langmuir adsorption isotherm for Fast green by BGH, TDH and TH respectively
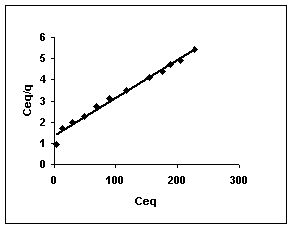 Figure : 49 Figure : 49 |
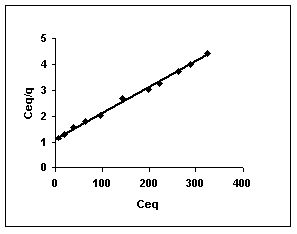 Figure : 50 Figure : 50 |
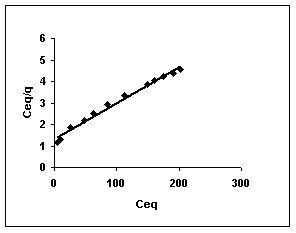
Figure : 51
Figure 52-54 : Langmuir adsorption isotherm for Rhodamine B by BGH, TDH and TH respectively
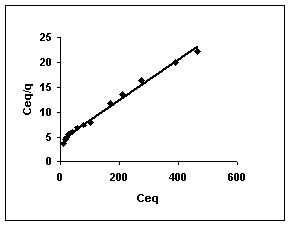 Figure : 52 Figure : 52 |
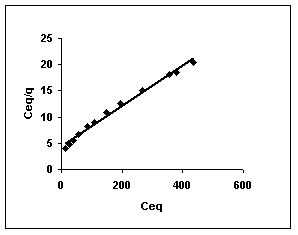 Figure : 53 Figure : 53 |
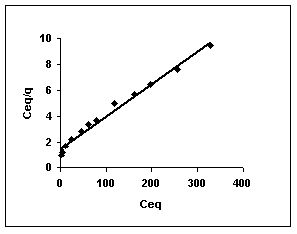
Figure : 54
The Freundlich plots for amaranth biosorption by the three husks namely BGH, TDH and TH are given in Figures 55 to 57, methylene blue adsorption in Figures 58 to 60; fast green biosorption in Figures 61 to 63 and rhodamine B adsorption by the three husks are given in Figures 64 to 66. The adsorption of dyes by the three husks namely BGH, TDH and TH followed Freundlich isotherms.
Figure 55-57 : Freundlich adsorption isotherm for Amaranth by BGH, TDH and TH respectively
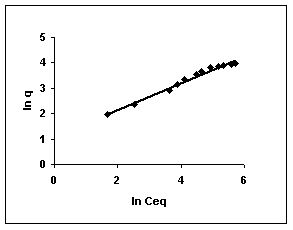 Figure : 55 Figure : 55 |
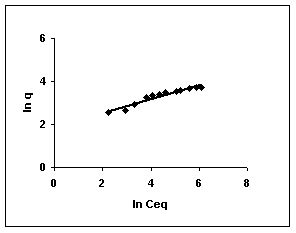 Figure : 56 Figure : 56 |
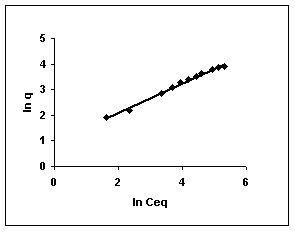 Figure : 57
Figure 58-60 : Freundlich adsorption isotherm for Methylene blue by BGH, TDH and TH respectively
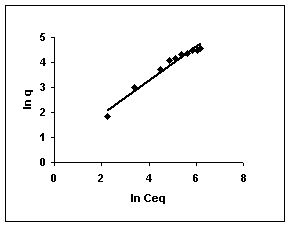 Figure : 58 Figure : 58 |
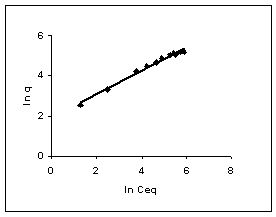 Figure : 59 Figure : 59 |
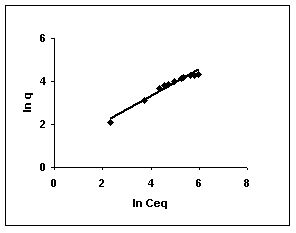 Figure : 60
Figure 61-63 : Freundlich adsorption isotherm for Fast green by BGH, TDH and TH respectively
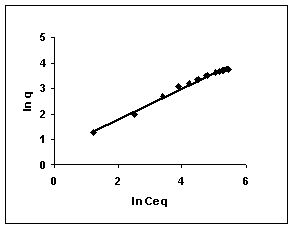 Figure : 61 Figure : 61 |
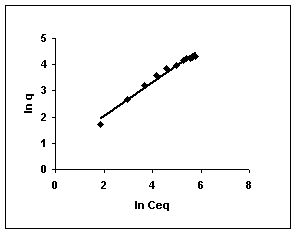 Figure : 62 Figure : 62 |
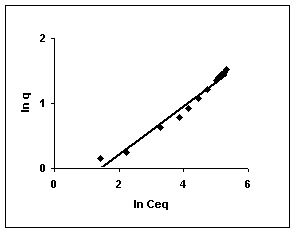
Figure : 63
Figure 64-66 : Freundlich adsorption isotherm for Rhodamine B by BGH, TDH and TH
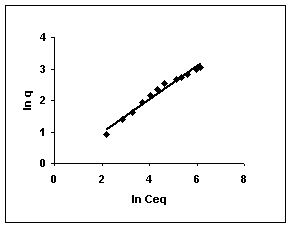 Figure : 64 Figure : 64 |
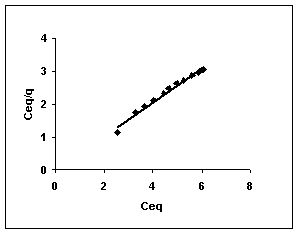 Figure : 65 Figure : 65 |
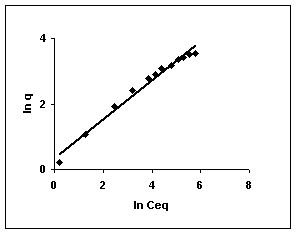 Figure : 66
Table 39 : Sorption isotherm constants and coefficients of determination for adsorption of dyes by TDH
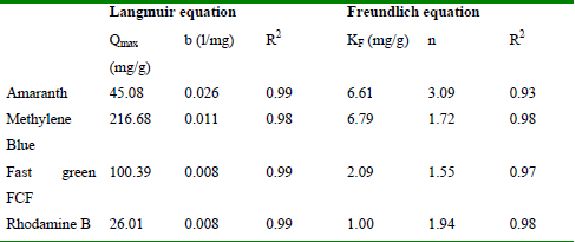
Table 40 : Sorption isotherm constants and coefficients of determination adsorption of dyes for BGH
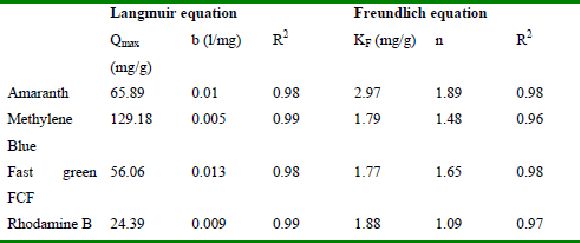
Table 41 : Sorption isotherm constants and coefficients of determination for adsorption of dyes by TH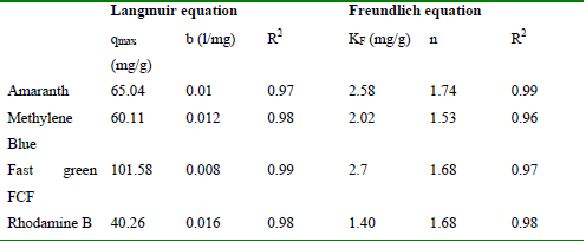
Table 42 : Equilibrium parameter (RL) for adsorption of dyes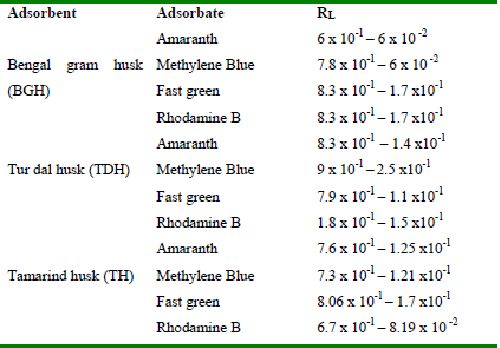
| Adsorption kinetics |
 |
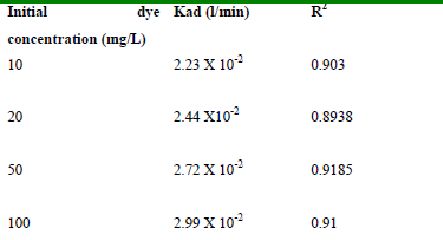
Lagergren plots of log10 (qe-q) vs t for the adsorption of The Lagergren plots are shown in Figures 67 to 75 for adsorption of amaranth by BGH, TDH and TH; Figures 67 to 69 give the Lagergren plots for adsorption of methylene blue by BGH, TDH and TH respectively; Figures 70 to 72 present the Lagergren plots for adsorption of fast green and Figures 73 to 75 give the Lagergren plots and their rate constants for rhodamine B adsorption.
The rate constants that are derived from the Langergren equation are given dyes in Tables
43-53 for dyes. The linear plots of log10 (qe-q) vs t show that the adsorption follows a pseudo first order reaction.
Figure 67-69 : Lagergren plots for Amaranth adsorption by BGH, TDH and TH respectively
(♦ 10 mg/L ■ 20 mg/L ▲ 50 mg/L ● 100mg/L)
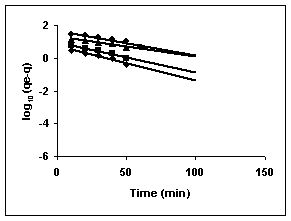 Figure : 67 Figure : 67 |
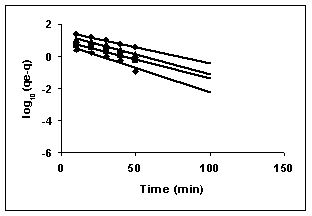 Figure : 68 Figure : 68 |
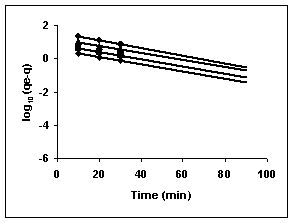 Figure : 69
Figure 70-72 : Lagergren plots for Methylene blue adsorption by BGH, TDH and TH respectively
(♦ 10 mg/L ■ 20 mg/L ▲ 50 mg/L ● 100mg/L)
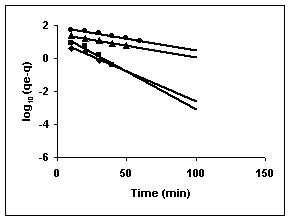 Figure : 70 Figure : 70 |
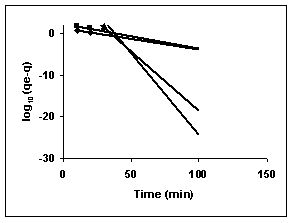 Figure : 71 Figure : 71 |
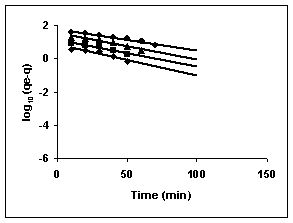 Figure : 72
Figure 73-75 : Lagergren plots for Fast green adsorption by BGH, TDH and TH respectively
(♦ 10 mg/L ■ 20 mg/L ▲ 50 mg/L ● 100mg/L)
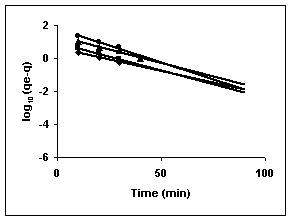 Figure : 73 Figure : 73 |
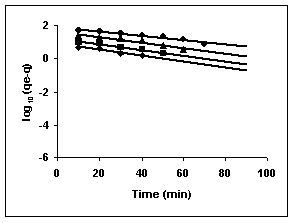 Figure : 74 Figure : 74 |
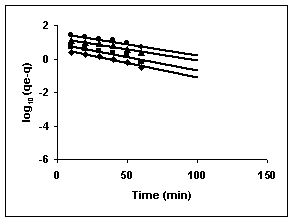 Figure : 75
Figure 76-78 : Lagergren plots for Rhodamine B adsorption by BGH, TDH and TH respectively
(♦ 10 mg/L■ 20 mg/L▲50 mg/L ●100mg/L)
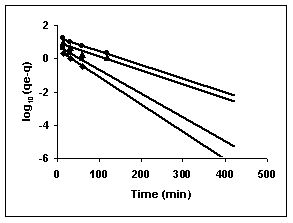 Figure : 76 Figure : 76 |
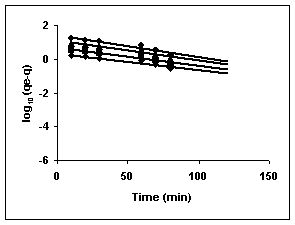 Figure : 77 Figure : 77 |
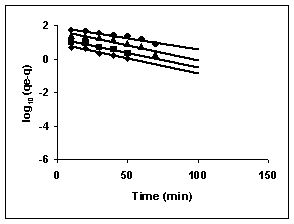 Figure : 78
Table 43 : Effect of initial Amaranth concentration on
Lagergren rate constant by Tur dal husk (Adsorbent dose-0.3g/100 mL; pH 2.0)
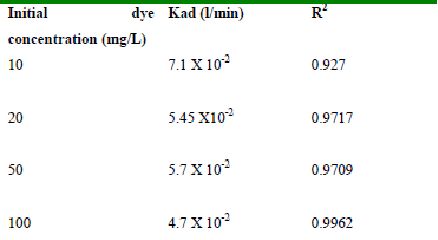
Table 44 : Effect of initial Amaranth concentration on
Lagergren rate constant by Tamarind husk (Adsorbent dose-0.25g/100 mL; pH 2.0)
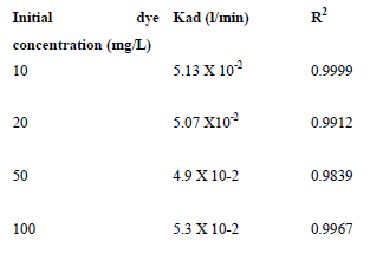
Table 45 : Effect of initial Methylene Blue concentration on
Lagergren rate constant by bengal gram husk (Adsorbent dose-0.15g/100 mL; pH 9.0)
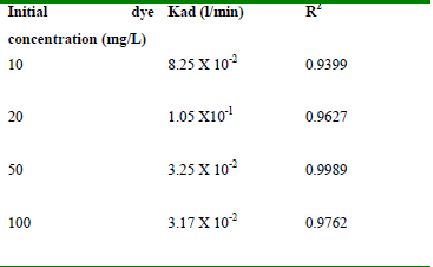
Table 46 : Effect of initial Methylene Blue concentration on
Lagergren rate constant by Tur dal husk (Adsorbent dose-0.10 g/100 mL; pH 9.0)
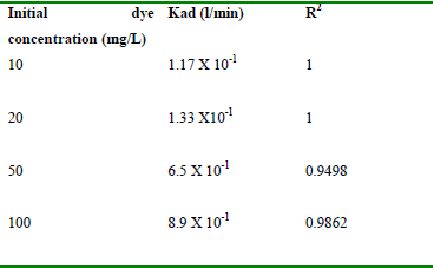
Table 47 : Effect of initial Methylene Blue concentration on
Lagergren rate constant by tamarind husk (Adsorbent dose-0.2 g/100 mL; pH 9.0)
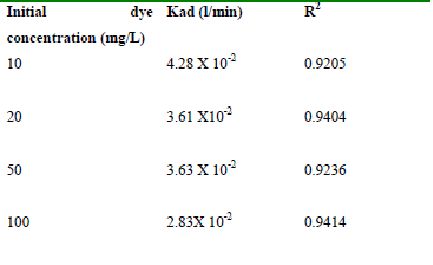
Table 48 : Effect of initial Fast green concentration on
Lagergren rate constant by bengal gram husk (Adsorbent dose-0.30g /100 mL; pH 2.0)
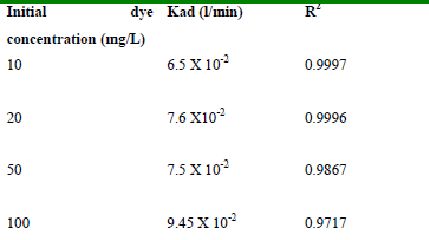
Table 49 : Effect of initial Fast green concentration on
Lagergren rate constant by Tur dal husk (Adsorbent dose-0.15g/100 mL; pH 2.0)
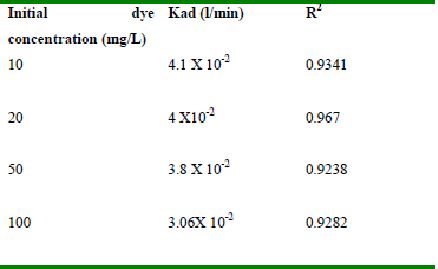
Table 50 : Effect of initial Fast green concentration on
Lagergren rate constant by Tamarind husk (Adsorbent dose-0.30g/100 mL; pH 2.0)
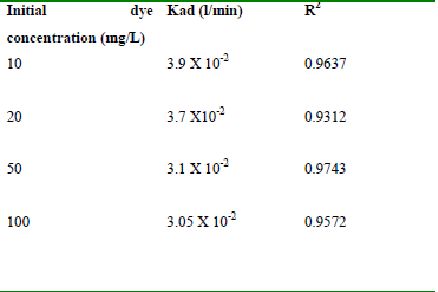
Table 51 : Effect of initial Rhodamine B concentration on
Lagergren rate constant by bengal gram husk (Adsorbent dose-0.35g/100 mL; pH 8.0)
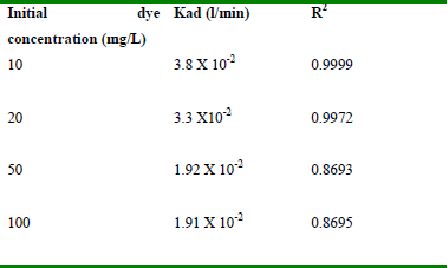
Table 52 : Effect of initial Rhodamine B concentration on
Lagergren rate constant by Tur dal husk (Adsorbent dose-0.5g/100 mL; pH 8.0)
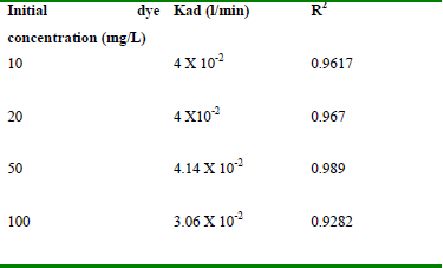
Table 53 : Effect of initial Rhodamine B concentration on
Lagergren rate constant by Tamarind husk (Adsorbent dose-0.4g /100 mL; pH – 2.0)
4.3.6 Desorption studies
Figure 79-82 presents the desorption of dyes Amaranth, Methylene blue, Fast green and Rhodamine B by BGH, TDH, and TH at different initial pH.
Among the dyes, methylene blue was desorbed the least and amaranth the most. Among the adsorbents, the maximum amount of dyes was desorbed from tamarind husk.
Figure 79-82 : Effect of pH on the desorption of Amaranth, Methylene Blue, Fast green and
Rhodamine B ( BGH■ TDH▲TH)
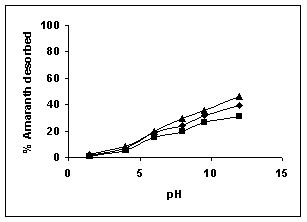 Figure : 79 Figure : 79 |
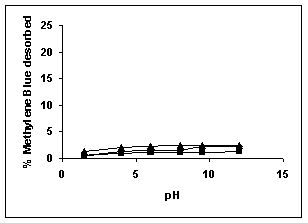 Figure : 80 Figure : 80 |
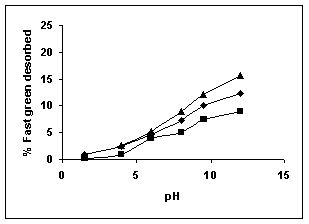 Figure : 81 Figure : 81 |
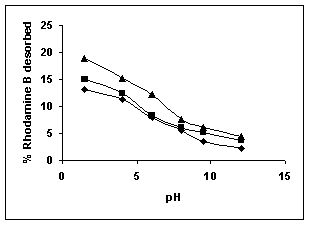 Figure : 82 Figure : 82 |


 Figure : 6
 Figure : 7
 Figure : 9
 Figure : 10
 Figure : 12
  Figure : 13
 Figure : 16
  Figure : 17


 Figure : 19
  Figure : 20
 Figure : 22
  Figure : 23
 Figure : 25
  Figure : 26
 Figure : 28
  Figure : 29

 Figure : 31
  Figure : 32
 Figure : 34
  Figure : 35
 Figure : 37
  Figure : 38
 Figure : 40
  Figure : 41


 Figure : 43
  Figure : 44
 Figure : 46
  Figure : 47
 Figure : 49
  Figure : 50
 Figure : 52
  Figure : 53
 Figure : 55
  Figure : 56
 Figure : 58
 Figure : 59
 Figure : 61
  Figure : 62
 Figure : 64
  Figure : 65


 Figure : 67
  Figure : 68
 Figure : 70
  Figure : 71
 Figure : 73
  Figure : 74
 Figure : 76
  Figure : 77


 Figure : 79
 Figure : 80
  Figure : 81
  Figure : 82

