Dr. T.V. Ramachandra
Centre for Sustainable Technologies, Centre for infrastructure, Sustainable Transportation and Urban Planning (CiSTUP), Energy & Wetlands Research Group, Centre for Ecological Sciences, Indian Institute of Science, Bangalore – 560 012, INDIA. E-mail : cestvr@ces.iisc.ac.in Tel: 91-080-22933099/23600985, Fax: 91-080-23601428/23600085 Web: http://ces.iisc.ac.in/energy
Vinay .S
Energy & Wetlands Research Group, Centre for Ecological Sciences, Indian Institute of Science, Bangalore – 560 012, INDIA. E-mail: vinay@ces.iisc.ac.in
Bharath H. Aithal
Energy & Wetlands Research Group, Centre for Ecological Sciences, Indian Institute of Science, Bangalore – 560 012, INDIA. E-mail: bharath@ces.iisc.ac.in
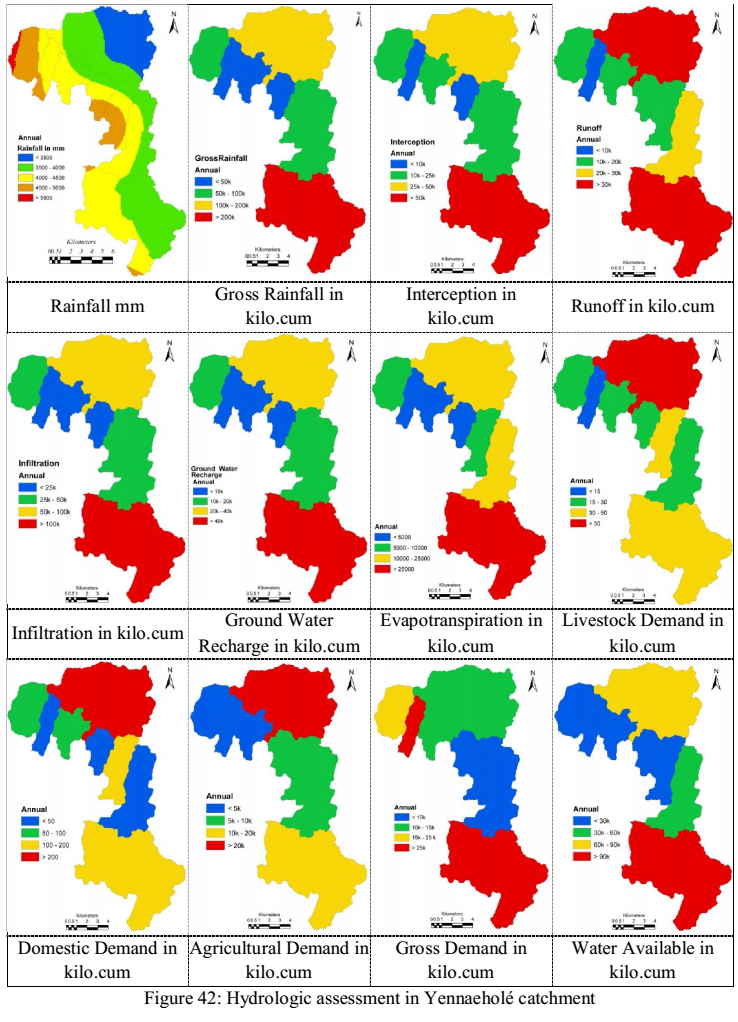
Citation: Ramachandra T.V., Vinay S and Bharath H. Aithal, 2015. Environmental Flow Assessment in Yettinaholé, Sahyadri Conservation Series 48, ENVIS Technical Report 91, EWRG, CES, Indian Institute of Science, Bangalore 560012, India.
| |||||||||||||||||||||||||||||||||||||||||||||||||||||||||||||||||||||||||||||||||||||||||||||||||||||

![]](f31.png)