 |
ENVIRONMENT MONITORING IN THE NEIGHBOURHOOD [WORKBOOK] |
*Corresponding author: cestvr@ces.iisc.ac.in
Objective: To estimate the water yield in a catchment (of a lake, pond, stream or river).
Catchment (Drainage area, Drainage Basin or Watershed): The area of land draining water into a water body (fig1). Two neighboring catchments are separated by a ridge (highest land that separates two watersheds). The areal extent of a catchment is obtained by tracing the ridge on a Topographical Map (fig2). Based on the spatial extent, catchments are classified given in table 1.

Fig1: Catchment Map

Fig2 : Topographic map indicating different features
Table1: Classification of Catchments in India
| Sl.no | Type of Catchment | Area in 1000 Hectares |
| 1 | Micro-watershed | Less than1 |
| 2 | Milli-Watershed | 1 – 10 |
| 3 | Sub-Watershed | 10 – 50 |
| 4 | Watersheds | 50 – 200 |
| 5 | Sub-Catchments | 200 – 1000 |
| 6 | Catchments | 1000 – 3000 |
| 7 | Basin | 3000 – 25000 |
| 8 | Region | Greater than 25000 |
Contours: Contours are the imaginary lines on the earth surface with equal elevation. In a topographic map of 1:50000 scale, contours are at every 20 metre interval. Contours with decreasing altitudes with respect to an higher altitude contour indicates hillock, on the contrary increasing contours along a low altitude contour indicates Valley.
Steps involved in Delineating a Catchment:
- Scan the respective topographic map
- Use QGIS, Geo-reference or assign the co-ordinates
- Digitise waterbody as polygons and Stream network as line features.
- Create New features as line or polygon
Go to Layers, New Shape file Select Line or Polygon feature based on the feature to be delineated, add attributes and save. - Load the new shape files created, click on toggle editing, click on add feature and start delineating the feature, save the edits. And stop toggle editing.
- With respect to the water body, digitize its catchmentas polygon feature.
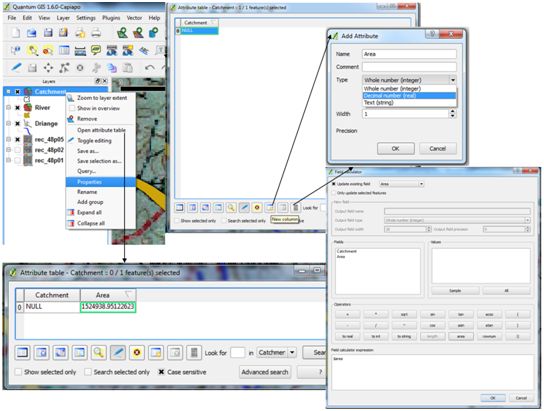
- Compute the spatial extent of the catchment. To measure the Area, right click on the catchment layer, click on properties, toggle editing, add column (the same procedure could be adopted to define the attribute), provide the details of the attribute such as attribute name, type such as text, integer or float and then ok.Click on the Field Calculator, click on update field and select the field to be updated (Area). Add the Area Operator to the field calculator expression to estimate the area of the polygon (Catchment). Save Edits and Stop Toggling.
- Click on the Open Attribute to obtain the information about the area estimated. [very important: if you have the coordinate system in latitude longitude degree decimal coordinate system, are would be in square degrees, if the coordinate system is UTM then the area would be as square metres. To convert square degrees to hectares multiply the area measured with 1100*1100, and to convert square metres to hectare divide area measured by 10000]. In the above example demonstrated, area is 152.5 Hectares.


Similarly, other measurements such as distance, coordinates, centroids etc. along with other vector operations could be made using Calculator TOOL.
Rainfall: Daily Rainfall data at different locations are observed using rain gauges as millimeter and maintained by India Meteorological Department (IMD), Public Works Department (PWD), Water resources Development Organisation (WRDO), Agriculture Department, Revenue Department, Forest Department, etc, and is as depicted in fig.3. Each rain gauge represents rainfall over an area assuming rainfall is uniform in its vicinity
Fig 3: Rain Gauge stations
.
To analyze the rainfall trend and dynamics over a region, seasonal and annual rainfall data for atleast 10 to 20 year.
Steps involved in analyzing rainfall trend in the basin:
- Rainfall data for 15 to 20 years shall be acquired from the agencies such as IMD (Indian Meteorological Department), WRDO, Statistical department etc.
- Rain gauge stations inside and near to the basin are identified based on the location of the rain gauge stations.
- Annual data is plotted as a graph to understand the dynamics of rainfall over time.

- Based on the annual rainfall trend, seasonal variation in the watershed is estimated

Extraction of Land use details from Google Earth: Google earth provides satellite images with high resolution, this could be used to identify different types of land uses in the basin.
Steps involved in extraction of landuse features from Google earth:
- The delineated catchment would be in the form of xxx(filename).shp format i.e., as a shape file, first convert the same to kml. Right click on the shape file, click on save as, click on format and select KEYHOLE MARKUP LANGUAGE (KML) to convert the convert the file to kml, save the file
- Double click on the saved ‘kml’ to open the same in Google earth
- Within the watershed, start digitising layers as polygons and save as ‘kml’.
- ‘kml’ files are imported in QGIS, and converted as shape file (same procedure as step1)
- Calculate the are under each landuse using Map calculator tool

Example: Agriculture as a layer, Forest as a layer, water body as a layer etc

Assessment of water yield: Water yield or Surface Runoff is the precipitated water that drains to a water body in a catchment. Surface runoff occurs during monsoon. Factors affecting Runoff are the Slope, Drainage, Land use, Soil Characteristics, Rainfall. The total quantity of water that can be expected in a stream in a given period of time such as monthly, annual etc… is referred to as Runoff Yield.
Runoff Yield (Q) as kilo.cubic metre (Million Litres) is estimated empirically (eq.1) as a function of Rainfall (P) in mm and Area under different land uses (A) in Hectares.
Q = (C*P*A)/100 1
Where Q = Runoff Yield in Million litres
C = Runoff Coefficient of a particular land use
A = Area under land use in Ha
P = Mean Monthly rainfall in mm (average of 10 – 15 years)
Runoff Coefficient under different land use is as specified in table 2.
| Land Use | Runoff Coefficient |
| Forests | 0.1 – 0.2 |
| Plantations | 0.2 – 0.6 |
| Agriculture | 0.4 – 0.7 |
| Open Spaces, Grasslands | 0.5 – 0.8 |
| Built-up | 0.7 – 0.9 |
| Rocky Areas | 0.8 - 1.0 |
Water Yield Estimation
| Location Description | |||||||||
| Catchment Extent | Latitude | Longitude | |||||||
| min | min | ||||||||
| max | max | ||||||||
| Catchment Area in Ha | |||||||||
| Annual Rainfall in mm | |||||||||
| Land Use | Area in Ha A | Runoff Coefficient C | |||||||
| Forests | |||||||||
| Plantations | |||||||||
| Agriculture | |||||||||
| Open Spaces, Grasslands | |||||||||
| Built-up | |||||||||
| Rocky Areas | |||||||||
| Monthly rainfall P in mm | January | February | March | April | May | June | |||
| July | August | September | October | November | December | ||||
| Seasonal Catchment Yield in Million Litres Q = (C*A*P)/100 | |||||||||
| Land Use | January | February | March | April | May | June | |||
| Forests | |||||||||
| Plantations | |||||||||
| Agriculture | |||||||||
| Open Spaces, Grasslands | |||||||||
| Built-up | |||||||||
| Rocky Areas | |||||||||
| Gross Yield Q | |||||||||
| Land Use | July | August | September | October | November | December | |||
| Forests | |||||||||
| Plantations | |||||||||
| Agriculture | |||||||||
| Open Spaces, Grasslands | |||||||||
| Built-up | |||||||||
| Rocky Areas | |||||||||
| Gross Yield Q | |||||||||
| Annual Catchment Yield = (Σ Q) | Million Liters | ||||||||