 |
ENVIRONMENT MONITORING IN THE NEIGHBOURHOOD [WORKBOOK] |
*Corresponding author: cestvr@ces.iisc.ac.in
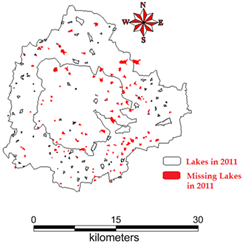 |
Bangalore city | Greater Bangalore | |
| 1973 | 58 | 207 | |
| 2010 | 10 | 93 |
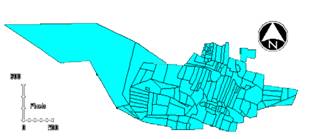
Objective: Mapping water bodies (Spatial extent and location)
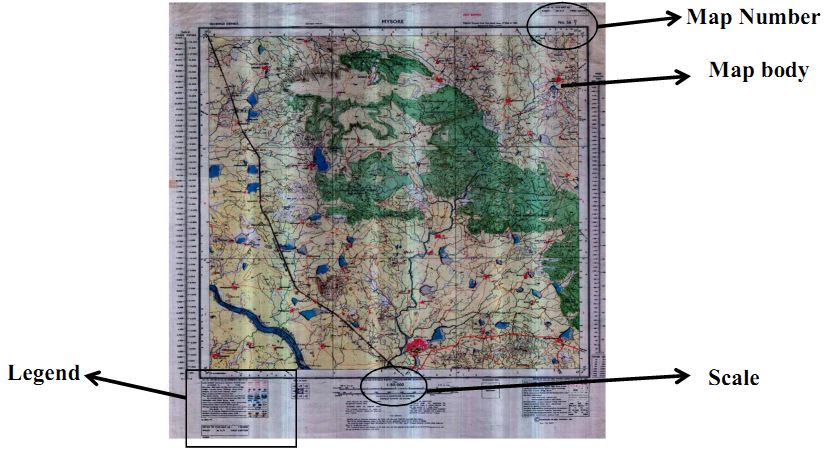
MAP: Is a diagrammatic representation usually on a flat surface of the whole or a part of the Earth surface showing various features like road, water bodies etc.
Types of Maps: Maps are classified based on (a) scale- On the basis of scale (ex. Cadastral Maps or Revenue Maps, Topographical Maps, Geographical Maps, Atlas Maps etc.,) (b) Contents and purpose (ex: Road map, Railway map, cultural map)
 Cadastral Map These maps are drawn on large scale ex: administration and collection of revenue |
|
|
How to read a MAP?
-
North arrow represents North direction
-
Scale is the ratio between distances on a map and the corresponding distances on the earth’s surface.
-
Legend provides details of the content of the map.
Scale represents map unit on the ground. For example, scale of 1:250,000 means that 1unit on the map corresponds to 250,000 units on ground.
 Large scale means maps shows a larger details smaller area coverage (1:10,000). Gives details of each parcels of land |
 Small scale maps means maps shows lesser details but large area covered |
Examples of Scales: 57/H/9/NE – 1:25000 map of North east area of Bangalore, 57/H/9 – 1:50000 Map of Bangalore,
Map: 57 indicate 1:1 million, 57/H -1:250,000 shows the district, 57– 1:100000 covers Indian subcontinent.
Map Numbering
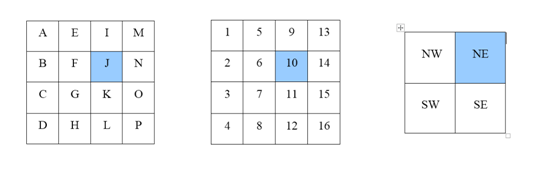
| 57 - 40 x 40 on 1:1M scaleShaded cell shows 57 J of scale 1: 250000 | 57 - 10 x 10 on 1: 250000 scaleShaded cell shows 57 J/12 of scale 1:50000 scale | 57 - 15' x 15' on 1: 50000 scaleShaded cell shows 57 J/12/NE of scale 1:25000 scale |
MAP Coordinate system: A coordinate system is a standardized method for assigning codes to locations so that locations can be found easily. Good example is Latitude (LAT) Longitude (long) system.
-
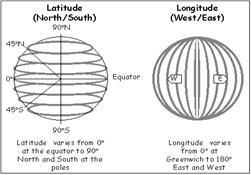
Latitude:specifies the north-south position of a point on surface of Earth. Latitude is an angle which ranges from 0° at the Equator to 90° (North or South) at the poles. Reference being equator.
-
Longitude:specifies the east-west position of a point on surface of Earth, measured as the angle east or west from the Greenwich Prime Meridian, ranging from 0° at the Prime Meridian to +180° eastward and −180° westward.
-
Datum: A datum is a set of reference points on the earth's surface against which position measurements are made and an associated model of the shape of the earth to define a geographic coordinate system.
-
Projection:A transformation of the spherical or ellipsoidal earth onto a flat map is called a map projection.ex: Projection: Cylindrical UTM projection as shown below, Datum:WGS84
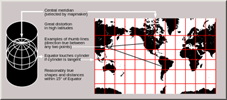
Source: WIKI
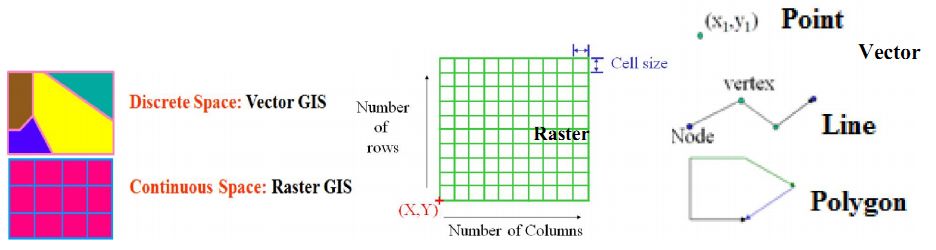
Spatial data: Data that represents the space is referred as spatial data. Two kinds of spatial data are (i) raster and (ii) vector. Both these are used in GIS (Geographic Information System) to store and retrieve geographical data.
-
Raster data: is a collection of cells which have a single value and are organized in arrays in number of rows and columns. Ex: Your own photograph is a raster data, when zoomed you can see pixels
-
Vector data: are associated with points, lines, or polygons, Points are located by coordinates, Lines are described by a series of connecting line segments and polygons are described by a series of vectors enclosing the area.
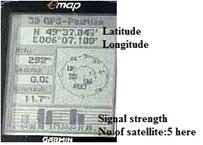
Global Positioning System (GPS): GPS help in locating the co-ordnates of a location, which helps in the navigation. This works on the constellation of 24 communication satellites. Minimum of three satellite signals are necessary for correct measurements.

Conversion from Degree Decimals to Degree, Minutes, Seconds
Consider the example 96.31°, the whole units of degrees will remain the same (i.e. in 96.31°, longitude, start with 96°).
Multiply the decimal by 60 (i.e. .31 * 60 = 18.6).
The whole number becomes the minutes (18').
Take the remaining decimal and multiply by 60. (i.e. .6 * 60 = 36).
The resulting number becomes the seconds (36"). Seconds can remain as a decimal.
GPS NAME: ………………… Area surveyed…………………..
Date: …………………, Time: ………….., Name: ……………..
| Location (inlet of lake, near place etc.) | Waypoint number | Latitude | Longitude |