Opportunities for Decentralized Wind Applications in Uttara Kannada
SUMMARY
Wind is one of the promising renewable sources which can substitute fast depleting fossil fuels sources. Windmills have been used for centuries to grind grain and pump water in rural areas. It has the advantage of being harnessed on a local basis for applications in rural areas and remote areas. Water pumping for agriculture and plantations is probably the most important application that contributes to the rural development through multiple cropping. Wind resource assessment is the primary step towards understanding the local wind dynamics of a region. Climatic average datasets of meteorological variables containing wind speed data for the period of 1961~1990 compiled from different sources I were used for the potential assessment of wind speed in the district. These were validated with the dataof meteorological observatories at Karwar, HonnavarandShirali obtained from the Indian Meteorological Department, Government of India, Pune. Analysis showed the seasonal variation of wind speed in the region. Wind speed varies from 1.9 m/s (6.84 km/hr.) to 3.93 m/s (14.15 km/hr.) throughout the year with minimum in October and maximum in June and July. District experiences annual average wind of 2.5 m/s to 3.0 m/s in all taluksindicating the prospects for WECS installation. Hybridizing wind energy systems with other locally available resources (solar, bioenergy) would assure the reliable energy supply to meet the energy demand at decentralized levels.
Keyword: Windmill, Mean wind speed, Decentralized generation, Hybridization of resources
1. INTRODUCTION
Energy extraction from wind is one of the oldest energy harvesting technologies that is being used for centuries. Winds are caused by the rotation of the earth and the heating of the atmosphere by the sun. The total annual kinetic energy of air movement in the atmosphere is estimated to be about 3 x 10⁵ kWh or about 0.2% of the solar energy reaching the earth. The maximum technically usable potential is estimated to be theoretically 30 trillion kWh per year, or about 35% of current world total energy consumption [1]. The power in the wind blowing at 25.6 km/h is about 200 W/m2 of the area swept by the windmill. Approximately 35% of this power can be captured by the windmill and converted to electricity. The kinetic energy of the air can be transformed to mechanical and then to electrical form of energy using fans, gears, turbine and generator system. Windmills are the modern world electricity harvesting technologies which accounts for more than 2 GW installed capacity worldwide [2]. Electricity generation from wind is directly proportional to the air density, swept area of blades and cube of the wind velocity. Since the wind velocity is more tentative, hence optimizing the blade area, maximum energy can be extracted for particular wind speed at given place [3].
 (1)
(1)
where, P –Wind power ,  – Air mass density ,
A – Swept area (area of wind flow), V – Wind velocity
– Air mass density ,
A – Swept area (area of wind flow), V – Wind velocity
The annual wind speed at a location is useful as an initial indicator of the value of the wind resource. The relationships between the annual mean wind speed and the potential value of thewind energy resource are listed below;
| Annual Mean wind speed @ 10m Ht. (m/s) |
Indicated value of wind resource |
| <4.5 |
Poor |
| 4.5-5.4 |
Marginal |
| 5.44 - 5.7 |
Good to Very Good |
| > 6.7 |
Exceptional |
Uttara Kannada district located in the west coast and inWestern Ghats region of Karnataka state is blessed with good wind potential. Harnessing of wind energy could play a prominent role in meeting the energy demand in the region since electricity supply is unreliable in most of the times. Wind energy potential in the district could meet the regional electricity demand through wind energy conversion system (WECS) avoiding plenteous greenhouse gas (GHG) emission and fossil fuel. It can be harnessed locally in a decentralized manner for applications in rural areas and remote areas such as water pumping for agriculture and plantations. Wind driven electric generators could be utilized as an independent power source and for purposes of augmenting the electricity supply from grids. In coastal densely populated taluks like Karwar, Kumtaand Bhatkal in Uttara Kannada District, decentralized production of electricity would help local industries, especially seasonal agro processing industries like cashew, etc. WECS can be hybridized with solar, biomass and any other available local energy resource to provide cent percent reliable power since wind flow is maximum during monsoon when solar insolation and dry biomass availability is lesser [4].
Wind resource assessment: Wind resource assessment is the primary step towards understanding the local wind dynamics of a region. Wind flow developed due to the differential heating of earth is modified by its rotation and further influenced by local topography. This results in annual (year to year), seasonal, synoptic (passing weather), diurnal (day and night) and turbulent (second to second) changes in wind pattern [5]. Increased heat energy generated due to industries and escalating population in urban areas result in heat islands which affects the wind flow as well.
2. OBJECTIVE
Objective of the present study is to assess the taluk wise annual wind potential in Uttara Kannada district and assess techno-economic feasibility of wind energy harvesting options, to meet the regional electricity demand.
3. STUDY AREA, DATA AND METHODS
Uttara Kannada is a 4th biggest district of Karnataka state, located between 13° 55´ and 15° 31´N and 74° 9´ and 75° 10´ E. Total population of the district is 14,36,847, and more than 70% of the people live in rural area or in semi urban area. District is located in the Western Ghats ranges sheltering abundant flora and fauna. More than 75% of the total area is forest covered and has 140 km costal belt [6].Figure 1 illustrates the topographic undulations of the region. Topographically, the district lies in three distinct zones namely narrow and flat coastal zone, abruptly rising ridge zone and elevated flatter eastern zone. The coastal zone is thickly populated with coconut clad villages. Ridge zone is a part of the main range of Western Ghats, which runs north to south, parallel to the coast. The flat eastern zone joins the Deccan plateau. The taluks, which comprises the narrow flat coastal zone, are: Karwar, Ankola, Kumta, Honnavar and Bhatkal. Similarly, taluks, which comprises the ridge zone, are: Supa, Haliyal, Yellapur, western Sirsi, and western Siddapur. Flatter eastern zone includes Mundgod, eastern Sirsi and eastern Siddapur. Four agro-climatic zones based on geography and climate are coastal, evergreen, dry deciduous and moist deciduous. There are 1291 villages, 7 towns, 5 city municipal corporations/town municipal corporations/outward growth/census towns and 2 reservoirs in the district [http://uttarakannada.nic.in/].
Data and Method
Synthesised wind data: Synthesised wind data available from various sources provide preliminary understanding of the wind regime of a region. Depending on the physiographical features and climatic conditions, these data help assess wind potential in the region of interest validated by long term surface wind measurements.
There many wind speed data sets are available of different time periods such as National Aeronautical and Space Agency (NASA) Surface Meteorology and Solar Energy (SSE), National Oceanic and Atmospheric Administration (NOAA-CIRES), Climate Research Unit (CRU) etc. However previous studies are evidently showed that CRU data are reliable and are closer to the Indian Meteorological Department (IMD) surface data and hence used in the present study [7].CRU at the University of East Anglia maintains climatic average datasets of meteorological variables whichcontains wind speed data for the period of 1961~1990 compiled from different sources. Further, inter and intra variable consistencychecks are performed to minimize data consolidation errors. The Global Land One-km Base Elevation Project (GLOBE) data of the National Geophysical Data Center (NGDC) were re-sampled to 10’×10’ (ten minute spatial resolution) elevation grids where every cell with more than 25% land surface (those below 25% being considered water bodies) represents the average elevation of 100~400 GLOBE elevation points. The climatic average of wind speeds measured at 2 to 20 m anemometer heights (assumed to be standardized during collection) collated from 3950 global meteorological stations together with the information on latitude, longitude and elevation were interpolated based on a geo-statistical technique called thin plate smoothing splines. Elevation as a co-predictor considers topographic influence on the wind speed and proximity of a region to the measuring station improves the reliability of the interpolated data. During interpolation inconsistent data were removed appropriately. This technique was identified to be steadfast in situations of data sparseness or irregularity [8]. The 10’×10’ spatial resolution wind speed data as climatic averages were available for all global regions (excluding Antarctica) [9].
Data from IMD stations located in the district are also acquired for respective locations and which gave the satisfactory results comparingwith CRU data set. There are 4 IMD stations in the districts which are listed in Table 1. Cup counter anemometers with hemispherical cups measuring 7.62 cm in diameter were used in Indian Meteorological Department (IMD) observatories until 1973. During 1973-1979 these anemometers are replaced with 3 cup anemometers with 127 mm diameter conical cups, which are placed at l0 m above ground, over open terrain in conformity with international practice.
Table 1: IMD stations in Uttara Kannada
| Location |
Latitude |
Longitude |
Elevation (m) |
| Karwar |
14° 47' |
74° 08' |
4 |
| Kumta |
14° 26' |
74° 25' |
8 |
| Honnavar |
14° 17' |
74° 27' |
26 |
| Shirali |
14° 05' |
74° 32 ' |
45 |
| Sirsi* |
14° 62' |
74°85' |
610 |
Data from the meteorological observatories at Karwar(for the period 1952-1989), Honnavar (for the period 1939-1989) and Shirali (for the period 1974-1989) obtained from the Indian Meteorological Department, Government of India, Pune, and daily wind data for the period 1990-1993 for these observatories, from the Indian Meteorology Department, Bangalore. The primary data obtained by installing a cup counter anemometer with mechanical counter fixed on 5 m tall guyed masts at Sirsi and Kumta. The anemometer readings were noted down every three hours during the day and mean wind speeds were obtained.
Anemometers at different meteorological stations are set at different height levels. The wind speed recorded at each station has to be adjusted to any constant height prior to analysis. The standard height according to the World Meteorological Organization is 10 m above the ground level which is used for the analysis [10]. The horizontal component of the wind velocity varies a great deal with height under the influence of frictional and impact forces on the ground. The most common model for the variation of horizontal velocity with height is given by the logarithmic wind profile equation 2 [11]
(V1/V2) = (HI/H2) α (2)
Where V1 is a wind speed at height H1 of 10m above ground level, V2 is a wind speed at height H2 above ground level, and α is the roughness factor which is determined by substituting the wind speed data obtained with anemometer height in various wind directions, and found to be 0.30. Table 2 gives the month wise average wind speed in the respective locations.
Table 2: Monthly variation in mean wind speed (km/hr) [3]
| Month |
Karwar |
Kumta |
Honnavar |
Shirali |
Sirsi |
| January |
5.96 |
5.95 |
5.95 |
6.78 |
6.92 |
| February |
6.55 |
7.76 |
6.00 |
6.87 |
6.88 |
| March |
8.15 |
9.09 |
6.10 |
7.03 |
7.20 |
| April |
9.65 |
9.42 |
6.20 |
7.25 |
8.38 |
| May |
11.82 |
9.87 |
7.21 |
7.84 |
9.09 |
| June |
12.01 |
11.83 |
7.50 |
8.30 |
11.19 |
| July |
15.27 |
13.03 |
7.72 |
8.50 |
18.17 |
| August |
11.98 |
11.54 |
6.66 |
7.64 |
14.19 |
| September |
7.44 |
6.71 |
4.87 |
5.56 |
11.14 |
| October |
5.41 |
6.59 |
4.55 |
5.42 |
8.39 |
| November |
4.75 |
6.29 |
5.04 |
6.76 |
7.72 |
| December |
5.04 |
7.73 |
6.00 |
9.51 |
8.42 |
Figure 2 shows the comparison of mean wind speed in five IMD stations. At higher elevations in the district mean wind speed is comparatively higher and also in coastal region. Wind speed recorded at Honnavar and Shirali stations are lower which are placed at an elevation of 26 m and 45 m respectively.
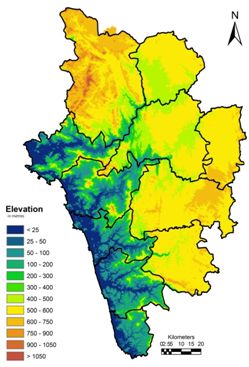
Figure 1: Digital Elevation Model of Uttara Kannada, Karnataka
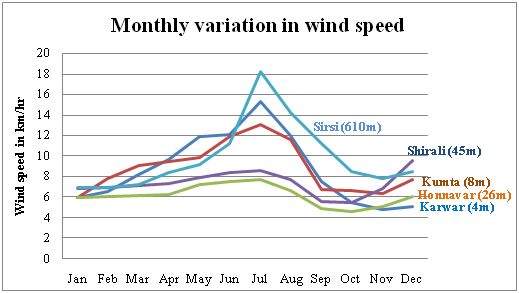
Figure 2: Monthly variation in wind speed
4. RESULTS AND DISCUSSION
Wind profile of Uttara Kannada: Wind speed is seasonal dependent which is normally at its maximum during monsoon season. Wind speed varies from 1.9 m/s (6.84 km/hr.) to 3.93 m/s (14.15 km/hr.) throughout the year resulting minimum in October and maximum in June and July. Annual average wind sped in the district ranges from 2.54 ± 0.04 m/s (9.144±0.144 km/hr.) in Haliyaltaluk to 2.70 ± 0.05 m/s (9.72±0.18 km/hr.) in Karwartaluk. Figure 3 gives the taluk wise annual average wind speed of the district. Ample amount of electrical energy can be generated using blowing wind through wind farms which could meet the major fraction of the current electricity demand of the district through decentralized generation.
Seasonal variation of wind speed: Speed of the wind is quite uncertain and dependent on ambient temperature and pressure, vegetation cover, elevation, topography of the site etc. Uttara Kannada has a mixed topography includes coastal belt, low and high elevation area with forest cover and also planes. From February to May district experiences summer with higher temperature in costal (Karwar, Honnavar, Kumta, Bhatkal and Ankola) and in planes (Mundgod and Haliyal) and comparatively lower temperature in taluks of higher altitudes (Sirsi, Siddapur, Yellapur and Supa). Figure 4 to 6 gives the mean wind speed variability in the district during summer, winter and monsoon months.
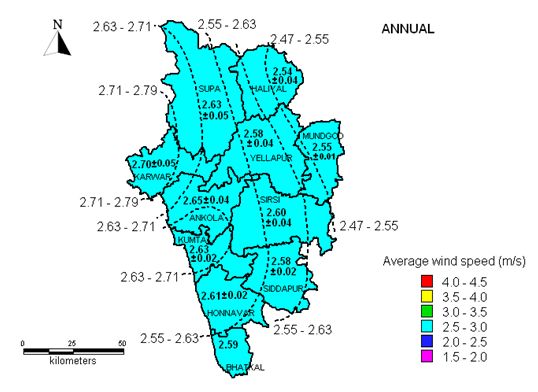
Figure 3: Average annual wind speed of Uttara Kannada
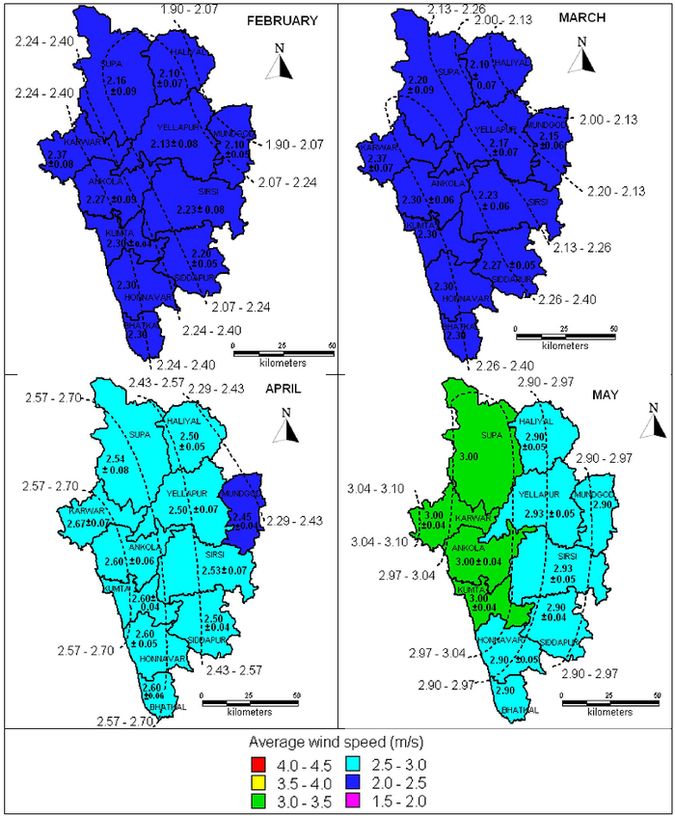
Figure 4: Wind speed variation during summer (m/s)

Figure 5: Wind speed variation during monsoon (m/s)
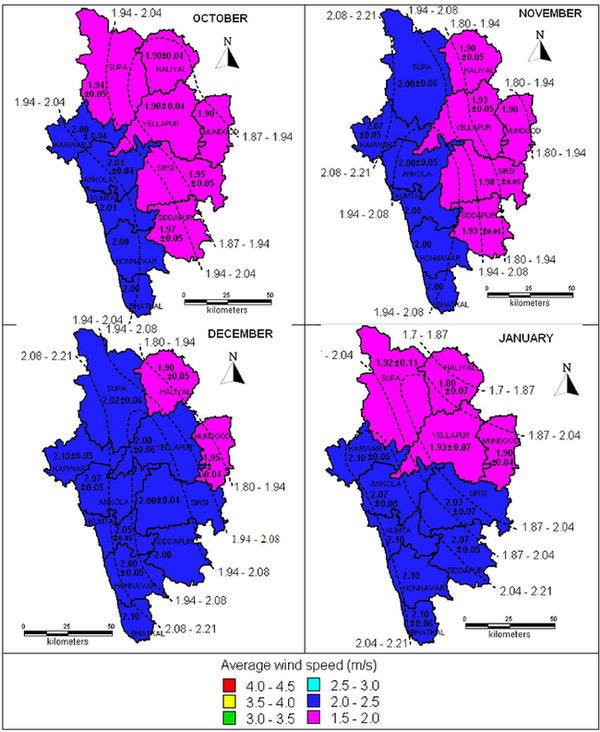
Figure 6: Wind speed variation during winter (m/s)
Wind Energy Conversion System (WECS): Wind Energy Conversion System (WECS) is used to extract energy from wind which in turn converted to mechanical and then electrical energy. Main components of WECS are blades, gears, turbine, generator and pillar to mount all the equipment at the required height. Wind potential assessment is a prominent pre installation procedure to assure perfect selection of site and to harness maximum energy. In order to explore the potential of wind technologies at an increased hub height, hourly surface wind speed measurements at IMD stations were estimated and represented in Figure 5. In almost all the taluk more than 45% of the wind speed is above 2.5 m/s except Honnavar (39.58%). Over 20% of the measured hours crossed 3.5 m/s wind speeds in Karwar, Kumta and Supa, in which Karwar being highest (27.38%). These findings along with relatively higher wind speeds (>2 m/s in high elevation zone) observed in seasonal wind profiles (based on CRU data) are indicative of the prospects of small and medium scale wind applications in Uttara Kannada which are technically achievable and economically viable [12]. Some of these are listed in Table 3.Wind pump for drawing water is an attractive small-scale wind technology for rural energy needs.The agriculture and horticulture intensive zones of Uttara Kannada could get benefited by wind pumps that function at low wind speeds.TheVertical Axis Wind Turbine (VAWT) that can function in wind speeds as low as 1 m/s could be more effective during low wind speed seasons in the region [13].Reduction in wind speeds and duration could be compensated by hybridizing wind with available alternative resources. Assessment of solar energy potential substantiates that it receives monthly average global insolation (incoming solar radiation) > 5 kWh/m2/day [7]. Hence wind–solar hybrid systems could be considered for endured energy supply in the region. Small-scale wind turbines could also be used in conjunction with biomass gasifies /diesel generators especially in remote areas, although diesel is not a clean option [14]. Battery charging based on wind systems supplements the energy requirements during reduced wind speeds.
Table 3: Available small-scale wind turbines [12]
| Rated power, Prated (kW) |
Rotor swept area (m2) |
Sub-category |
| Prated < 1 kW |
A < 4.9 m2 |
Pico wind |
| 1 kW < Prated< 7 kW |
A < 40 m2 |
Micro wind |
| 7 kW < Prated< 50 kW |
A < 200 m2 |
Mini wind |
| 50 kW < Prated< 100 kW |
A < 300 m2 |
(Not defined) |
Techno-economic Feasibility: Power harnessed by the WECS can be expressed using expression as given below;
 (3)
(3)
Where, P – Wind power ,  – Air mass density,
A – Swept area (area of wind flow), V – Wind velocity
and Cp – Beltz constant ( maximum = 59.3%) taken as 0.4
– Air mass density,
A – Swept area (area of wind flow), V – Wind velocity
and Cp – Beltz constant ( maximum = 59.3%) taken as 0.4

Figure 5: Percentage occurrence of wind speeds
Wind potential available in the district is estimated using equation 3 and given in Table 4.
Table 4: Wind power potential estimation
| Month |
Wind speed m/s |
Power harnessed at A= 30 m2 (kW) |
Power harnessed at A= 160 m2 (kW) |
| |
Min |
Max |
Min |
Max |
Min |
Max |
| January |
1.80 |
2.10 |
42.69 |
67.79 |
228.61 |
363.03 |
| February |
2.10 |
2.37 |
67.79 |
97.44 |
363.03 |
521.83 |
| March |
2.10 |
2.37 |
67.79 |
97.44 |
363.03 |
521.83 |
| April |
2.45 |
2.67 |
107.65 |
139.33 |
576.48 |
746.14 |
| May |
2.90 |
3.00 |
178.53 |
197.64 |
956.05 |
1058.40 |
| June |
3.50 |
3.88 |
313.85 |
427.57 |
1680.70 |
2289.71 |
| July |
3.60 |
3.93 |
341.52 |
444.31 |
1828.92 |
2379.38 |
| August |
3.20 |
3.50 |
239.86 |
313.85 |
1284.51 |
1680.70 |
| September |
2.40 |
2.50 |
101.19 |
114.38 |
541.90 |
612.50 |
| October |
1.90 |
2.01 |
50.21 |
59.44 |
268.87 |
318.33 |
| November |
1.90 |
2.07 |
50.21 |
64.93 |
268.87 |
347.69 |
| December |
1.90 |
2.10 |
50.21 |
67.79 |
268.87 |
363.03 |
| Total |
|
|
1611.49 |
2091.91 |
8629.85 |
11202.58 |
Estimation shows that Micro and Mini WEC systems are feasible for the district since minimum and maximum power can be harnessed ranges from 1611.49 kW to 2091.91 kW for the swept area of 30 m2 (micro model) and from 8629.82 kW to 11202.58 kW for swept area of 160 m2 (mini model).
Cost of the wind turbines depend on the size, since the transportation and installation difficulties increase with the size. Cost per kilowatt of typical wind turbine ranges from USD 1050 to 1350 in India [15]. As the capacity increases cost/kW decreases but the size of the turbine and blade length increases.Table 5 gives the cost estimation of WEC system.
Table 5: Cost estimation of WECS
Particulars |
Capacity of the turbine |
| 1.5 kW |
10 kW |
| Manufacturing cost |
1950 |
13000 |
| Battery bank |
237 |
1422 |
| Civil work and installation |
105 |
702 |
| Inverter |
79 |
527 |
| Maintenance charge & others |
263 |
1756 |
| Total cost |
2634 |
17407 |
| Annual energy generated (kWh) |
3500 |
30000 |
| Unit cost of electricity (USD/kWh) |
0.75 |
0.58 |
A typical 1 kW turbine can generate electrical energy of 1000- 3000 kWh per annum depending on the power density of wind [16]. About 70% of the total system cost is only for wind turbine followed by 9% for battery, 4% for civil work [17, 18]. Unit cost of electricity generated from WECS varies from USD 0.5 per kWh to USD 0.75 per kWh. However with the technology improvement and optimizing the system lower generation cost can be achieved.
5. CONCLUSION
Wind is one of the promising renewable sources which can substitute fast depleting fossil fuels sources. Wind energy potential in the district could meet the electrical energy consumption in domestic through decentralized generation and wind turbine driven pumps can decrease the dependency on grid supply for irrigation. District experiences annual average wind of 2.5 m/s to 3.0 m/s in all the taluks which opens wide range prospects for WECS installation. Hybridizing wind energy systems with other locally available resources would assure the reliable energy supply for domestic and irrigation demand. Small and medium scale WEC systems are feasible for the community level installation which leads to abundant amount of carbon dioxide emission reduction.
6. REFERENCES
-
Wilbur L.C., 1985. Handbook of Energy Systems Engineering - Production and Utilization. John Wiley & Sons, New York, 1985.
-
Global Wind Report Annual Market updates 2012. Retrieved on 25th June 2013. <http://www.gwec.net/?id=180>
-
Ramachandra T.V., Subramanian D.K. and Joshi N.V., 1997. Wind energy potential assessment in Uttara Kannada district of Karnataka, India. Renewable Energy, Vol. 10, No. 4, pp. 585-611, 1997
-
Balamurugan P., Ashok S. and Jose T. L. 2009. Optimal operation of Biomass/Wind/PV hybrid energy system for rural areas. International Journal of Green Energy, Vol. 6,pp. 104–116, 2009
-
Hester R.E., and Harrison R.M., 2003, Sustainability and environmental impact of renewable energy resource, Royal Society of Chemistry, United Kingdom <http://dx.doi.org/10.1039/9781847551986>, <http://dx.doi.org/10.1039/9781847551986-00105>
-
Uttara Kannada official website, Viewed on 27th June 2013. <http://uttarakannada.nic.in/districtprofile.htm >.
-
Ramachandra T.V. and GauthamKrishnadas, 2012. Prospects and Challenges of decentralized wind applications in the Himalayan Terrain. Journal of Energy Bioscience, Vol.3, No.1, pp. 1-12
-
New M., Lister D., Hulme M. and Makin I., 2002. A high-resolution data set of surface climate over global land areas. Climate Research, Vol. 21, pp. 1-25
-
Climate Research Unit, University of East Anglia, Viewed on 10th June 2013. <http://www.cru.uea.ac.uk/cru/data/hrg/tmc/>
-
World Meteorological Organization, Guide to Meteorological Instrument and Observing Practices, 4th Edition, WMO, No. 8, TP. 3 Geneva, Switzerland, 1964
-
Lysen H., 1983. Introduction to Wind Energy, 2nd Edition, Consultancy Services, Wind Energy, Developing Countries (CWD) 82-1, The Netherlands, 1983.
-
Cabello M. and Orza J.A.G., 2010. Wind speed analysis in the province of Alicante, Spain: Potential for small-scale wind turbines, Renewable and Sustainable Energy Reviews, Vol. 14(9), pp. 3185-3191, 2010.
-
Ayhan D. and Saglam S., 2012. A technical review of building-mounted wind power systems and a sample simulation model, Renewable and Sustainable Energy Reviews, Vol. 16(1), pp. 1040-1049, 2012.
-
Mathew S., Pandey K.P., and Anil Kumar V., 2002. Analysis of wind regimes for energy estimation, Renewable Energy, Vol. 25, pp. 381-399, 2002.
-
IRENA Working Paper, Renewable Energy Technologies: Cost Analysis Series. Vol. 1, Issue 5, 2012
-
Shandong Huaya Industry Co., Ltd. Viewed on 28th June 2013. <http://www.huayaturbine.com/te_product_a/2010-12-25/228.chtml>
-
Murat Gökçeka and Mustafa SerdarGenç, 2009. Evaluation of electricity generation and energy cost of wind energy conversion systems (WECSs) in Central Turkey, Applied Energy, Vol. 86, pp.2731-2739, 2009.
-
Ali NaciCelik, 2007. A Techno-Economic Analysis of Wind Energy in Southern Turkey, International Journal of Green Energy, Vol. 4, pp. 233-247, 2007
