Scope of Solar Energy in Uttara Kannada, Karnataka State, India: Roof top PV for domestic electricity and Standalone systems for irrigation
ABSTRACT
Energy is essential for economic and social development of a region. Dependence on fossil fuels has posed a serious threat due to greenhouse gas (GHG) emissions, dwindling stock of the fuel resource base. Among daily activities, about 80% of the mechanical work requires electrical energy. Dependence on the conventional energy resources for electricity generation is eroding the resources at faster rate. The process of electricity generation causes significant adverse effect on ecology by producing enormous quantity of byproducts including nuclear waste and carbon dioxide. Improving energy efficiency, switch over to renewable sources of energy and de-linking economic development from energy consumption (particularly of fossil fuels) is essential for sustainable development of a region. Green energy technologies have gained importance so that they are reliable and environmental friendly. Electrical energy harvesting from solar radiations is one such promising technology which uses photoelectric effect. Solar photovoltaic (SPV) modules directly convert solar radiations to direct current (DC) electrical power which can be used for various applications (or stored in battery) or can be sent to the existing grid. Uttara Kannada is located in the west coast of Karnataka, India, receives an average solar insolation of 5.42 kWh/m2/day annually and has more than 300 clear sunny days. This solar potential can be utilized to meet the domestic and irrigation electricity demand. Domestic demand of the household in rural region is about 50 to 100 kWh per month and that in urban region is less than 150 kWh/month in Uttara Kannada. The solar potential assessment reveals that, domestic demand can be supplied by installing rooftop SPV modules, since less the 5% of the rooftop is required in majority of the houses and irrigation demand can be met by installing PV modules in wasteland where less than 3% of available wasteland area is sufficient. To estimate the fraction of rooftop required to generate sufficient electricity, rooftop area of a household in selectedvillages (chosen randomly, representative of agro-climatic zones) is digitized using Google earth image (http://googleearth.com). Electricity demand in households is estimated based on the sample household survey of 1700 households, which indicate the requirement of 50-100 units (kWh) per month per household. Computed rooftop area per household is used to extrapolate for all the villages in the district. Rooftop area required to install the PV module to meet the respective household’s electricitydemand is computed.The roof area required is less than 5% to meet the domestic demand of the respective household using rooftop PV system.In the similar manner the area required to generate electrical energy to meet the irrigation demand in the village is determined. In most of the villages in the district, less than 0.5% of the available wasteland is sufficient to meet the irrigation demand.
KEY WORDS: Insolation, Solar Photovoltaic (SPV), Rooftop PV module, domestic demand, sustainable energy.
1. INTRODUCTION
Electricity is a very good energy carrier which can be converted to any other form of energy and hence the demand is increasing in a higher rate (Ramachandra, 2011a, P: 176). Generation of electricity in India is mainly dependent on fossil fuels (fossil fuels: 78%, Hydro: 22%) in which coal is the predominant source (54%) (Planning Commission, Government of India, 2011, P: 4).Dependency on fossil based energy sources is resulting in fast depletionof non-renewable energy sources, apart from the problem of pollution, GHG emission, land transformation, deforestation, etc.The utilization of land for constructing the power plants, transmission lines, substations and distributing stations is an important ecological issue and also construction of these conventional structures is a tedious process, which disturbs the region’s ecology, hydrology and biodiversity. This has necessitated an exploration for sustainable sources of electricity generation which are renewable, clean and cost effective (Environmental Health and Engineering, Inc., 2011, P: 10, TERI Energy Data Directory & Yearbook, TERI Press, New Delhi, 2011). Renewable sources currently contribute only 10% to the nation’s power basket where coal is the dominant source (56.81%). India ranks fifth in the world with 15,691.4 MW grid-connected and 367.9 MW off-grid renewable energy based power capacity. Solar energy is the promising renewablesource of energy which is widely available in the country. India receives an annual average insolation more than 5 kWh/m2/day and has over 300 clear sunny days in a year (Polo et al., 2010, P: 2395). India receives good solar radiations and yet utilization of solar energy is limited to 1% due to technological and economic barriers (World Institute of Sustainable Energy, Pune, 2011, P: 57). In this scenario, technologies like solar PV, rooftop solar, solar thermal systems are indeed helpful since these are decentralized, require no waste disposal area and consume very less water (Mitavachan and Srinivasan, 2012, P: 163). India receives abundant solar energy above 5 kWh/m2/day over 58% of its land area. Efficient solar conversion technologies have the capacity to augment the nation’s regional lighting, heating and motive electricity requirements. This can potentially avoid extension of electricity grid to remote places and hence minimise the need for further fossil fuel based centralised capacity addition. Promisingly, solar conversion technologies are being promoted for off-grid electricity generation through congenial policies in India (Ministry of New and Renewable Energy, GoI, 2011, P: 18).
Solar energy has a wide range of applications by converting it into thermal energy and electric energy. Parabolic trough system, central receiver system or parabolic dish system for solar-thermal energy conversion is used (Handbook of solar radiation, Allied Publishers, New Delhi, 1981) and photovoltaic cell (PV cell) is used for solar to electric energy conversion. Solar PV cell converts solar radiation into direct current (DC) electric power using photovoltaic effect (Ordonez et al., 2010, P: 2124). The domestic electricity demand in India can be met by installing solar PV modules in an outdoor area or using rooftop PV modules. Rooftop PV system generates direct current (DC) electrical power using photovoltaic effect. This power can be stored in a battery or used as per the requirement. It uses a part of roof area (depending upon the PV module size and output) for installing PV modules which acts as an energy source. The generated electricity is stored in batteries, used directly or it fed to the gridusing inverter circuit (Ramachandra and Subramanian, 1997a, P: 946). The National Solar Mission (NSM) launched in 2010, targets 200 MW off-grid solar based photovoltaic (PV) capacity by the end of its first phase in 2013. Ministry of New and Renewable Energy (MNRE), Govt. of India (GoI), has already achieved more than 38 MW by 2011 [http://www.mnre.gov.in/schemes/offgrid/solar-pv/]. In this study potential assessment is carried out for Uttara Kannada district considering the seasonal variations in the district. Digitization of rooftop area is done to estimate the roof area required to meet the domestic demand of the household using solar PV modules.
1.1 Need of solar potential assessment in Uttara Kannada
Stratified random sampling of household through the structured questionnaire has been carried out to assess the domestic energy requirement. Domestic monthly electricity consumption in Uttara Kannada district ranges from 50 to 100 kWh (per capita consumption is 15 to 20 kWh). Electrical energy utilization for domestic purpose (lighting, heating, etc.) tops the consumption followed by irrigation. Few small scale and medium scale industries are present in Taluk places (towns) which have the electricity consumption of 150-200 kWh per month (or lesser than 500 kWh/month) (AlamManzoor, SathayeJayant and Barnes Doug, 1998, P: 2).However the district is completely dependenton grid connected electricity supply which is not reliable and does not reach remote localities. Decentralized power supply system can meet the domestic and irrigation demand of the villages and also helpful in electrifying the remote consumers.Solar PV is a promising technology which can generate sufficient electricity to meet the household and irrigation demand (Ramachandra and KrishnadasGautham, 2011a, P: 85). Large scale deployment of solar based technologies entails solar potential assessment considering seasonal variability of solar radiation.
Abundant solar energy (5.42 kWh/m2/day) available in the region helps to meet the lighting and heating energy requirements (domestic consumption) through decentralized solutions such as rooftop solar PV systems. It directly converts solar energy into electrical energy using photoelectric effect which can feed the lighting and heating appliances of the household. Study of season wise variations in solar radiation is helpful in allocating the PV modules and forecasting the electricity generation.
2. OBJECTIVE
The main objectives of the study is to i) assess the scope for solar energy considering the seasonal variability of solar radiation in Uttara Kannada, ii) estimation of household electricity demand, iii) extent of roof top available for deploying solar panel to meet the electricity demand of the respective households, iv) extent of land requirement to meet the demand of irrigation pump sets using solar PV and v) techno-economic analysis of rooftop PV system.
3. MATERIAL AND METHODS
3.1 Study Area: Uttara Kannada with the spatial extent of 10,291 km2 is located at 74°9′-75°10′ E and 13°55′-15°31′ N in the mid-western part of Karnataka state, India(Figure 1). The regions with undulating hills, rising steeply from a narrow coastal strip bordering the Arabian Sea to a plateau at an altitude of 500 m, with occasional hills rising above 600 to 860 m lies in the central part of Western Ghats (Ramachandra and Subramanian, 1997a, P: 947). Figure 2 illustrates the topographic undulations of the region. Topographically, the district lies in three distinct zones namely narrow and flat coastal zone, abruptly rising ridge zone and elevated flatter eastern zone. The coastal zone is thickly populated with coconut clad villages. Ridge zone is a part of the main range of Western Ghats, which runs north to south, parallel to the coast. The flat eastern zone joins the Deccan plateau. The taluks, which comprises the narrow flat coastal zone, are: Karwar, Ankola, Kumta, Honnavar and Bhatkal. Similarly, taluks, which comprises the ridge zone, are: Supa, Haliyal, Yellapur, western Sirsi, and western Siddapur. Flatter eastern zone includesMundgod, eastern Sirsi and eastern Siddapur.Four agro-climatic zones based on geography and climate are coastal, evergreen, dry deciduous and moist deciduous. There are 1291 villages, 7 towns, 5 city municipal corporations/town municipal corporations/outward growth/census towns and 2 reservoirs in the district [http://uttarakannada.nic.in/].
4. DATA AND METHODS
The study includes assessment of energy at supply side and demand side and is detailed in Figure 3. The supply side includes assessment of regional solar energy availability, spatial extent of rooftop (individual households) and waste land (in the respective villages). The demand side includes estimation of domestic electricity consumption in households and irrigation as well as the extent of rooftop/land area required for installing PV based systems to meet the decentralised demand.
4.1 Assessment of solar energy potential: Village-wise solar energy availability in Uttara Kannada was assessed using satellite-based high resolution global insolation data derived on prudent models. Two datasets collectedwere:
-
Surface Meteorology and Solar Energy (SSE) 1°x1° (~100 X 100 km) spatial resolution global horizontal insolation (GHI) data provided by National Aeronautics and Space Administration (NASA) based on satellite measurements of 22 years (July 1983 to June 2005) (Surface Meteorology and Solar Energy Release 6.0 Methodology, NASA, 2012);
-
Higher spatial resolution 0.1° X 0.1° (~ 10 X 10 km) GHI data furnished by the National Renewable Energy Laboratory (NREL) based on satellite measurements of 7 years (January 2002 to December 2008) (NREL GHI data furnished by National Renewable energy Laboratory, 2010). These were compared and validated with long term surface GHI measurements based interpolation model for the region.Higher resolution NREL GHI data were used to study the seasonal availability and variability of village-wise solar energy in Uttara Kannada. Seasonal solar maps were generated using Geographic Information Systems (GIS) tools (Ramachandra, KrishnadasGautham and Jain Rishab, 2012a, P: 8).
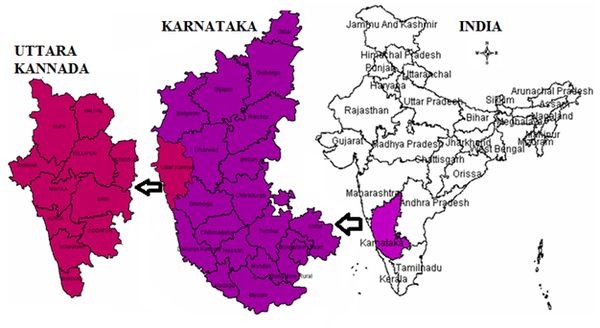
Figure 1: Location of Uttara Kannada
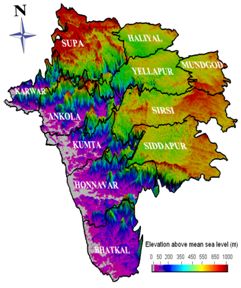
Figure 2: Digital Elevation Model of Uttara Kannada, Karnataka

4.2 Estimation of Builtup and Rooftop area (Digitization of rooftop area)
4.2.1 Estimation of Built-up area: Multispectral data acquired through IRS (Indian Remote Sensing) P6 satellite of 5.8 m resolution was used to estimate the extent of human habitations. Remote sensing data were analysed through standard protocols involving geometric correction, image classification through Gaussian maximum likelihood classifier.The remote sensing data obtained were geo-referenced, rectified and cropped pertaining to the study area. Geo-registration of remote sensing data (IRS P6) has been done using ground control points collected from the field using pre calibrated GPS (Global Positioning System) and also from known points (such as road intersections, etc.) collected from geo-referenced topographic maps published by the Survey of India (1:50000, 1:250000). Analysis of remote sensing data (Ramachandra, Aithal and Durgappa, 2012, P328-333) involved i) generation of False Colour Composite (FCC) of remote sensing data (bands – green, red and NIR). This helped in locating heterogeneous patches in the landscape ii) selection of training polygons (these correspond to heterogeneous patches in FCC) covering 15% of the study area and uniformly distributed over the entire study area, iii) loading these training polygons co-ordinates into pre-calibrated GPS, vi) collection of the corresponding attribute data (land use types) for these polygons from the field. GPS helped in locating respective training polygons in the field, iv) supplementing this information with Google Earth v) 60% of the training data has been used for classification, while the balance is used for validation or accuracy assessment.
Land use analysis was carried out through open source program GRASS - Geographic Resource Analysis Support System (http://grass.fbk.eu/) using supervised pattern classifier - Gaussian maximum likelihood algorithm using probability and cost functions (Ramachandra, Aithal and Durgappa, 2012, P328-333). Accuracy assessment to evaluate the performance of classifiers, was done with the help of field data by testing the statistical significance of a difference, computation of kappa coefficients and proportion of correctly allocated cases. Statistical assessment of classifier performance based on the performance of spectral classification considering reference pixels is done which include computation of kappa (κ) statistics and overall (producer's and user's) accuracies. Application of maximum likelihood classification method resulted in accuracy of 88%. Remote sensing data analysis provided i) area under vegetation (forests, grass lands.), ii) built up (buildings, roads or any paved surface, iii) water bodies (lakes/tanks, rivers, reservoirs), iv) others (open area such as play grounds, quarry regions, etc.).
4.2.2 Estimation of the spatial extent of rooftops: Regional rooftop area availability for harvesting solar energy was calculated using remote sensing data through geo-informatics and statistical tools. Villages representing different agro-climatic zones of Uttara Kannada were randomly chosen and rooftop areas were mapped by manual digitisation of high resolution Google Earth satellite data (http://googleearth.com)with the support of geo-informatics tools (Ordonez et al., 2010, P: 2124, Ramachandra, 2007, P: 108). Roof types in towns and other urban areas were similar in most of the zones, one random sample was manually digitised for estimating the spatial extent of rooftops. The built-up areas for randomly sampled regions and manually digitized total rooftop areas were investigated using statistical tools.Total rooftop areas were extrapolated for other regions based on two different methods:
- Method 1– Census based: Ratio of total rooftop area to number of households (census) in sampled regions provided average rooftop area per household
 for respective agro-climatic zones i. These ratios were used to derive total rooftop areas
  in other regions based on number of households
  from the census, as shown in equation 1.
  value for towns were taken as same in all agro-climatic zones.
 (1)
(1)
where,
Ri is the total rooftop area of households in ith agro-climatic zone in m2
Hi is the number of households in ith agro-climatic zone
- Method 2–based on Land Use Land Cover (LULC): Signature separation corresponding to LU (Land Use) classes is done using Transformed Divergence (TD) matrix and Bhattacharya distance. Accuracy assessment is done using error matrix in order to get most precise results (Ramachandra, Joshi and Kumar Uttam, 2012, P: 3). Ratios of total rooftop areas to built-up areas in sampled regions were averaged
 over different agroclimatic zones i. Ratios with large deviations were removed due to possibility of misclassification. The average ratio values for respective zones were used to derive total rooftop areas
  in other villages, as shown in equation 2.
 (2)
(2)
where,
Biis the total-built up area in ith agro-climatic zone
-
Regional domestic electricity demand: Talukwise electricity consumption data were collected from the respective government agencies. Apart from this, stratified random sampling of 1,700 households representing all agro-climatic zones yielded energy requirement per household. Based on this data, monthly electricity usage (in kWh) for household for purposes like lighting, heating etc, and irrigation pump sets were computed (Ramachandra, Joshi, et al., 2000, P: 825).
-
PV requirement to meet regional electricity demand: Electricity generation from PV was calculated based on the equation 3. The theoretical energy output from a PV cell,
 (3)
(3)
where G is the Global Horizontal Insolation (kWh/m2), A is the area of the PV panel, P is the rated power output, Istc is the insolation at standard test conditions and η is the efficiency.
Actual energy output considering the quality factor,
 (4)
(4)
whereQ isthe quality factor of a PV module. Hence wattage of PV to be installed is found by
 (5)
(5)
Area required to meet the demand is,
 (6)
(6)
The built-up areas for randomly sampled villages and manually digitized roof-top areas were compared using parametric tests (paired t-test) (Sampling Techniques, C.E.C.S.A., 1975). Ratio of total rooftop area to number of households (census) in sampled villages provided rooftop area per household for respective agro climatic zones. These ratios were used to derive rooftop areas in other villages based on number of households. Percentage share of manually digitized rooftop area in the total classified built-up area for sampled town was estimated. This factor was used for all other town panchayats and municipalities to estimate rooftop areas available. Computed rooftop area is assumed to be available for installing solar energy applications like photovoltaic panels, water heaters, etc. to meet the lighting and water heating requirement of respective houses.
Figure 4 depicts the digitized rooftops in Lakolli village of MundgodTaluk in Uttara Kannada. The polygons of exposed (available) rooftops in a village are manually digitised using Google Earth. Rooftops in 30 random regions (including one town) spread across four agro-climatic zones of Uttara Kannada were similarly digitised. Rooftop area per household  was calculated for the sampled villages and averaged over each agro-climatic zone respectively. These are given in Table 1 and details of villages/towns in Appendix I.
5. RESULTS AND DISCUSSION
5.1 Solar energy potential (Seasonal variations of solar insolation) assessment in Uttara Kannada: The monthly average GHI (Global Horizontal Irradiance) datasets from NASA and NREL were compared and validated with surface data based model. Figure 5 illustrates the monthly variability of solar radiation. The values indicate that adequate solar energy is available in the region. Higher resolution NREL GHI data were used to study the solar energy potential in Uttara Kannada. Solar maps generated for monsoon, winter and summer seasons, show seasonal availability and regional variability of GHI (Figure 6). The seasonal average GHI is highest in summer (6.65 – 6.95 kWh/m2/day), moderate in winter (5.70 – 5.85 kWh/m2/day) and lowest in monsoon (4.50 – 5.20 kWh/m2/day). Annual average GHI values were considered for assessing the technical potential of solar energy in Uttara Kannada.
Figure 6illustrates the seasonal variations of solar insolation in Uttara Kannada. Solar insolation ranges from 4.5 to 6.95 kWh/m2/day in the districts throughout the year. During Monsoon season, district gets the insolation ranges from 4.5 to 5.2 kWh/m2/day. Coastal and the eastern part of the central (moist deciduous) region receives insolation of 4.8-5 kWh/m2/day. The central region (Evergreen) gets the lowest insolation ranges from 4.5 to 4.8 kWh/m2/day during monsoon. Eastern most part (dry deciduous) receives higher insolation of 4.89-5.2 kWh/m2/day.
In winter, insolation in the district ranges from 5.70 to 5.85 kWh/m2/day. Most of the parts in the district receive insolation of 5.80-5.85 kWh/m2/day. Eastern region of the district (dry deciduous) gets insolation ranges from 5.75 to 5.80 kWh/m2/day. Some parts in this region receive insolation of 5.70-5.75 kWh/m2/day also.
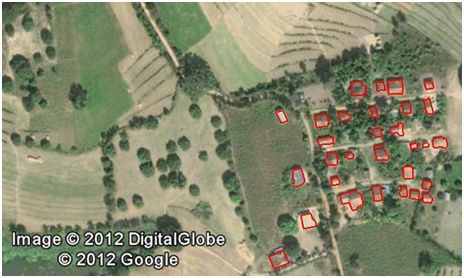
Figure 4: Rooftop digitisation in Lakolli village of Mundgod taluk, Uttara Kannada
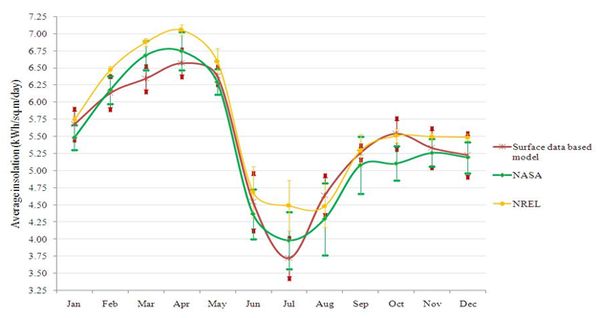
Figure 5: Comparison of different available solar data for Uttara Kannada
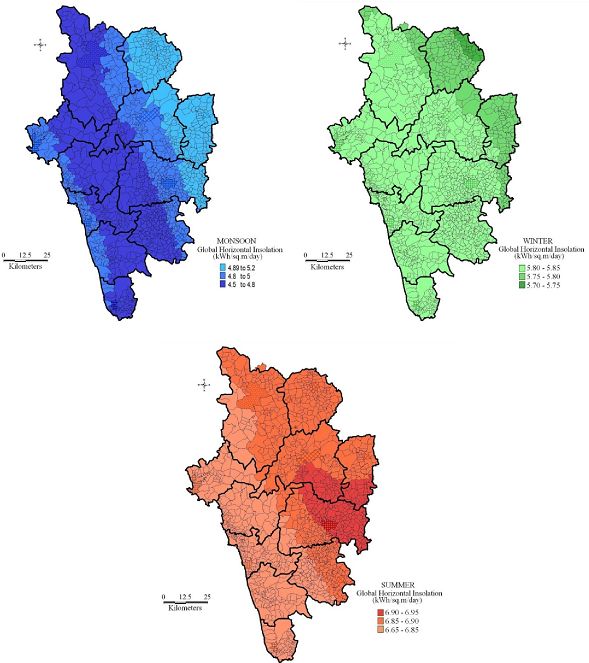
Figure 6: Seasonal variations of solar radiation in Uttara Kannada
Uttara Kannada gets higher insolation ranges from 6.65 to 6.95 kWh/m2/day in summer. Western part of the district receives insolation of 6.65-6.85 kWh/m2/day. Most of the eastern part (central) gets insolation of 6.85-6.90 KWh/m2/day. In summer, some parts of the district get higher insolation of 6.90-6.95 kWh/m2/day.
Uttara Kannada has a good solar potential and can meet the energy demand in the domestic sector. Energy harvesting through PV based solar system mounted on rooftops of individual houses would help in meeting the respective house’s energy demand while bringing down the dependency on the State’s grid.
5.2 Land use Dynamics in Uttara Kannada: Figure 7 shows the land use details of a sampled village in Uttara Kannada. Classification of all sampled villages provided built-upand waste land areas. Based on the rooftop areas already calculated, rooftop to built-up ratio  was derived for sampled villages and averaged over eachagro-climatic zones respectively (Table 1).
Table 1: Average values of R/H and R/B ratios for different agro-climatic zones
| Agro-climatic zone |
R/H |
R/B |
| Coastal |
72 |
0.4 |
| Dry deciduous |
141 |
0.5 |
| Evergreen |
139 |
1.6 |
| Moist deciduous |
82 |
0.5 |
Based on methods 1 and 2 (data and methods section, equations 1 and 2), the averaged R/H and R/B values were used to derive total rooftop areas in allregions and represented in Figures 8 and 9 respectively. It is observed that Method 1 provides a lower estimate of region-wise rooftop area compared to Method 2.
From Figure 8 (Method 1: Extrapolation) it is seen that in most of the villages, total roof area available is less than 10,000 m2 or it is about 10,000 to 25,000 m2. There are very few villages where the total roof area is more than 50,000 m2. By the knowledge of total number of households in the particular village available rooftop area of each house can be determined.
Figure 9 (Method 2: land use) gives the total roof top area available in the villages of Uttara Kannada. It shows that total rooftop area available is more than 1,00,000 m2 in most of the villages. There is significant number of villages where the total roof area of the village is less than 10,000 m2. In some of the villages total roof area available ranges between 50,000 to 1,00,000 m2. Method 2 is based on the signature values of the land use (LU) over estimate the total roof area due to the approximation and lower pixel resolution. However both the results are comparable in the present case and the error is less.
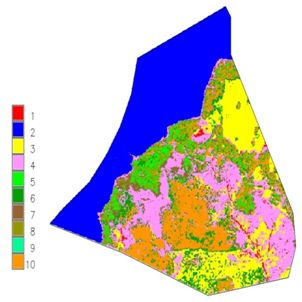
Figure 7: Land use in Aghanashini village of Kumtataluk, Uttara Kannada

Figure 8: Region wise rooftop area available based on Method 1
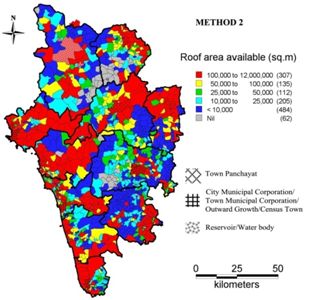
Figure 9: Regionwise rooftop area available based on Method 2

Figure 10: Domestic household electricity consumption
5.3 Domestic electricity consumption: Table 2 summarises taluk-wise monthly average domestic electricity consumption based on the data compiled from the government agencies and from sampled households. Average monthly energy consumption of electricity for domestic purposes is about 34±8 kWh per month per household and irrigation requirement is about 3218±2412 kWh/hectare/year. Monthly domestic electricity consumption ranges from 23 (for Haliyal) to 44 (Honnavar) kWh. These values were used for calculating the regionwise electricity demand for domestic and irrigation. Coastal taluks (Ankola, Kumta, Karwar, Bhatkal and Honnavar) have higher household electricity consumption. Siddapur and Sirsitalukswith vast extent of horticulture crops lead in the per hectare consumption of electricity for irrigation. Figure 10 gives the monthly average household electricity consumption and Figure 11 shows the annual average electricity consumption for pump irrigation. A large part of Uttara Kannada except the coast is rainfed and hence do not rely on irrigation for agriculture.The electricity consumption ranges from 1,000 - 5,000 kWh/month. There are about 80 villages, which have the domestic consumption of 10,000 to 1,00,000 KWh of electricity in a month.
Table 2: Domestic electricity consumption
| Taluk |
Household consumption (kWh/month) |
Agricultural consumption (kWh/ha/year) |
| Ankola |
34 |
2900 |
| Kumta |
42 |
3200 |
| Karwar |
40 |
3100 |
| Bhatkal |
40 |
3100 |
| Honnavar |
44 |
1800 |
| Haliyal |
23 |
1800 |
| Mundgod |
37 |
2100 |
| Siddapur |
26 |
7700 |
| Sirsi |
34 |
7900 |
| Yellapur |
25 |
900 |
| Supa |
25 |
900 |
| max |
44 |
7900 |
| min |
23 |
900 |
| average |
34 |
3218 |
| std. |
8 |
2412 |
5.4 Scope for rooftop PV systems to meet domestic electricity demand: The monthly average electric energy consumption per household is about 50 to 100 kWhin Uttara Kannada. This electricity demand can be met through solar rooftop PV system, which ensures continuous supply of electricity compared to the current system of depending on grid with uncertainties. The rooftop area required to generate the electric energy using PV which will meet the domestic electricity demandin respective villages is given in Figure 12. Majority of the villages require rooftop area less than 250 m2 to meet the electric energy demand using solar PV system. Around 26% (350) of the villages in the district require rooftop area less than 100 m2 and about 27% (363) places need rooftop area ranges from 100 to 250 m2. Hence more than 54% of the villagesrequire rooftop area less than 250 m2 to meet the current domestic electricity demand. In very few places total rooftop area required is 10,000 to 1,00,000 m2 which are normally the city or town municipal corporations or census towns.
Rooftop area requirementfor PV modules was computed and mapped (Figure 12) with the knowledge of region-wise household electricity demandconsidering the solar PV panels of efficiency (η) 14%with modules ofquality factor (Q) 0.5as discussed in Methods section. In most of the regions, except for towns, less than 10,000 m2 of rooftop area was sufficient to meet the village’s household electricity demand. Figure 13 shows the PV capacity required to meet their demand. Most of the villages required installations within 1,000 kW while towns demanded larger installations upto 14,000 kW per region. Figures 14 and 15 provide information on the share of available rooftop area required to meet household electricity demand, based on methods 1 and 2 respectively.
Figure 14 (Method 1: Extrapolation) gives the share of (% of) available roof area required to meet the domestic electricity demand of household using rooftop PV system. In almost all the villages in the central part (Evergreen region) of the districts, only 1-2% of the available roof area is required to meet the electric energy demand of the household using rooftop PV system. In few villages in coastal region (HonnavarTaluk), 5-7% of the available rooftop area is needed to meet the present household electricity demand. In all other villages, roof area required is less than 5% (or 2-5%) of the total area to meet the demand using solar rooftop PV system. Hence study reveals that, a small part (less than 7%) of the roof area is sufficient to meet the electrical energy demand of the household using rooftop PV system in the district.
As mentioned before, availability of rooftop area according to method 1 was a lower estimation. Based on this method, less than 7% of the available rooftop area in any region can meet its household electricity requirement using PV. As expected, due to the higher estimation of available rooftop area by method 2, less than 5% can meet this demand using PV in most of the regions. In certain regions where the built-up areas were not classified (due to dense tree canopy, covering the rooftops) and hence rooftop areas were not available according to method 2, it is shown as “roof not sufficient” to meet the demand (Figure 15).
Figure 15 (Method 2: LULC-Land Use and Land Cover) gives the percentage of roof area required to meet the domestic electricity demand using PV. It also shows that in most of the villages, the roof area required to meet the electricity demand of the household using rooftop PV is less than 1%. In some places area required ranges from 1-5 and in few places it is 50-100%. But overall the roof area required is less than 5% to meet the domestic demand of the household using rooftop PV system.
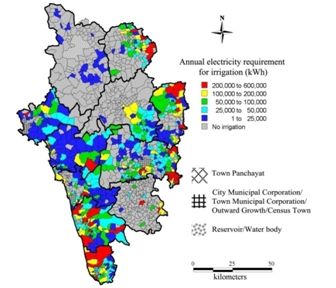
Figure 11: Electricity requirement for pump irrigation
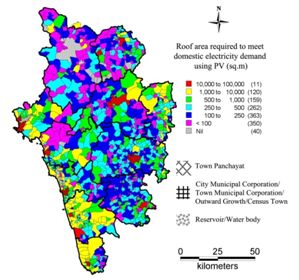
Figure 12: Region-wise rooftop area required to meet household electricity demand using PV (η=14%, Quality factor=0.5)
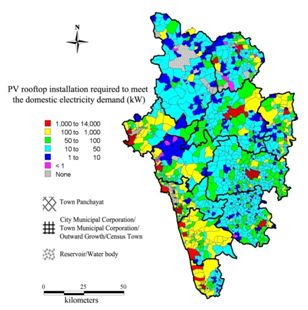
Figure 13: Region-wise PV rooftop installation required to meet the household electricity demand
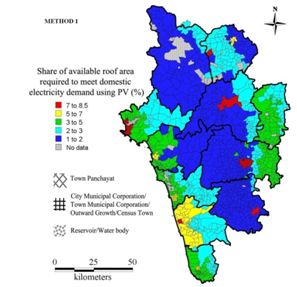
Figure 14: Share of rooftop area required to meet household electricity demand
5.5 Meeting the electricity demand of irrigation using Solar PV in waste/open land
Village-wise land uses were estimated using IRS (Indian remote Sensing) P6 data of 5.6 m spatial resolution. This analysis provided the details of the extent of wasteland in each village of the district. The proportion of wasteland required to meet electricity demand for irrigation was calculated as discussed earlier (Method section). Figure 16 shows the waste land required to meet the annual electrical energy demand for irrigation considering SPV Standalone panels of efficiency (η) 14% and quality factor (Q) 0.5. Most part of the district is practices rain-fed cultivation without much irrigation. Villages in the coastal zone can meet the irrigation demand with less than 0.5% of the available waste land area. In most of the villages’ total electrical energy required for irrigation ranges from 1 to 25,000 kWh per annum. In some places energy requirement is more than 25,000 kWh and less than 50,000 kWh annually. There are few places where the total electrical energy required for irrigation is more than 1,00,000 kWh per annum. The land requirement analysis shows that the electricity demand for irrigation purpose can be met using less than 0.5% of wasteland area in the district. In few places waste/open land area required is more than 0.5% of the totalwaste/open land area available. However, in Uttara Kannada waste/open land area required will be less than 10% to meet the electricity demand of irrigation by installing PV modules.
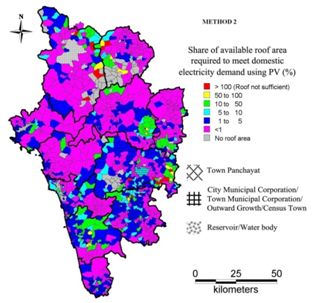
Figure 15: Share of rooftop area required to meet household electricity demand based on method 2
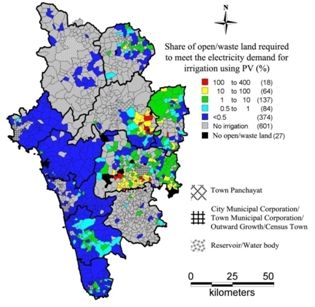
Figure 16: Share of waste land area required to meet electricity demand for irrigation using PV
6. TECHNO-ECONOMIC ANALYSIS OF ROOFTOP PV SYSTEM
Electrical energy at household levels is mainly used for end uses such as lighting, heating and pumping of water. The household electricity demand is currently being met by the grid connected system which has its own limitations (RaghavanShubha. V, et. al., 2011, P: 3180). Many households in the state depend on battery-inverter or diesel generator as a backup system which increases the household expenditure. Also, over 400 million people do not have access to electricity (13 villages in Karnataka) in the country. Hence the decentralized rooftop solar PV systems at individual household level could be the technically feasible solution as it can meet the demand of the household and meeting the increasing demands of rural (remote area) electrification (Ramachandra, KrishnadasGautham and Jain Rishab, 2012a, P: 3179).
Monthly average electricity consumption of a household in Karnataka (Uttara Kannada district) ranges from 50 kWh to 100 kWh. The average roof area of an urban household is about 1,200 square feet (120 m2) and that of rural household is 2,000 to 2,500 square feet (200-250 m2). The portion of this rooftop is sufficient to harvest electrical energy using solar photovoltaic (SPV) system. Table 3 gives the area of PV cell required to generate electric energy at varied efficiencies (like 4, 8, 12 and 16%). Rooftop SPV is a standalone or an off grid system and hence donot face any uncertainty such as grid interventions and hence it would be more reliable. The system uses a part of rooftop area for installing PV modules which will be less than 5% of the total roof area. Though the initial cost of such systems is high, it has a payback period of 5 to 7 years and has a life span of more than 20 years (Jain Abhishek, 2012, <http://www.bijlibachao.in/Solar/roof-top-solar-pv-system-project-for-home-and-office.html>).
Table 3: Rooftop area (m2) requiredfor installing SPV1
| PV module efficiency (%) |
PV capacity (Watts) |
100 |
250 |
500 |
1000 |
2000 |
4000 |
10000 |
| 4 |
Rooftop area required
(m2) for SPV |
30 |
75 |
150 |
300 |
600 |
1200 |
2400 |
| 8 |
15 |
38 |
75 |
150 |
300 |
600 |
1500 |
| 12 |
10 |
25 |
50 |
100 |
200 |
400 |
1000 |
| 16 |
8 |
20 |
40 |
80 |
160 |
320 |
800 |
1 Ministry of New and Renewable Energy (GoI)
For example, to generate 1,000 watts of electricity from 12% of efficiency, 100 m2 roof area is required. But this does not give the output for 24 hours a day and all throughout the year. The electricity generated (kWh) from the PV system depends on the panel efficiency and the availability of solar insolation in a location. The factor that defines this output is called CUF (Capacity Utility Factor). For India, it is typically taken as 19% and the energy generated is:
Energy Generated Annually (in kWh) = System Size in KW * CUF * 365 * 24 (7)
A typical 1 kW capacity solar system will generate 1,600-1,700 kWh of electricity per year. (It may vary according to the location and PV technology used.) This means electrical energy generated per month from rooftop PV system ranges from 130 to 140 kWh (consumption in household is 50-100 kWh). Roof area required for 1KW output PV system ranges from 300 m2 (η=4%) to 80 m2 (η=16%) (Installing and Maintaining a Home Solar Electric System, 2012, <http://energy.gov/energysaver/articles/installing-and-maintaining-home-solar-electric-system>).
Roof area required to meet the monthly demand of a household is estimated for different PV technologies is given in Table 4considering the average solar insolation of 5 kWh/m2/day. Area calculated is the actual area of PV module to be installed to meet the demand on rooftop.
Table 4: Fraction of rooftop area required for various PV cell technologies
| Household with available rooftop area of 100 m2 |
| Monthly demand |
Type of PV module and η |
|
Crystalline-Si
η=15-20% |
Amorphous-Si
η=5-7% |
Cadmium-Telluride,
η=8-11% |
CIGS/CIS
η=8-11% |
|
| 30 |
1.33 |
4.00 |
2.50 |
2.50 |
% rooftop
required |
| 50 |
2.22 |
6.67 |
4.17 |
4.17 |
| 100 |
4.44 |
13.33 |
8.33 |
8.33 |
| 200 |
8.89 |
26.67 |
16.67 |
16.67 |
6.1 Economic Analysis: Table 5 gives the total installation cost of a typical rooftop PV system with the generation cost and payback period.Solar PV module of 1 kWp with overall system efficiency of 10% is considered for the calculations (LacchiniCorrado, João Carlos and Santos Dos, 2011, P: 183). The costs estimated include all the system components such as battery,wiring and mounting equipment (does not include inverter and backup unit).
Table 5: Unit cost and payback period for SPV system1,2
| PV module type |
Capacity |
Cost (Rs/Wp) |
Total installation cost |
Unit cost
Rs/KWh |
Payback period |
| Crystalline-Silicon PV modules with conversion efficiency of 14-20% |
1 KWp
Amount of roof space required for the installation of 1 KWp PV module ranges from 8-12 m2 |
180
The cost of installed plant capacity of rooftop SPV is about 18 crores/MW |
1,80,000
Total cost of 1 KWp system |
15-19
(Without any discount) |
Generally 5-7 years.
(Less than 10 years) |
1Alan Goodrich, Ted James and Michael Woodhouse, 2011. Residential, Commercial, and Utility-Scale Photovoltaic (PV) System Prices in the United States: Current Drivers and Cost-Reduction Opportunities. Technical report by NREL, NREL/TP-6A20-53347, February 2012
2Alice Solar City 2011. Rooftop solar photovoltaic (PV) system, part of the Australian Government’s Solar Cities Initiative
Photovoltaic cells directly convert solar radiations into electric power due to the process called photo electric effect. When sun light falls on the surface of PV cell, free electrons are emitted from the cell which flows through the external circuit and delivers the power. The output power is unidirectional or DC power. Normally rated output power is measured in peak Watt (Wp) in standard test condition (STC) which is the product of short circuit current (Isc) and open circuit voltage (Vsc). The actual output of the panel may vary according to the location and insolation over the year (seasonal variation). The mean DC output power in Indian climatic conditions ranges from 1,600 to 1,700 kWh per year per kWp (Vardimon Ran, 2011, P: 592).
The other important aspect which affects the output of the panes is the efficiency which is calculated by measuring the net output of the PV of unit square metre area. The efficiency varies for different materials depending on purity of the silicon and manufacturing technology. For crystalline Silicon, efficiency ranges from 12 to 16% and maximum efficiency achieved is more than 40%. Amorphous silicon, Cadmium Telluride (CdTe) and CIGS (Copper indium gallium selenide) solar cells have lower efficiency of 5-7%, 8-11% and 8-11% respectively (International Finance Corporation (IFC), A Member of World Bank Group, 2011).Cost of the rooftop PV solar system varies from 1.5 to 1.8 lakhs per KWp installed capacity. Cost may also depend on the other parameters like efficiency, capacity, type of PV cell technology, type of mounting and the geography. Table 6 gives the cost comparison of different power plant on installed capacity basis.
Table 6: Installed plant capacity cost comparison1,2,3 (Cost/MW)
| Type of Power Plant |
Cost (Rs/MW) in crores |
| Coal based (Thermal power plant) |
4.5 |
| Hydroelectric |
5.5 |
| Nuclear |
13 |
| Wind |
4 – 5 |
| Solar PV (Grid connected) |
20 |
| Solar PV (Rooftop) |
1.5 – 1.8 lakhs/KWp |
1Nuclear Fissionary, < http://nuclearfissionary.com/2010/04/02/comparing-energy-costs-of-nuclear-coal-gas-wind-and-solar/>
2http://aglasem.com/resources/reports/pdf/SOLAR%20VS%20NUCLEAR%20VS%20WIND%20ENERGY.pdf,
3http://openaccesslibrary.org/images/HAR224_Adesh_Sharma.pdf,
The installation cost of solar PV and rooftop PV are comparable to other technologies and has a payback period of 5 to 7 years. Moreover solar PV system has very less maintenance cost and minimal issues of waste disposal. Also, rooftop solar PV uses the roof space with no landuse restrictions (LacchiniCorrado, João Carlos and Santos Dos, 2011, P: 185).
Thermal power plants are the base load plants (coal or gas based) which supply the larger loads of the country. These plants are centralized plants normally located close to raw material (coal) available places or near to load centres. Such plants may not be installed as decentralized plants for a community or household level. Nuclear and hydroelectric plants are also centralized plants, installed capacity ranges from few hundreds of MW to several thousands. Due to the waste disposal and recitation constraints nuclear power plants are located far away from load centres and cannot be installed in decentralized manner for community level. Hydroelectric plants are the biggest plants which need large area for dam construction to provide suitable head. But small hydroelectric plants (less than 50 MW) can be constructed to supply a small load centres (community level). Compared to these, solar PV and wind turbine (or hybrid) generation plants can be used as both centralized as well as decentralized to supply community and household level demand. An off grid system may be lower capacity (few hundreds of watts to few KW) which is capable to meet the demand of household or a community demand. Rooftop solar PV systems are the latest development which can meet the household demand and also can supply to the grid. Building-integrated photovoltaic (BIPV) is the upcoming technology in which PV panels are integrated with building materials. (Ramachandra and DabrasePramod. S, 2000, P: 15).
6.2 Comparative analysis of Generation cost (Cost per MWh) of different power plants: Generation cost includes the cost of installation of plant (capital cost), operation and maintenance cost (O&M), cost of the raw materials and other expenses. This cost also includes the life time valuation of a plant to the present value. Table 7 gives the generating cost comparison of different power plants (2010) based on the average of 14 countries including three non OECD countries (International Energy Agency (IEA) Nuclear Energy Agency (NEA), Organization for Economic Co-operation and Development, 2010).
Table 7: Generation cost comparison of different power plants
| Type of Power Plant |
Rs/MWh (at 5% Discount rate) |
Rs/MWh (at 10% Discount rate) |
| Nuclear |
2440.8 |
4217.24 |
| Coal |
3400.2 |
4643.17 |
| Gas |
3877.65 |
4339.85 |
| Hydro – Small hydro |
4743 |
8501.27 |
| Large hydro |
4557.15 |
8841.65 |
| Wind – Onshore |
4887 |
8346.17 |
| Offshore |
6276.15 |
8999.03 |
| Geothermal |
4438.35 |
7244.28 |
| Solar – PV |
12600.45 |
19058.99 |
| PV (rooftop)1 |
15854 |
23273.48 |
| Solar thermal2 |
9503.1 |
14809.73 |
1 Solar PV (rooftop) system in Germany,
2 Solar thermal system in United States
7. ENVIRONMENTAL ASPECTS
On an average, generation of 1,000 KWh of electricity from solar radiations reduces emissions by about 83.6 kg of sulfur dioxide, 2.25 kg of nitrogen oxides and about 635 kg of carbon dioxide. During its 20 years of clean energy production solar rooftop system can reduce tons of poisonous gas emissions to the climate (The National Renewable Energy Laboratory PV FAQs for: U.S. Department of Energy Office of Energy Efficiency and Renewable Energy, 2004).
8. CONCLUSION
Solar energy is the most reliable and widely available renewable energy resource for decentralized applications through thermal and electricity conversion. Domestic applications such as thermal conversion, photovoltaic conversion, solar lighting, cooking etc. are influenced by the reception of solar radiation. Solar insolation varies with geography and season, requiring assessment at local levels. Geographic information system (GIS) based insolation data is used for assessing the potential and design of the system where the variations are in acceptable limit and comparison with ground measurements have given better accuracy. Energy potential is computed based on the digitizedroof area data from select villages representing all agro-climatic zones in the region with insolation details. With the knowledge of insolation reception and rooftop digitization considering high spatial resolution remote sensing data (Google earth), available potential is extrapolated to the required region of study. Solar PV installation on roof top could be effective in generating electricity from solar sources to meet the domestic energy demand.
Uttara Kannada district has more than 2,70,000 households, which has the electricity consumption of 50 to 100 kWh per month (per household). In meeting this household domestic demand rooftop solar PV systems could play an important role since district has very good solar potential. The fraction of open/wastelands in the district can be utilized to meet the electricity demand of irrigation pump sets using solar PV system. Since the whole country (in turn states and districts) is becoming an energy deficit place, need of further installation of conventional power plants can be scaled down by using decentralized or standalone unconventional methods such as rooftop PV system. Government is also encouraging the solar energy utilization by projects such as JNNSM: Jawaharlal Nehru National Solar Mission, planned to have 20,000 MW of solar energy based power plants in India. Rooftop PV system can contribute significantly to JNNSM and adequately cutting down harmful greenhouse gases and hence reduction in carbon footprint.
9. REFERENCES
- ‘Handbook of solar radiation’, Allied Publishers, New Delhi, 1981
- ‘Sampling Techniques’, C.E.C.S.A., 1975.
- ‘TERI Energy Data Directory & Yearbook’, TERI Press, New Delhi, 2010
- AlamManzoor, SathayeJayant and Barnes Doug, ‘Urban household energy use in India: efficiency and policy implications’. 1998. <http://ies.lbl.gov/iespubs/43942.pdf>
- Alice Solar City, ‘Rooftop solar photovoltaic (PV) system, part of the Australian Government’s Solar Cities Initiative’, 2011
- ChaureyAkanksha and Kandpal Tara Chandra, ‘Assessment and evaluation of PV based decentralized rural electrification: An overview’, Renewable and Sustainable Energy Reviews, vol. 14, Issue 8, 2010.
- Environmental Health and Engineering, Inc., 2011. Accessed on 2nd February 2013. <http://www.eheinc.com/exp_risk_airqual.htm >
- H. Mitavachan and J. Srinivasan, ‘Is land really a constraint for the utilization of solar energy in India?’ Current Science, vol. 103, Issue 2, 2012
- Installing and Maintaining a Home Solar Electric System, Viewed on October 25, 2012. <http://energy.gov/energysaver/articles/installing-and-maintaining-home-solar-electric-system>.
- International Energy Agency (IEA), Nuclear Energy Agency (NEA), Organization for Economic Co-operation and Development, ‘Projected Costs of Generating Electricity’, 2010 Edition.
- International Finance Corporation, World Bank Group, ‘Utility Scale Solar Power Plants, A Guide for developers and investors’, 2012.
- International Finance Corporation (IFC), A Member of World Bank Group, ‘A Guide for Developers and Investors’, 2011.
- J. Ordonez et al., ‘Analysis of the photovoltaic solar energy capacity of residential rooftop in Andalusia (Spain)’, Renewable and Sustainable Energy Reviews vol. 14, Issue 7, 2010
- J. Polo et al. ‘Solar radiation estimations over India using Meteosat satellite images’, Solar Energy vol. 85, Issue 9, 2011.
- Jain Abhishek, ‘Roof-Top solar PV system for home and office, Viewed on November 5, 2012. <http://www.bijlibachao.in/Solar/roof-top-solar-pv-system-project-for-home-and-office.html>.
- LacchiniCorrado, João Carlos V. and Santos Dos, ‘Photovoltaic energy generation in Brazil – Cost analysis using coal-fired power plants as comparison’, 2011.
- M. Santosh, Harish and RaghavanShuba V., ‘Redesigning the National Solar Mission for Rural India’, Economic & Political Weekly (EPW), vol. 46 Issue 23, 2011
- Ministry of New and Renewable Energy, GoI, ‘Annual Report 2010-11’, 2011, <mnre.gov.in/file-manager/.../strategic_plan_mnre_2011_17.pdf>
- National Renewable Energy Laboratory technical report on ‘Residential, Commercial, and Utility-Scale Photovoltaic (PV) System Prices in the United States: Current Drivers and Cost-Reduction Opportunities’, 2012
- NREL GHI data furnished by National Renewable energy Laboratory, 2010.
- Nuclear Fissionary, Accessed on 5th January 2013. <http://nuclearfissionary.com/2010/04/02/comparing-energy-costs-of-nuclear-coal-gas-wind-and-solar/>
- Planning Commission, Government of India, ‘Annual Report 2011-12 0n the working of state power utilities and electricity departments’, 2011. <planningcommission.nic.in/reports/genrep/ar_eng1112.pdf>
- Surface Meteorology and Solar Energy Release 6.0 Methodology, NASA, 2012. Viewed on 25th November 2012. <http://eosweb.larc.nasa.gov/sse/ documents/SSE6Methodology.pdf>
- T. V. Ramachandra, KrishnadasGautham and Jain Rishab, ‘Solar Potential in the Himalayan Landscape’, International Scholarly Research Network, ISRN Renewable Energy, vol. 2012, 2012.
- T. V. Ramachandra, Jain Rishabh and KrishnadasGautham, ‘Hotspots of solar potential in India’, Renewable and Sustainable Energy Reviews, vol. 15, Issue 6, 2011.
- T. V. Ramachandra ‘Renewable energy transition: Perspective and Challenges, In: Energy India 2020 - A Shape of Things to come in Indian Energy Sector’, Saket Projects Ltd., Ahmadabad, 2011.
- T.V. Ramachandra and D. K. Subramanian, ‘Potential and Prospects of Solar Energy in Uttara Kannada, District of Karnataka State, India’, Energy Sources, vol. 19, Issue 9, 1997
- T.V. Ramachandra and KrishnadasGautham, ‘Decentralized renewable energy options for Himalayan states in India, 7th National Conference on Indian energy sector "SYNERGY WITH ENERGY", November 18-19, AMA Ahmadabad, 2011.
- T.V. Ramachandra, AithalBharath and DurgappaSanna,. Insights to Urban Dynamics through Landscape Spatial Pattern Analysis.,International Journal of Applied Earth Observation and Geoinformation, Vol. 18, Pp. 329-343. 2012
- Vardimon Ran, ‘Assessment of the potential for distributed photovoltaic electricity production in Israel’, Renewable Energy, vol. 36 Issue 2, 2011.
- World Institute of Sustainable Energy, Pune, ‘Annual Report 2010-11’, 2011. <http://www.wisein.org/pdf/WISE_Annual_Report_2010_11.pdf >
APPENDIX I:
Sampled regions
| Zone |
Taluk |
Region (Village/town) |
Pop |
H |
Pop/H |
R (m2) |
R/H (sq.m) |
R/pop (m2) |
B (m2) |
R/B |
| Coastal |
Bhatkal |
Golibilur |
506 |
74 |
7 |
4712 |
64 |
9 |
15174 |
0.31 |
|
Bhatkal |
Karikal |
880 |
165 |
5 |
10040 |
61 |
11 |
23249 |
0.43 |
|
Honnavar |
Madageri |
590 |
121 |
5 |
11460 |
95 |
19 |
15399 |
0.74 |
|
Karwar |
Hosali |
610 |
152 |
4 |
10770 |
71 |
18 |
98246 |
0.11 |
|
Kumta |
Lukkeri |
1791 |
280 |
6 |
19420 |
69 |
11 |
74672 |
0.26 |
|
|
Average |
|
|
|
|
72 |
|
|
0.37 |
| Dry deciduous |
Mundgod |
Lakolli |
590 |
116 |
5 |
12740 |
110 |
22 |
21896 |
0.58 |
|
Haliyal |
Chibbalgeri |
748 |
126 |
6 |
21150 |
168 |
28 |
27470 |
0.77 |
|
Haliyal |
Bidroli |
725 |
137 |
5 |
20080 |
147 |
28 |
97171 |
0.21 |
|
|
Average |
|
|
|
|
141 |
|
|
0.52 |
| Evergreen |
Honnavar |
Hosgod |
229 |
40 |
6 |
6475 |
162 |
28 |
4525 |
1.43 |
|
Honnavar |
Dabbod |
392 |
79 |
5 |
9629 |
122 |
25 |
15824 |
0.61 |
|
Ankola |
Brahmur |
594 |
114 |
5 |
13330 |
117 |
22 |
4625 |
2.88 |
|
Ankola |
Karebail |
191 |
42 |
5 |
3848 |
92 |
20 |
1425 |
2.70 |
|
Karwar |
Shirve |
374 |
75 |
5 |
10730 |
143 |
29 |
5175 |
2.07 |
|
Sirsi |
Somanalli |
198 |
37 |
5 |
9147 |
247 |
46 |
1400 |
|
|
Sirsi |
Dhoranagiri |
302 |
62 |
5 |
13010 |
210 |
43 |
1075 |
|
|
Sirsi |
Onigadde |
348 |
63 |
6 |
10050 |
160 |
29 |
6825 |
1.47 |
|
Supa |
Vatala |
245 |
45 |
5 |
6337 |
141 |
26 |
1200 |
|
|
Supa |
Nandigadde |
387 |
107 |
4 |
8912 |
83 |
23 |
5790 |
1.54 |
|
Supa |
Boregali |
193 |
35 |
6 |
5590 |
160 |
29 |
750 |
|
|
Supa |
Viral |
91 |
16 |
6 |
2199 |
137 |
24 |
625 |
|
|
Supa |
Kunagini |
95 |
20 |
5 |
2398 |
120 |
25 |
250 |
|
|
Supa |
Godashet |
358 |
73 |
5 |
6270 |
86 |
18 |
5675 |
1.10 |
|
Siddapur |
Halehalla |
195 |
37 |
5 |
4612 |
125 |
24 |
100 |
|
|
Siddapur |
Golikai |
332 |
67 |
5 |
9032 |
135 |
27 |
1225 |
|
|
Yellapur |
Kelashi |
245 |
52 |
5 |
8522 |
164 |
35 |
37099 |
0.23 |
|
Yellapur |
Beegar |
231 |
42 |
6 |
4432 |
106 |
19 |
2475 |
1.79 |
|
|
Average |
|
|
|
|
139 |
|
|
1.58 |
| Moist deciduous |
Mundgod |
Chalgeri |
455 |
83 |
5 |
6617 |
80 |
15 |
42473 |
0.16 |
|
Haliyal |
Dandeli |
53290 |
11121 |
5 |
894200 |
80 |
17 |
2176694 |
0.41 |
|
Sirsi |
Sahasralli |
207 |
40 |
5 |
3671 |
92 |
18 |
22099 |
0.17 |
|
Supa |
Kondapa |
281 |
69 |
4 |
5212 |
76 |
19 |
4900 |
1.06 |
|
|
Average |
|
|
|
|
82 |
|
|
0.45 |
