Wetlands constitute vital components of the regional hydrological cycle, highly productive, support exceptionally large biological diversity and provide a wide range of ecosystem services, such as food and fibre; waste assimilation; water purification; flood mitigation; erosion control; groundwater recharge; microclimate regulation; enhance aesthetics of the landscape; support many significant recreational, social and cultural activities, besides being a part of our cultural heritage. It was acknowledged that most of urban wetlands are seriouslythreatened by conversion to non-wetland purposes, encroachment of drainage, through landfill, pollution (discharge of domestic and industrial effluents, disposal of solid wastes), hydrological alterations (water withdrawal and inflow changes), and over-exploitation of their natural resources resulting in loss of biodiversity and disruption in goods and services provided by wetlands (Ramachandra, 2002; 2009a,b; Ramachandra et al., 2012a,b). This report addresses the implications of setting up SEZ in an ecologically fragile wetlands. Also, provides insights to the strategies considering the current trends in aquatic ecosystem conservation, restoration and management including the hydrological and the biophysical aspects, peoples’ participation and the role of non-governmental, educational and governmental organisations’ needs for the restoration, conservation and management.
Urbanisation is a form of metropolitan growth that is a response to often bewildering sets of economic, social, and political forces and to the physical geography of an area. It is the increase in the population of cities in proportion to the region's rural population. The 20th century is witnessing "the rapid urbanisation of the world’s population", as the global proportion of urban population rose dramatically from 13% (220 million) in 1900, to 29% (732 million) in 1950, to 49% (3.2 billion) in 2005 and is projected to rise to 60% (4.9 billion) by 2030. Urban ecosystems are the consequence of the intrinsic nature of humans as social beings to live together (Ramachandra et al., 2012a; 2012b; Ramachandra and Kumar, 2008). The process of urbanisation contributed by infrastructure initiatives, consequent population growth and migration results in the growth of villages into towns, towns into cities and cities into metros. Urbanisation and urban sprawl have posed serious challenges to the decision makers in the city planning and management process involving plethora of issues like infrastructure development, traffic congestion, and basic amenities (electricity, water, and sanitation), etc. (Ramachandra and Shwetmala, 2009; Ramachandra, 2009c). Land use analyses show 584% growth in built-up area during the last four decades with the decline of vegetation by 66% and water bodies by 74%. Analyses of the temporal data reveals an increase in urban built up area of 342.83% (during 1973 to 1992), 129.56% (during 1992 to 1999), 106.7% (1999 to 2002), 114.51% (2002 to 2006) and 126.19% from 2006 to 2010 (Ramachandra et al., 2012a). The major implications of unplanned urbanisation are:
- Loss of wetlands and green spaces: Urbanisation has telling influences on the natural resources such as decline in green spaces (vegetation) including wetlands and / or depleting groundwater table (Ramachandra, 2002).
- Floods: Common consequences of urban development are increased peak discharge and frequency of floods as land is converted from fields or woodlands to roads and parking lots, it loses its ability to absorb rainfall. Conversion of water bodies to residential layouts has compounded the problem by removing the interconnectivities in an undulating terrain. Encroachment of natural drains, alteration of topography involving the construction of high rise buildings, removal of vegetative cover, reclamation of wetlands are the prime reasons for frequent flooding even during normal rainfall post 2000 (Ramachandra et al., 2012a).
- Decline in groundwater table: Studies reveal the removal of water bodies has led to the decline in water table. Water table has declined to 300 m from 28 m over a period of 20 years after the reclamation of lake with its catchment for commercial activities. Also, groundwater table in intensely urbanized area such as Whitefield, etc. has now dropped to 400 to 500m (Ramachandra et al., 2002).
- Heat island: Surface and atmospheric temperatures are increased by anthropogenic heat discharge due to energy consumption, increased land surface coverage by artificial materials having high heat capacities and conductivities, and the associated decreases in vegetation and water pervious surfaces, which reduce surface temperature through evapotranspiration (Ramachandra and Kumar 2009).
- Increased carbon footprint: Due to the adoption of inappropriate building architecture, the consumption of electricity has increased in certain corporation wards drastically. The building design conducive to tropical climate would have reduced the dependence on electricity. Higher energy consumption, enhanced pollution levels due to the increase of private vehicles, traffic bottlenecks have contributed to carbon emissions significantly. Apart from these, mismanagement of solid and liquid wastes has aggravated the situation (Ramachandra and Shwetmala, 2009; Ramachandra et al., 2012a; 2012b).
Bangalore Lakes and Bellandur
Greater Bangalore is the administrative, cultural, commercial, industrial, and knowledge capital of the state of Karnataka, India with an area of 741 sq. km. and lies between the latitude 12°39’00’’ to 13°13’00’’ N and longitude 77°22’00’’ to 77°52’00’’ E (Figure 1). Bangalore city administrative jurisdiction was redefined in the year 2006 by merging the existing area of Bangalore city spatial limits with 8 neighbouring Urban Local Bodies (ULBs) and 111 Villages of Bangalore Urban District. Bangalore has grown spatially more than ten times since 1949 (~69 square kilometres to 716 square kilometres) and is the fifth largest metropolis in India currently with a population of about 9 million (Ramachandra and Kumar, 2008; Ramachandra et al., 2012a; 2012b). Bangalore city population has increased enormously from 65,37,124 (in 2001) to 95,88,910 (in 2011), accounting for 46.68 % growth in a decade. Population density has increased from as 10732 (in 2001) to 13392 (in 2011) persons per sq. km. The per capita GDP of Bangalore is about $2066, which is considerably low with limited expansion to balance both environmental and economic needs.
Bangalore once a garden city,became garbage city and now in the verge of becoming a dead city due to consistent mismanagement of natural resources. The transition from garden city to dead city has taken place because of the unplanned rapid urbanisation involving concentrated growth. Bangalore witnessed the software industry boon during early 2000. Due to this, there is drastic increase in population with the enhanced demand for water and electricity. Apart from this, lack of infrastructure is evident from traffic bottlenecks, etc.
About 80% of water supplied as demand turns as liquid waste either as domestic waste water or industrial waste water that contain high amounts of toxic, organic, inorganic wastes. Most of the sewage and wastewater generated is discharged directly into storm water drains that ultimately link to water bodies. The undulating terrain in the region facilitated the creation of a large number of tanks in the past, providing for the traditional uses of irrigation, drinking, fishing and washing. This led to Bangalore having hundreds of such water bodies through the centuries. In 1961, the number of lakes and tanks in the city stood at 262. A large number of water bodies (locally called lakes or tanks) in the City had ameliorated the local climate, and maintained a good water balance in the neighborhood. Since Bangalore is located on a ridge with natural water courses along the three directions of the Vrishabhavaty, Koramangala-Challaghatta (K&C) and Hebbal-Nagavara valley systems (Figure 2), these water courses are today being used for the transport and disposal of the city’s sewage. The shortfall or lack of sewage treatment facilities have contaminated the majority of surface and ground waters.
The KoramangalaChalaghatta valley (Figure 2, Figure 3), tributary of Periayar River, located towards the south east of Greater Bangalore. The following are lakes along the valley: Varthur, Bellandur, Agaram, Puttenahalli, Chalaghatta, Madivala, Sarakki, Hhulimavu, Lalbhag, Bayappanahalli, Vibuthipura, Kundalhalli, Ibburu, Ulsoor, Beguru, etc.
Bellandur Lake located in the south-eastern portion of Greater Bangalore is towards the upstream of Varthurlake, the drainage network for Bellandur lake has 3 drainage network:
- In the north originating at Jayamahal covering eastern portion of the City;
- Drains originating from the central part near K R Market covering the central portion of the City;
- Originating from the southern part of the city near Hulimavu.
Bellandur lake has a history over 130 years, post 1980’s the drainage chains feeding the lakes were broken due to unchecked industrial, residential as well as commercial development in the region, the lands near the lake were allotted for development of ring road post 1990 during which there was industrial development
The Bellandur catchment extends from 12050’N to 1301’47”N in latitude and 77033’14” E to 77041’1”E in longitude with an area of 171.17 km2. . The Bellandur Lake itself encompasses an area of 338.29 hectares. Bellandur lake catchment and its drainage network are represented in figure 3. The false colour satellite composite of Bellandurcatchment (Figure 4) highlight the heterogeneity of the landscape. The digital elevation model (figure 4) depicts the undulating terrain with interconnected water bodies. The terrain altitude gradually varies from City center (North western part of catchment) 962m to 850m above MSL at the lake. Population in the catchment given in Table 1 show an increase from 1425105 (1991) to 3410383 (2011)
The population density (figure 5) in the Bellandur catchment has shown a sharp increase from 100 persons per hectare (2001) to over 141.96 (2011) and 750 persons per hectare (in 2011) in certain wards, mainly due to migration.
Table 1: Population of all the wards under Bellandur catchment
Year |
Population |
Population density
(persons / ha) |
1991 |
1425105 |
59.32 |
2001 |
2417744 |
100.63 |
2011 |
3410383 |
141.96 |
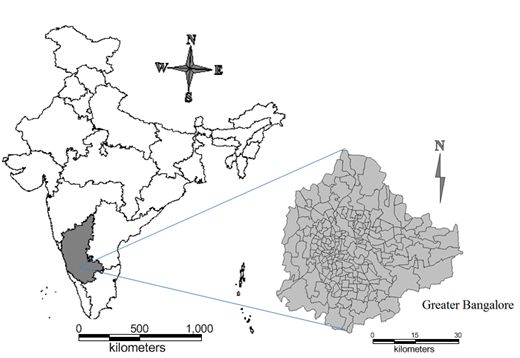
Figure 1: Greater Bangalore
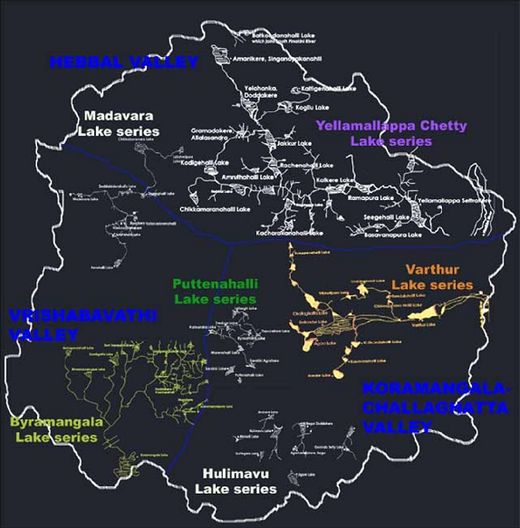
Figure 2: Lake Series in Bangalore
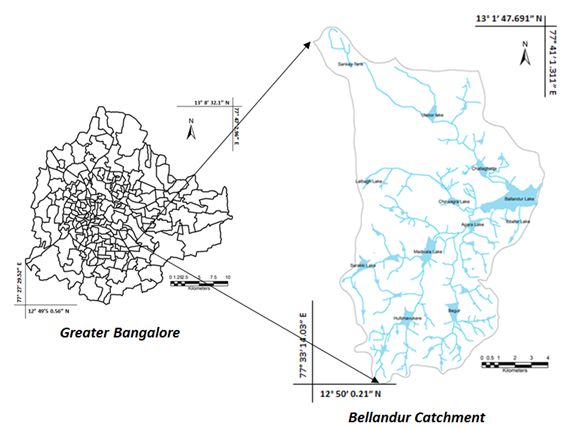
Figure 3: Bellandur Drainage Network
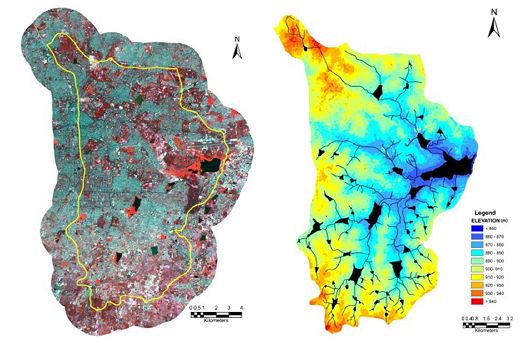
Figure 4: FCC and DEM
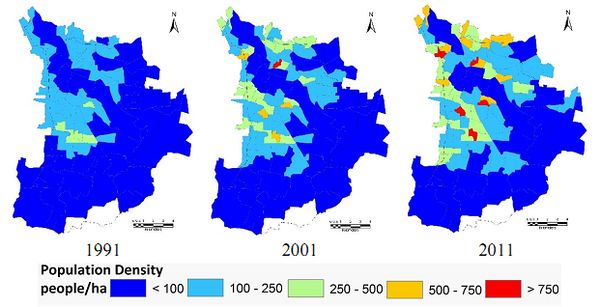
Figure 5: Population Density
