Results
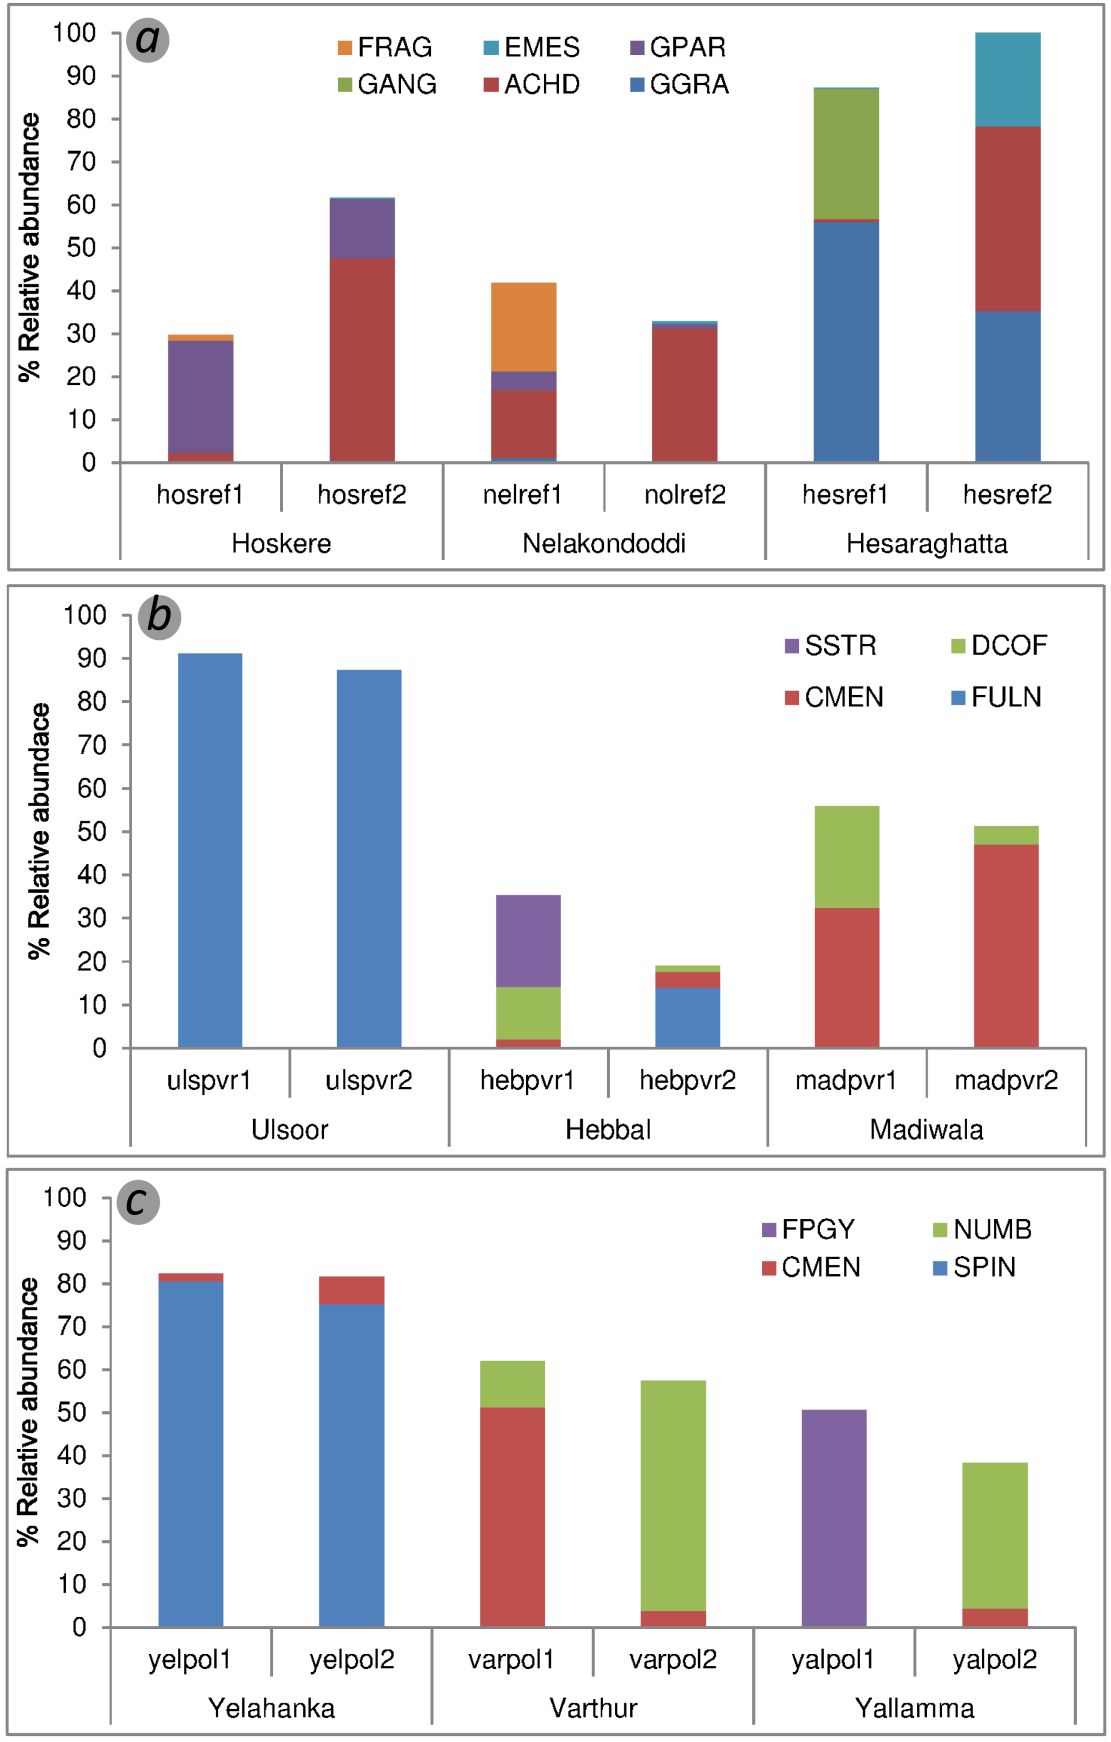
A total of 115 species belonging to 41 genera has been recorded from the investigated wetlands. The species occurring at ≥10% relative abundances (RA) in at least one sample has been considered for further analyses and plotted in figure 2 and 3. The dominant taxa at reference (Clean) wetland were Achnanthidium Kützing, Encyonema mesianum Cholnoky, Gomphonema gracile Ehrenberg, Gomphonema angustatum (Kützing) Rabenhorst and Fragilaria sp., whereas polluted wetland was characterized by abundance of Cyclotella meneghiniana Kützing, Nitzschia umbonata (Ehrenberg) Lange-Bertalot, Nitzschia palea (Kützing) Smith, Fallacia pygmea (Kützing) Stickle & Mannand Staurosirella pinnata Ehrenberg. Previously restored wetlands have been included in this study for a comparison analyses of species distribution in clean, polluted and recently restored wetlands (Figure 2a-2c). Previously restored wetlands continued to inhabit dominant taxa like Fragilaria ulna var. acus (Kützing) Lange-Bertalot, Cyclotella meneghiniana, Diadesmis confervaceae Kützing and Seminavis strigosa Hustedt. Species level identification of genus Achnanthidium is incomplete due to complexity and its wide range of occurrence. Two Gomphonema sp. could not be identified to species level necessitating further taxonomic assistance. Fragilaria ulna var. acus was found to be abundant (≥90% RA) at previously restored wetland (Ulsoor wetland) while analyses of Hebbal wetland recorded the dominance of F. ulna var. acus, G. parvulum and Bacillaria paradoxa Gmelin that showed less similar assemblage pattern from the rest of the wetland types.
Figure 2: Diatom distribution in different wetlands (a.) reference wetlands, (b.) polluted wetlands and (c.) previously restored wetlands. (See Table 1 for wetland sampling site codes).
Prior- and Post-Restoration Diatom Assemblages
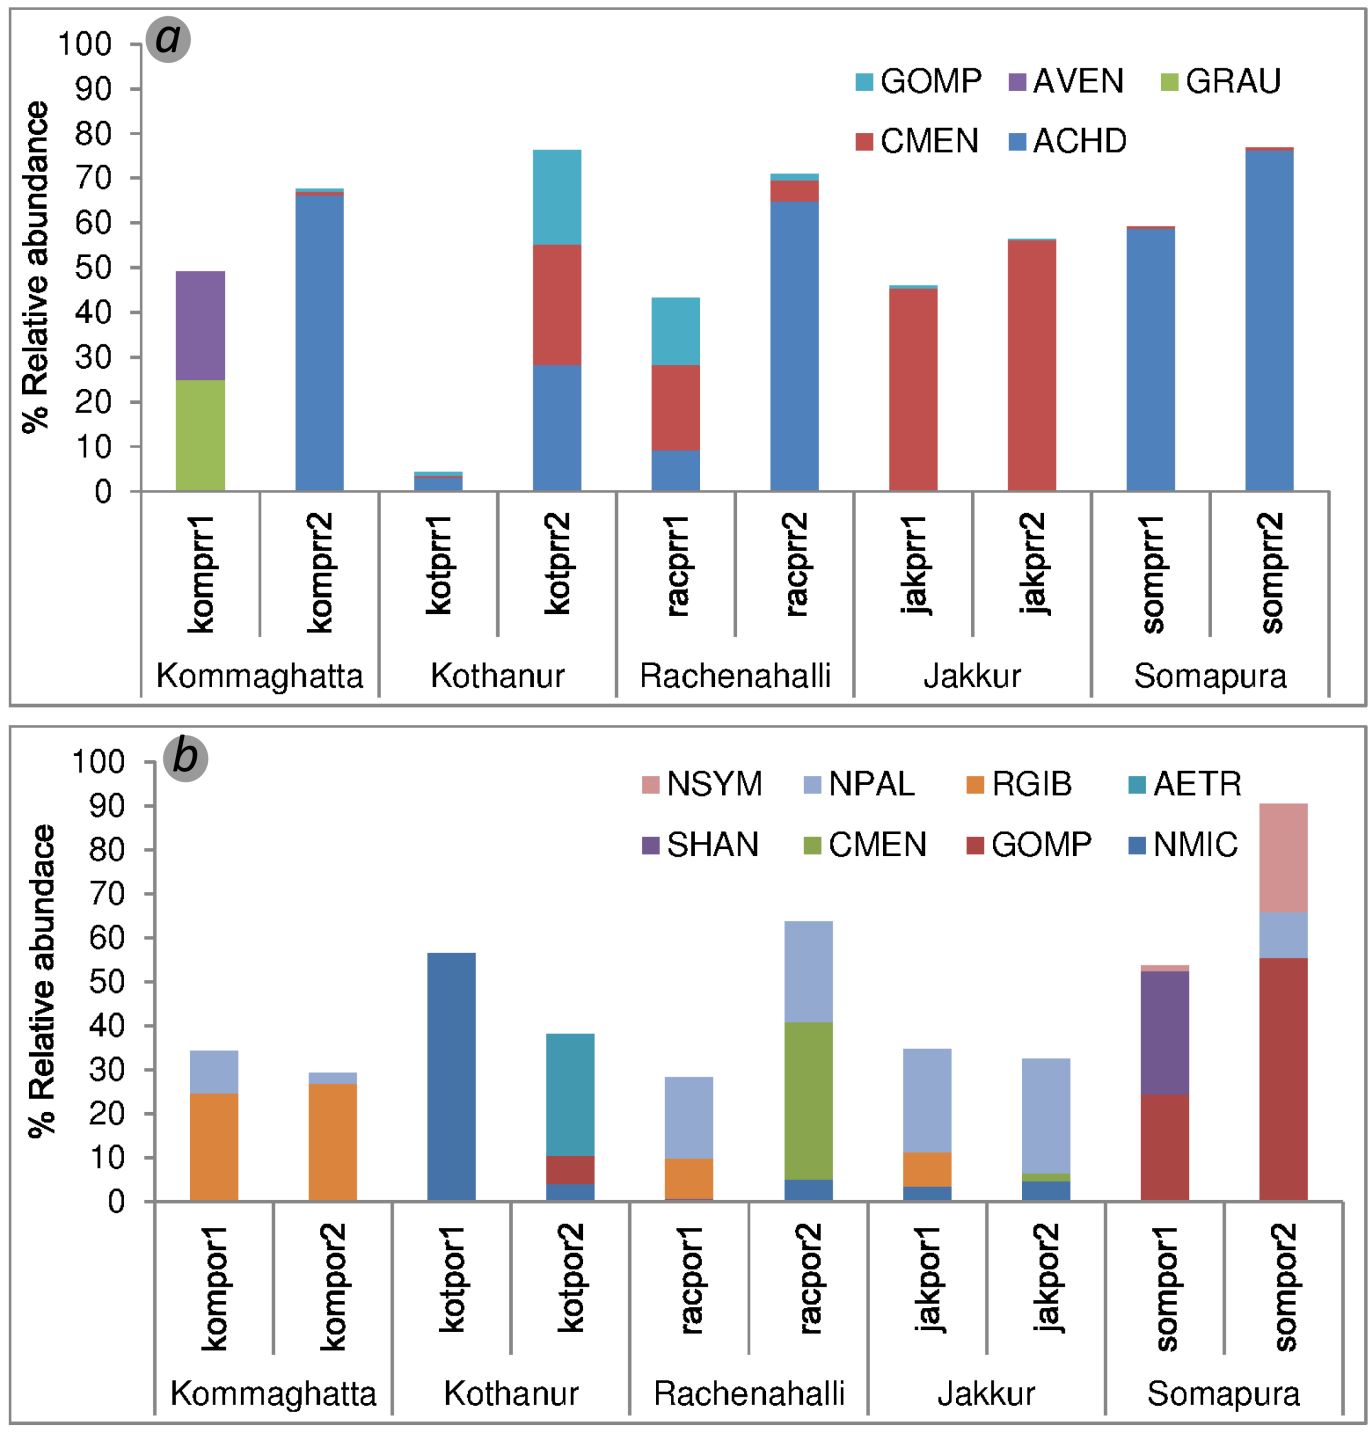
Distribution of dominant species across wetlands during prior to restoration is given in Figure 3a. Forty diatom genera comprising of 101 species were identified from 15 sampling sites (3 sites in each wetland). The most common and abundant species were Achnanthidium Kützing, Cyclotella meneghiniana, Diadesmis confervaceae, Gomphonema parvulum, Gomphonema sp.1, Gyrosigma accuminatum (Kützing) Rabenhorst, Nitzschia amphibia Grunow, Nitzschia palea (Kützing) W. Smith, Halamphora veneta Kützing, Gyrosigma rautenbachiae Cholnoky and Cymbella kappi (Cholnoky) Cholnoky. Distribution of dominant species across wetlands during post restoration period is given in Figure 3b. A total of 71 taxa from 32 genera had been recorded (15 sampling sites with 3 in each wetland). Dominance of species like Rophalodia gibba (Ehrenberg) O. Muller, Nitzschia palea, Gomphonema parvulum, Achnanthidium eutrophilum Lange-Bertalot, Caloneis bacillum (Grunow) Cleve, Encyonopsis microcephala (Grunow) Krammer, Gomphonema affine Kützing, Navicula symmetrica Patrick and Tryblionella apiculata Gregory were observed. Gomphonema sp.1 which was identified as new taxa was found to be absent in post restoration in Somapura wetland.
Figure 3 : Comparison of diatom distribution in (a.) prior-restoration and (b.) post- restoration wetlands (See Table 1 for wetland sampling site codes and Appendix 1 for diatom codes)
Comparison among wetland types
The pattern in the number of taxa, % eutrophic taxa, Shannon diversity (H') and dominance (D) within studied wetlands are listed in Table 1. Highest number of taxa was recorded at reference sites (Hoskere and Nelakondoddi wetlands) and post-restoration sites of Jakkur. Percentage eutrophic taxa explained the trophic status at polluted wetlands (92.055 ±1.68%) followed by previously restored wetlands (74.9±27.9%). Even though taxa were equally high at post-restoration (POR) (no. of taxa =17.8±3.59) and prior restoration (PRR) (no. of taxa =16.5±5.55), eutrophic taxa dominated in the former group. This might be due to the removal of macrophytes and disturbance of sediments during de-silting restoration process. Lowest species diversity was observed in polluted wetland type (H'=0.74-1.52) and previously restored sites (H'=0.38-1.8), while highest species diversity were observed at reference sites of Nelakondoddi (H'=2.2) followed by post restoration wetlands at Kommaghatta sites (H'=2.5). Fragilaria ulna var. acus were dominant in previously restored wetlands (D=0.84) and Nitzschia palea were dominant at polluted wetland (D=0.69) types, however the lowest dominance was observed at reference (D=0.24) and post-restoration (D=0.182) sites showing more evenly distributed taxa. Physical and chemical analyses of different wetland groups are given in detail in Table 2. Results provided a comparison between wetland types with similar pattern of pollution status among polluted and previously restored wetlands. Most of Bangalore’s wetlands showed neutral to alkaline pH range (7.04-9.43). Electric conductivity (EC) represented higher values at polluted, prior restoration and previously restored sites, which were exceeding Bureau of Indian Standards (BIS) for Inland/Surface waters’ limits of surface waters. While wetland like Kothanur (average=1039µScm-1) showed persistent higher values even after restoration.
Table 1 : List of wetlands studied in respective groups (in Bold) and their number of taxa, % Eutrophic taxa, Shannon diversity index and dominance.
| Wetland names | Number of taxa | % Eutrophic species | Shannon diversity H' | Dominance D |
| Reference wetlands | ||||
| Hoskere | 18.5 | 20.7 | 2.1 | 0.20 |
| Nelakondoddi | 17.5 | 6.2 | 2.2 | 0.15 |
| Hesaraghatta | 7.5 | 0.79 | 1.16 | 0.37 |
| Previously restored wetlands | ||||
| Ulsoor | 2.5 | 100 | 0.38 | 0.8 |
| Hebbal | 15.5 | 44.8 | 2.28 | 0.13 |
| Madiwala | 12 | 79.9 | 1.8 | 0.23 |
| Polluted wetlands | ||||
| Yelahanka | 7 | 90.5 | 0.75 | 0.65 |
| Varthur | 5.5 | 91.7 | 1.28 | 0.37 |
| Yellamallappachetty | 6.5 | 93.8 | 1.52 | 0.27 |
| Prior- restoration wetlands | ||||
| Kommaghatta | 13.5 | 25.6 | 1.7 | 0.31 |
| Kothanur | 17 | 63.4 | 1.9 | 0.21 |
| Rachenahalli | 15.5 | 31.4 | 1.9 | 0.27 |
| Jakkur | 21.5 | 84.9 | 1.93 | 0.29 |
| Somapura | 21.5 | 10.3 | 1.29 | 0.51 |
| Post- restoration wetlands | ||||
| Kommaghatta | 24.5 | 63.7 | 2.5 | 0.12 |
| Kothanur | 10.5 | 68.8 | 1.72 | 0.26 |
| Rachenahalli | 18 | 81.8 | 2.23 | 0.15 |
| Jakkur | 17.5 | 71 | 2.3 | 0.12 |
| Somapura | 12 | 30.9 | 1.64 | 0.26 |
Table 2: Summary of physical and chemical parameter across wetland types (refer method section for water quality parameters)
| Wetland Names | pH | EC (°C) |
DO (mgL-1) |
BOD (mgL-1) |
COD (mgL-1) |
N (ppm) |
P (ppm) |
TH (mgL-1) |
CHL (mgL-1) |
ALK (mgL-1) |
|
| Reference wetlands | |||||||||||
| Hoskere | 7.25 | 401 | 7.5 | 3.32 | 18.6 | 0.24 | 0.004 | 116 | 42.6 | 180 | |
| Nelakondoddi | 7.41 | 368 | 7.85 | 3.95 | 18.33 | 0.54 | 0.04 | 106 | 44.02 | 180 | |
| Hesaraghatta | 8.29 | 574.5 | 8.35 | 3.35 | 14.3 | 0.64 | 0.12 | 168 | 99.4 | 250 | |
| Previously restored wetlands | |||||||||||
| Ulsoor | 9.43 | 657 | 2.84 | 16.47 | 42.94 | 0.22 | 1.95 | 254 | 376 | 476 | |
| Hebbal | 7.99 | 641.5 | 6.62 | 16.56 | 41.22 | 0.07 | 0.17 | 152.16 | 319.5 | 225.5 | |
| Madiwala | 7.38 | 1787 | 4.86 | 64.5 | 177.3 | 0.29 | 2.74 | 386 | 328.02 | 620 | |
| Polluted wetlands | |||||||||||
| Yelahanka | 9.19 | 1285 | 3.69 | 24.16 | 58.32 | 0.22 | 1.48 | 275 | 429 | 566 | |
| Varthur | 7.04 | 1245.5 | 2.96 | 34.27 | 81.3 | 0.42 | 1.71 | 268 | 187.44 | 500 | |
| Yellamallapa chetty | 6.93 | 1253 | 0 | 32.63 | 78.66 | 0.44 | 1.58 | 260 | 190.28 | 520 | |
| Prior- restoration wetlands | |||||||||||
| Jakkur | 8.04 | 1283 | 5.79 | 23.9 | 64.01 | 0.01 | 0.03 | 336.6 | 291.1 | 163 | |
| Rachenahalli | 9.07 | 870 | 7.54 | 18.63 | 56.72 | 0.02 | 0.02 | 222 | 199.75 | 120 | |
| Kommaghatta | 8.99 | 773.25 | 5.34 | 19.50 | 56 | 0.06 | 0.02 | 292 | 114.45 | 209 | |
| Kothanur | 9.12 | 667 | 7.23 | 21.9 | 46.5 | 0.07 | 0.05 | 75 | 140.58 | 193 | |
| Somapura | 8.74 | 1022.66 | 6.49 | 8.59 | 26.33 | 0.08 | 0.05 | 111 | 101.53 | 276 | |
| Post- restoration wetlands | |||||||||||
| Jakkur | 7.92 | 877 | 5.5 | 9.2 | 46 | 0.07 | 0.03 | 188.6 | 188.33 | 124 | |
| Rachenahalli | 8.19 | 867 | 4.63 | 7.15 | 35.75 | 0.03 | 0.05 | 124 | 139.3 | 156 | |
| Kommaghatta | 8.3 | 651 | 8.21 | 6 | 30.02 | 0.11 | 0.04 | 144 | 33.66 | 203 | |
| Kothanur | 7.17 | 1039 | 1.58 | 13.9 | 69.5 | 0.11 | 0.33 | 172.75 | 256.06 | 105 | |
| Somapura | 8.265 | 548 | 6.99 | 4.5 | 22.5 | 0.1 | 0.11 | 62.25 | 33.2 | 50 | |
Variation among wetlands with respect to biological oxygen demand (BOD) and chemical oxygen demand (COD) are listed in table 2. One-way ANOVA (analysis of variance) was performed to determine significant differences (p<0.05) among wetland groups with respect to diversity and % eutrophic taxa (Table 3). Percent eutrophic taxa (%ET) differed significantly among reference (REF), previously restored (PVR), post-restored (POR) and polluted (POL) wetland type with significant p<0.05, but similar between post-restored (POR), previously restored (PVR) and most of the prior restored wetlands (PRR). This indicated that there is no improvement in water quality in the earlier restored wetlands of Ulsoor and Madiwala due to continued inflow of sewage or misuse of wetlands during post restoration. Thus, identical values of chemical parameters at POR, PRR and PVR resulted in similar diatom community structures. ANOVA analyses also demonstrated that there was significant (p<0.05) difference within the wetland groups due to the various human disturbances.
Table 3 : One-way ANOVA analyses to measure variation among wetland type in terms of %eutrophic taxa and Shannon diversity index.
(PVR- previously restored wetlands; POR- post restoration wetlands; PRR- prior- restoration wetlands; POL- polluted wetlands; REF reference/clean wetlands)
| % Eutrophic taxa | SS | df | MS | F | p-value |
| PVR v/s POR | 289.45 | 1.5 | 289.4 | 0.48 | 0.51 |
| REF v/s POL | 10281.69 | 1.4 | 10281.69 | 187.9 | 0.00016 |
| REF v/s PVR | 6464.78 | 1.4 | 6464.78 | 14.57 | 0.018 |
| REF v/s POR | 4753.03 | 1.5 | 4753.03 | 14.37 | 0.012 |
| PRR v/s POR | 1018.81 | 1.8 | 1018.81 | 1.58 | 0.24 |
| Shannon diversity | SS | df | MS | F | p-value |
| PVR v/s POR | 1.3 | 1.5 | 1.3 | 2.6 | 0.13 |
| REF v/s POL | 1.24 | 1.10 | 1.24 | 5.4 | 0.04 |
| REF v/s PVR | 0.35 | 1.10 | 0.35 | 0.62 | 0.44 |
| REF v/s POR | 0.47 | 1.11 | 0.47 | 1.82 | 0.2 |
| PRR v/s POR | 0.58 | 1.18 | 0.58 | 2.9 | 0.1 |
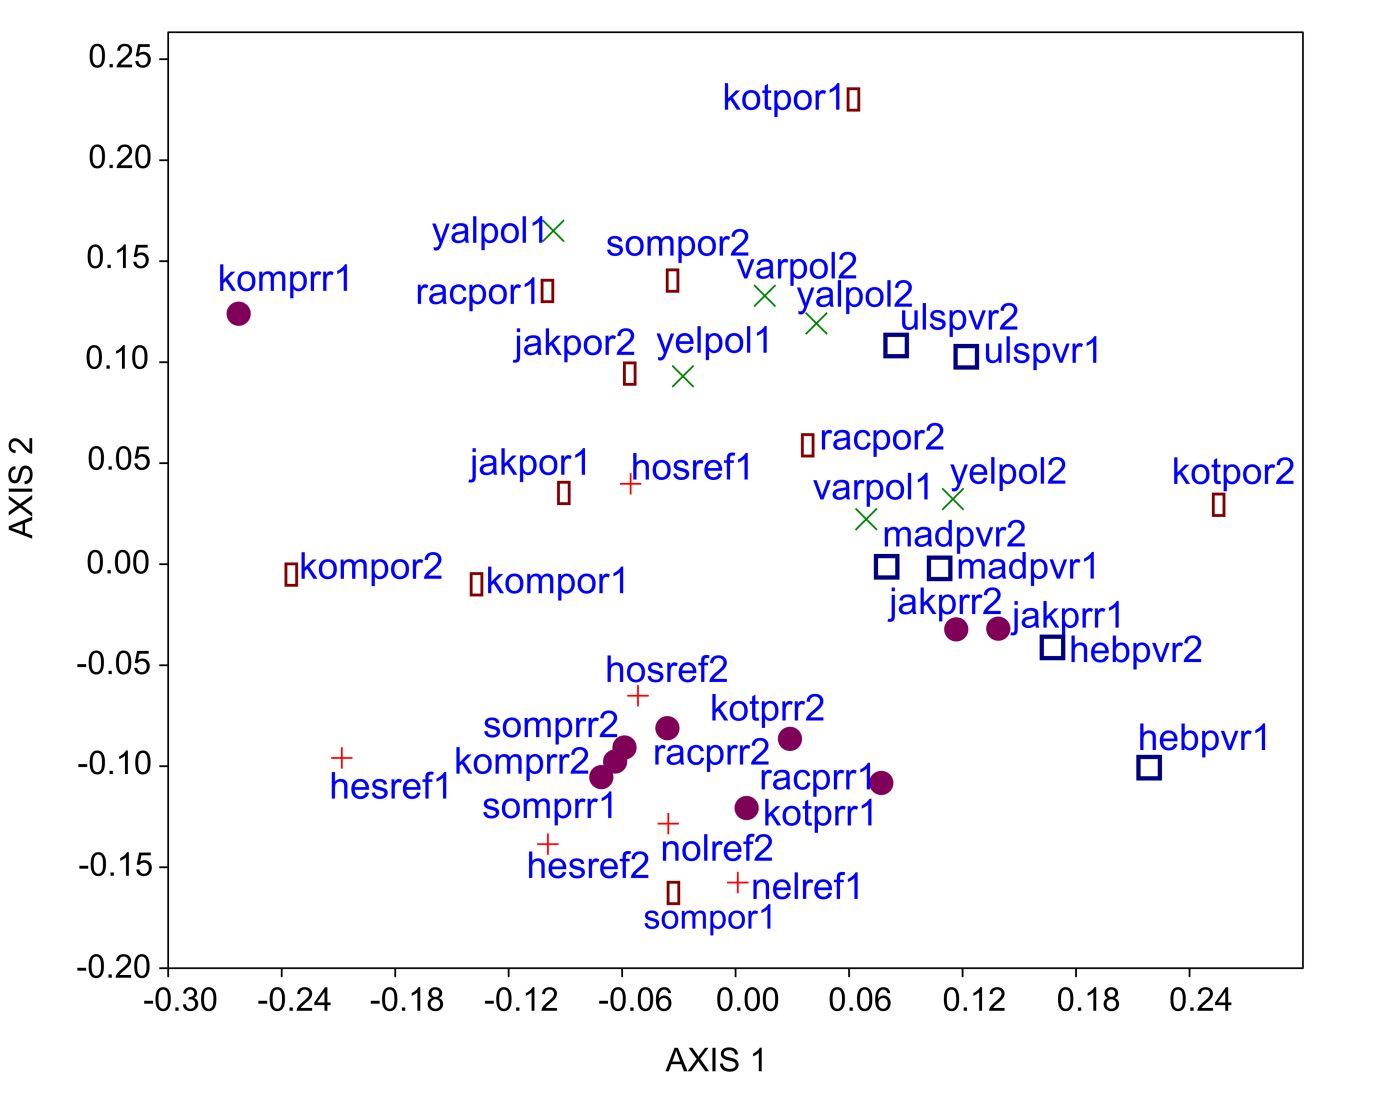
Non-metric multi-dimensional (NMDS) analyses was plotted to demonstrate the clustering of wetlands based on the diatom distribution and is represented in Figure 4. With a stress value of 1.499, NMDS axis 1 and 2 showed 0.48 and 0.368 variance, distributing all sampling sites into three clusters (Figure 4). Prior (shown as circles) and reference (shown as plus signs) sites were clustered into one group along with the Somapura wetland sampled during post-restoration (shown as rectangles). Top left group clustered polluted sites (shown as cross signs) with post restoration sites. The top right group characterized previously restored (shown as squares) polluted sites and Jakkur during prior restoration. Thus, Jakkur continued to be with higher levels of pollution in both prior and post restoration samples. NMDS axis 2 and relative abundance of Achnanthidium sp. indicated a strong similar species pattern along REF and PRR wetlands. NMDS axis 1 displayed scatter without any prominent cluster between top right and top left groups. However, high relative abundance of Fragilaria ulna var. acus (>80%) characterized Ulsoor among polluted wetlands.
Figure 4 : Non-metric multi-dimensional (NMDS) analyses to demonstrate clustering of wetlands based on the diatom distribution.