|
|
Conservation of Bellandur Wetlands: Obligation of Decision Makers to Ensure Intergenerational Equity
|
Executive Summary:
Bellandur lake catchment is located between 77° 35´ west and 77° 45´ east and latitude 12° 50´ south and 13° 00´ north (The Survey of India topographic map 57 H/9, scale: 1:50,000). The overall catchment area is about 287.33 sq. km with a water spread area of 361 ha. The terrain of the region is relatively flat and sloping towards south of Bangalore city. Relative slope of the region is found to be very gentle to gentle slope. The relative contour height is 930 m above mean sea level and the lowest is 880 m. The height is found to be 870 m above mean sea level near the tank. The drainage pattern is dendrite type and is characterized by gneiss and gneiss granite rocks. This water body has been a lifeline sustaining the livelihood of settlements in the catchment and command areas. Agriculture (rice and vegetables) practiced since many centuries in the downstream continues even today. Three main streams join the tank, which form the entire watershed. Three chain of lakes in the upstream joins Bellandur lake with a catchment area of about 148 square kilometres (14979 Hectares) and overflow of this lake gets into Varthur lake and from where it flows down the plateau and joins Pinakini river basin.
One of the streams originates at the northern part of the region, Jayamahal and known as eastern stream. Another stream originates from the central part of the city, Krishna Raja Market and covers the central part of the region before joining the tank and is called the central stream. Another stream commands southwestern part of the region called the western stream. Further, before the confluence with Bellandur Tank, all the streams come across two to three tanks. The rainfall data is available for the last 100 to 110 years. Rainfall varies from 725.5 mm to 844.8 mm. The district receives 51 % of the total annual rainfall in the southwest monsoon period, i.e. June to September. The average annual rainfall in the catchment was 859 mm in 1999. April is usually the hottest month with the mean daily maximum and minimum temperature of 33.4° C and 21.2° C respectively. December is generally the coolest month with the mean daily maximum and minimum temperature of 25° C and 15.3° C respectively. The temperature drops down to 8° C during January nights. Relative humidity is high from June to October (80 to 85 %). Thereafter, it decreases and from February to April becomes 25 to 35%. The relative humidity in the morning is higher than in the evening, giving rise to the formation of fog.
Unplanned rapid urbanisation during post 2000 witnessed large scale conversion of watershed area of the lake to residential and commercial layouts. This has altered the hydrological regime and enhanced the silt movement in the catchment. Declining vegetation cover has lowered water yield in the catchment, affecting the groundwater recharge. Alterations in ecological integrity is evident from reduced water yield, flash floods, contaminated water, obnoxious odour, copious growth of invasive floating macrophytes, disappearance of native fish species, breeding ground for mosquito and other disease vectors, etc. A major portion of untreated city sewage (500+ million liters per day) is let into the lake, beyond the neutralizing ability of the lake, which has hampered the ecological functioning of the lake.
Significance of wetlands: Wetlands are lands transitional between terrestrial and aquatic eco-systems where the water table is usually at or near the surface or the land is covered by shallow water. Wetlands are the most productive and biologically diverse but very fragile ecosystems. They function as kidneys of landscape due to remediation of contaminants (which include nutrients, heavy metals, etc.). These fragile ecosystems are vulnerable to even small changes in their biotic and abiotic factors. In recent years, there has been concern over the continuous degradation of wetlands due to unplanned developmental activities (Ramachandra, 2002).
Policy and legislative measures for Wetlands conservation in India are:
The proposed plan to set up SEZ by KIADB needs to be stopped and wetland to be restored considering
Activities |
Norms |
Location of the project (SEZ by Karnataka Industrial Areas Development Board (KIADB)) in the valley zone |
This is contrary to sustainable development as the natural resources (lake, wetlands) get affected due to this decision. Eventually this kills the lake. This reflects the ignorance of the administrative machinery on the importance of ecosystems and the need to protect valley zones |
The proposed activity is in valley zone |
To be protected considering ecological function
And are ‘NO DEVELOPMENT ZONES’ as per CDP 2005, 2015 |
Location of SEZ in flood prone zone of the lake and in wetland - 30 m buffer zone of the water body is to be no development zone |
In case of water bodies a 30.0 m buffer of ‘no development zone’ is to be maintained
around the lake (as per revenue records)
- As per BDA, RMP 2015
- section 17 of KTCP Act, 1961 and sec 32 of BDA Act, 1976
- Wetlands (Conservation and Management) rules 2010, Government of India
|
Alterations in topography |
Adjacent localities would be vulnerable to floods |
Removal of rajakaluve (storm water drain) and gradual encroachment of rajakaluve as well as lake bed |
Removal of lake connectivity enhances the episodes of flooding and associated disasters
The Hon’ble Supreme Court in Civil appeal number 1132/2011 at SLP (C) 3109/2011 on January 28,2011 has ex-pressed concern regarding encroachment of common property resources, more particularly lakes and it has directed the state governments for removal of encroachments on all community lands.
Eviction of encroachment: Need to be evicted as per Karnataka Public Premises (eviction of unauthorised occupants) 1974 and the Karnataka Land Revenue Act, 1964. |
The proposed action by KIADB to set up SEZ violates Hon’ble High Court of Karnataka’s verdict to protect, conserve, rehabilitate and wisely use lakes and their watersheds in Bangalore all lakes in Karnataka and their canal networks (about 38,000) |
High Court of Karnataka (WP No. 817/2008)
- Protects lakes across Karnataka,
- Prohibits dumping of Garbage and Sewage in Lakes
- Lake area to be surveyed and fenced and declare a no development zone around lakes
- Encroachments to be removed.
- Forest department to plant trees in consultation with experts in lake surroundings and in the watershed region
- Member Secretary of state legal services authority to monitor implementation of the above in coordination with Revenue and Forest Departments.
- Also set up district lake protection committees
|
Additional 10000 to 14000 vehicles |
Increases traffic bottleneck in the region and air pollution (with the increase in density of vehicles) |
Increase in vehicular traffic and enhanced pollutants |
Traffic congestion (due to additional vehicle movement). The density of traffic would increase, the road’s current level of service (LOS) is under category C , the increase in vehicles upto 14000+ would worsen the traffic condition with LOS under category F. enhanced levels of vehicular pollutants; likely increase in respiratory diseases; |
Water shortage
The estimate shows that SEZ requires 4587 Kilo Liters per day (4.58 MLD – Million liters per day) |
Bangalore is already experiencing severe water shortages as water yield in rivers (Cauvery, etc.) has come down due to large scale land cover changes. Neither Cauvery, T G Halli nor groundwater can sustain Bangalore’s growing water demand.
BWSSB has not given NOC and has indicated inability to supply such huge quantity of water on regular basis. |
Pathetic water scenario and insufficient drinking water in Bangalore |
At the 4% population growth rate of Bangalore over the past 50 years, the current population of Bangalore is 8.5 million (2011). Water supply from Hessarghatta has dried, Tippegondahanally is drying up, the only reliable water supply to Bangalore is from Cauvery with a gross of 1,410 million liters a day (MLD). There is no way of increasing the drawal from Cauvery as the allocation by the Cauvery Water Disputes Tribunal for the entire urban and rural population in Cauvery Basin in Karnataka is only 8.75 TMC ft (one thousand million cubic – TMC ft equals 78 MLD), Bangalore city is already drawing more water—1,400 MLD equals 18 TMC—than the allocation for the entire rural and urban population in Cauvery basin. |
Ecological and Environmental Implications:
- Land use change: Conversion of watershed area especially valley regions of the lake to paved surfaces would alter the hydrological regime.
- Loss of Drainage Network: Removal of drain (Rajakaluve) and reducing the width of the drain would flood the surrounding residential as the interconnectivities among lakes are lost and there are no mechanisms for the excessive storm water to drain and thus the water stagnates flooding in the surroundings.
- Alteration in landscape topography: This activity alters the integrity of the region affecting the lake catchment. This would also have serious implications on the storm water flow in the catchment.
The dumping of construction waste along the lakebed and lake has altered the natural topography thus rendering the storm water runoff to take a new course that might get into the existing residential areas. Such alteration of topography would not be geologically stable apart from causing soil erosion and lead to siltation in the lake.
- Loss of Shoreline: The loss of shoreline along the lakebed results in the habitat destruction for most of the shoreline birds that wade in this region. Some of the shoreline wading birds like the Stilts, Sandpipers; etc will be devoid of their habitat forcing them to move out such disturbed habitats. It was also apparent from the field investigations that with the illogical land filling and dumping taking place in the Bellandur lakebed, the shoreline are gobbled up by these activities.
- Loss of livelihood: Local people are dependent on the wetlands for fodder, fish etc. estimate shows that wetlands provide goods and services worth Rs 10500 per hectare per day (Ramachandra et al., 2005).
Decision makers need to learn from the similar historical blunder of plundering ecosystems as in the case of Black Swan event (http://blackswanevents.org/?page_id=26) of evacuating half of the city in 10 years due to water scarcity, contaminated water, etc. or abandoning of Fatehpur Sikhri and fading out of Adil Shahi’s Bijapur, or ecological disaster at Easter Island or Vijayanagara empire
It is the responsibility of Bangalore citizens (for intergenerational equity, sustenance of natural resources and to prevent human-made disasters such as floods, etc.) to stall the irrational conversion of land in the name of development and restrict the decision makers taking the system (ecosystem including humans) for granted as in the case of Bellandur wetlands by KIADB. |
Keywords: Wetlands, Urbanisation, wetlands, intergenerational equity, Bellandur
Introduction
Wetlands constitute vital components of the regional hydrological cycle, highly productive, support exceptionally large biological diversity and provide a wide range of ecosystem services, such as food and fibre; waste assimilation; water purification; flood mitigation; erosion control; groundwater recharge; microclimate regulation; enhance aesthetics of the landscape; support many significant recreational, social and cultural activities, besides being a part of our cultural heritage. It was acknowledged that most of urban wetlands are seriously threatened by conversion to non-wetland purposes, encroachment of drainage, through landfill, pollution (discharge of domestic and industrial effluents, disposal of solid wastes), hydrological alterations (water withdrawal and inflow changes), and over-exploitation of their natural resources resulting in loss of biodiversity and disruption in goods and services provided by wetlands (Ramachandra, 2002; 2009a,b; Ramachandra et al., 2012a,b). This report addresses the implications of setting up SEZ in an ecologically fragile wetlands. Also, provides insights to the strategies considering the current trends in aquatic ecosystem conservation, restoration and management including the hydrological and the biophysical aspects, peoples’ participation and the role of non-governmental, educational and governmental organisations’ needs for the restoration, conservation and management.
Urbanisation is a form of metropolitan growth that is a response to often bewildering sets of economic, social, and political forces and to the physical geography of an area. It is the increase in the population of cities in proportion to the region's rural population. The 20th century is witnessing "the rapid urbanisation of the world’s population", as the global proportion of urban population rose dramatically from 13% (220 million) in 1900, to 29% (732 million) in 1950, to 49% (3.2 billion) in 2005 and is projected to rise to 60% (4.9 billion) by 2030. Urban ecosystems are the consequence of the intrinsic nature of humans as social beings to live together (Ramachandra et al., 2012a; 2012b; Ramachandra and Kumar, 2008). The process of urbanisation contributed by infrastructure initiatives, consequent population growth and migration results in the growth of villages into towns, towns into cities and cities into metros. Urbanisation and urban sprawl have posed serious challenges to the decision makers in the city planning and management process involving plethora of issues like infrastructure development, traffic congestion, and basic amenities (electricity, water, and sanitation), etc. (Ramachandra and Shwetmala, 2009; Ramachandra, 2009c). Land use analyses show 584% growth in built-up area during the last four decades with the decline of vegetation by 66% and water bodies by 74%. Analyses of the temporal data reveals an increase in urban built up area of 342.83% (during 1973 to 1992), 129.56% (during 1992 to 1999), 106.7% (1999 to 2002), 114.51% (2002 to 2006) and 126.19% from 2006 to 2010 (Ramachandra et al., 2012a). The major implications of unplanned urbanisation are:
-
Loss of wetlands and green spaces: Urbanisation has telling influences on the natural resources such as decline in green spaces (vegetation) including wetlands and / or depleting groundwater table (Ramachandra, 2002).
-
Floods: Common consequences of urban development are increased peak discharge and frequency of floods as land is converted from fields or woodlands to roads and parking lots, it loses its ability to absorb rainfall. Conversion of water bodies to residential layouts has compounded the problem by removing the interconnectivities in an undulating terrain. Encroachment of natural drains, alteration of topography involving the construction of high rise buildings, removal of vegetative cover, reclamation of wetlands are the prime reasons for frequent flooding even during normal rainfall post 2000 (Ramachandra et al., 2012a).
-
Decline in groundwater table: Studies reveal the removal of water bodies has led to the decline in water table. Water table has declined to 300 m from 28 m over a period of 20 years after the reclamation of lake with its catchment for commercial activities. Also, groundwater table in intensely urbanized area such as Whitefield, etc. has now dropped to 400 to 500m (Ramachandra et al., 2002).
-
Heat island: Surface and atmospheric temperatures are increased by anthropogenic heat discharge due to energy consumption, increased land surface coverage by artificial materials having high heat capacities and conductivities, and the associated decreases in vegetation and water pervious surfaces, which reduce surface temperature through evapotranspiration (Ramachandra and Kumar 2009).
-
Increased carbon footprint: Due to the adoption of inappropriate building architecture, the consumption of electricity has increased in certain corporation wards drastically. The building design conducive to tropical climate would have reduced the dependence on electricity. Higher energy consumption, enhanced pollution levels due to the increase of private vehicles, traffic bottlenecks have contributed to carbon emissions significantly. Apart from these, mismanagement of solid and liquid wastes has aggravated the situation (Ramachandra and Shwetmala, 2009; Ramachandra et al., 2012a; 2012b).
Bangalore Lakes and Bellandur
Greater Bangalore is the administrative, cultural, commercial, industrial, and knowledge capital of the state of Karnataka, India with an area of 741 sq. km. and lies between the latitude 12°39’00’’ to 13°13’00’’ N and longitude 77°22’00’’ to 77°52’00’’ E (Figure 1). Bangalore city administrative jurisdiction was redefined in the year 2006 by merging the existing area of Bangalore city spatial limits with 8 neighbouring Urban Local Bodies (ULBs) and 111 Villages of Bangalore Urban District. Bangalore has grown spatially more than ten times since 1949 (~69 square kilometres to 716 square kilometres) and is the fifth largest metropolis in India currently with a population of about 9 million (Ramachandra and Kumar, 2008; Ramachandra et al., 2012a; 2012b). Bangalore city population has increased enormously from 65,37,124 (in 2001) to 95,88,910 (in 2011), accounting for 46.68 % growth in a decade. Population density has increased from as 10732 (in 2001) to 13392 (in 2011) persons per sq. km. The per capita GDP of Bangalore is about $2066, which is considerably low with limited expansion to balance both environmental and economic needs.
Bangalore once a garden city, became garbage city and now in the verge of becoming a dead city due to consistent mismanagement of natural resources. The transition from garden city to dead city has taken place because of the unplanned rapid urbanisation involving concentrated growth. Bangalore witnessed the software industry boon during early 2000. Due to this, there is drastic increase in population with the enhanced demand for water and electricity. Apart from this, lack of infrastructure is evident from traffic bottlenecks, etc.
About 80% of water supplied as demand turns as liquid waste either as domestic waste water or industrial waste water that contain high amounts of toxic, organic, inorganic wastes. Most of the sewage and wastewater generated is discharged directly into storm water drains that ultimately link to water bodies. The undulating terrain in the region facilitated the creation of a large number of tanks in the past, providing for the traditional uses of irrigation, drinking, fishing and washing. This led to Bangalore having hundreds of such water bodies through the centuries. In 1961, the number of lakes and tanks in the city stood at 262. A large number of water bodies (locally called lakes or tanks) in the City had ameliorated the local climate, and maintained a good water balance in the neighborhood. Since Bangalore is located on a ridge with natural water courses along the three directions of the Vrishabhavaty, Koramangala-Challaghatta (K&C) and Hebbal-Nagavara valley systems (Figure 2), these water courses are today being used for the transport and disposal of the city’s sewage. The shortfall or lack of sewage treatment facilities have contaminated the majority of surface and ground waters.
The Koramangala Chalaghatta valley (Figure 2, Figure 3), tributary of Periayar River, located towards the south east of Greater Bangalore. The following are lakes along the valley: Varthur, Bellandur, Agaram, Puttenahalli, Chalaghatta, Madivala, Sarakki, Hhulimavu, Lalbhag, Bayappanahalli, Vibuthipura, Kundalhalli, Ibburu, Ulsoor, Beguru, etc.
Bellandur Lake located in the south-eastern portion of Greater Bangalore is towards the upstream of Varthur lake, the drainage network for Bellandur lake has 3 drainage network:
- In the north originating at Jayamahal covering eastern portion of the City;
- Drains originating from the central part near K R Market covering the central portion of the City;
- Originating from the southern part of the city near Hulimavu.
Bellandur lake has a history over 130 years, post 1980’s the drainage chains feeding the lakes were broken due to unchecked industrial, residential as well as commercial development in the region, the lands near the lake were allotted for development of ring road post 1990 during which there was industrial development
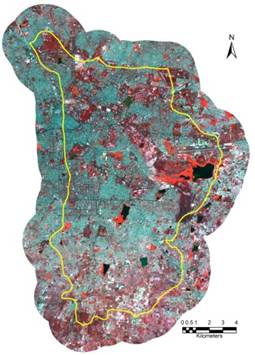
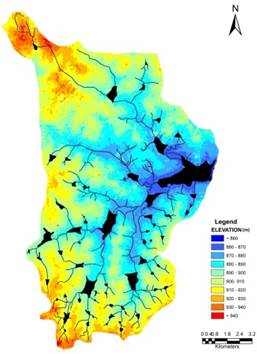
The Bellandur catchment extends from 12050’N to 1301’47”N in latitude and 77033’14” E to 77041’1”E in longitude with an area of 171.17 km2. . The Bellandur Lake itself encompasses an area of 338.29 hectares. Bellandur lake catchment and its drainage network are represented in figure 3. The false colour satellite composite of Bellandur catchment (Figure 4) highlight the heterogeneity of the landscape. The digital elevation model (figure 4) depicts the undulating terrain with interconnected water bodies. The terrain altitude gradually varies from City center (North western part of catchment) 962m to 850m above MSL at the lake. Population in the catchment given in Table 1 show an increase from 1425105 (1991) to 3410383 (2011)
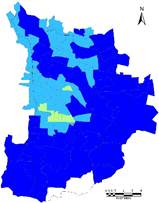
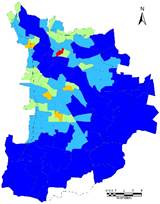
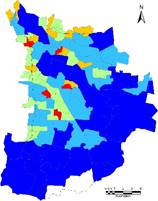
The population density (figure 5) in the Bellandur catchment has shown a sharp increase from 100 persons per hectare (2001) to over 141.96 (2011) and 750 persons per hectare (in 2011) in certain wards, mainly due to migration.
Table 1: Population of all the wards under Bellandur catchment
Year |
Population |
Population density
persons / ha |
1991 |
1425105 |
59.32 |
2001 |
2417744 |
100.63 |
2011 |
3410383 |
141.96 |

Figure 1: Greater Bangalore
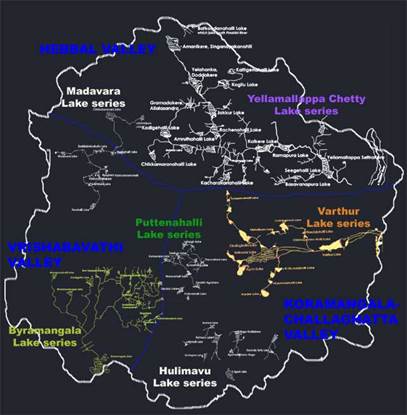
Figure 2: Lake Series in Bangalore
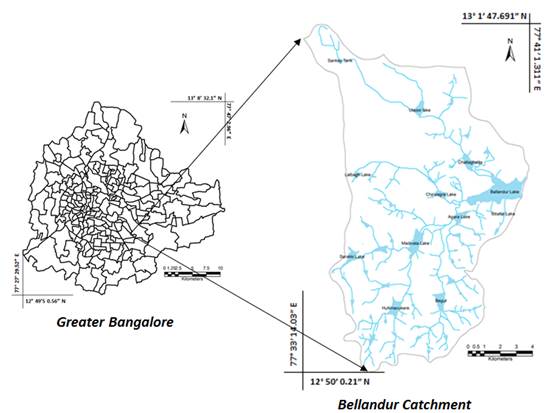
Figure 3: Bellandur Drainage Network
Figure 4: FCC and DEM
Figure 5: Population Density
Threats faced by Wetlands in Bangalore: Greater Bangalore had 207 water bodies in 1973 (Figure 6), which declined to 93 (in 2010). The rapid development of urban sprawl has many potentially detrimental effects including the loss of valuable agricultural and eco-sensitive (e.g. wetlands, forests) lands, enhanced energy consumption and greenhouse gas emissions from increasing private vehicle use (Ramachandra and Shwetmala, 2009). Vegetation has decreased by 32% (during 1973 to 1992), 38% (1992 to 2002) and 63% (2002 to 2010).
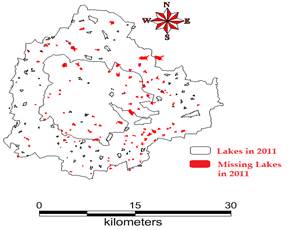
Figure 6: Lakes encroached by land mafia
Disappearance of water bodies or sharp decline in the number of water bodies in Bangalore is mainly due to intense urbanisation and urban sprawl. Many lakes (54%) were encroached for illegal buildings. Field survey of all lakes (in 2007) shows that nearly 66% of lakes are sewage fed, 14% surrounded by slums and 72% showed loss of catchment area. Also, lake catchments were used as dumping yards for either municipal solid waste or building debris (Ramachandra, 2009a; 2012a). The surrounding of these lakes have illegal constructions of buildings and most of the times, slum dwellers occupy the adjoining areas. At many sites, water is used for washing and household activities and even fishing was observed at one of these sites. Multi-storied buildings have come up on some lake beds that have totally intervene the natural catchment flow leading to sharp decline and deteriorating quality of water bodies. This is correlated with the increase in built up area from the concentrated growth model focusing on Bangalore, adopted by the state machinery, affecting severely open spaces and in particular water bodies. Some of the lakes have been restored by the city corporation and the concerned authorities in recent times. Threats faced by lakes and drainages of Bangalore:
- Encroachment of lakebed, flood plains, and lake itself;
- Encroachment of rajakaluves / storm water drains and loss of interconnectivity;
- Lake reclamation for infrastructure activities;
- Topography alterations in lake catchment;
- Unauthorised dumping of municipal solid waste and building debris;
- Sustained inflow of untreated or partially treated sewage and industrial effluents;
- Removal of shoreline riparian vegetation;
- Pollution due to enhanced vehicular traffic.
These anthropogenic activities particularly, indiscriminate disposal of industrial effluents and sewage wastes, dumping of building debris have altered the physical, chemical as well as biological integrity of the ecosystem. This has resulted in the ecological degradation, which is evident from the current ecosystem valuation of wetlands. Global valuation of coastal wetland ecosystem shows a total of 14,785/ha US$ annual economic value. Valuation of relatively pristine wetland in Bangalore shows the value of Rs. 10,435/ha/day while the polluted wetland shows the value of Rs.20/ha/day (Ramachandra et al., 2005). In contrast to this, Varthur, a sewage fed wetland has a value of Rs.118.9/ha/day (Ramachandra et al., 2011). The pollutants and subsequent contamination of the wetland has telling effects such as disappearance of native species, dominance of invasive exotic species (such as African catfish, water hyacinth, etc.), in addition to profuse breeding of disease vectors and pathogens. Water quality analyses revealed of high phosphates (4.22-5.76 ppm) levels in addition to the enhanced BOD (119-140 ppm) and decreased DO (0-1.06 ppm). The amplified decline of ecosystem goods and services with degradation of water quality necessitates the implementation of sustainable management strategies to recover the lost wetland benefits.
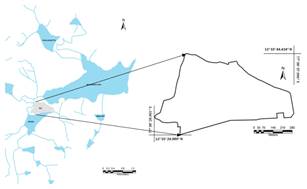
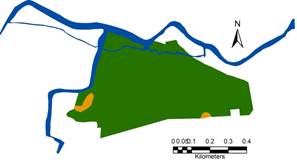
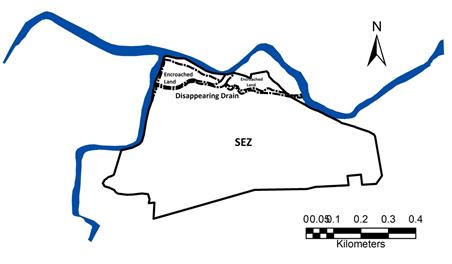
SEZ in Bellandur Wetlands: Irrational decision of setting up SEZ at Bellandur wetland would affect the lake. The Mixed Use Development Project - SEZ (figure 6) is proposed along Sarjapur Road in a wetland between Bellandur and Agara Lake, extending from 77°38’28.96” E to 77°38’57.99” E of Longitude and 12°55’24.98” N to 12°55’44.43” N of Latitude with an area of 33 hectare. The proposal of the project is to construct residential areas, offices, and retail and hotel buildings in this area.
Figure 6: SEZ
Significance of the Region:
-
Wetlands with remediation functional ability (function as kidneys of the landscape). Removal of wetlands will affect the functional ability of the lake and would result in the death of Bellandur lake;
-
Considering severe water shortage to meet the drinking water requirement in Bangalore, there is a need to remove deposited silt in the Bellandur lake, which will enhance the storage capacity and in turn helps in mitigating the water requirement;
-
Wetlands aid in recharging groundwater as soil are permeable;
-
Belanduru lake provide food (fish, etc.) and fodder;
-
Retain the excess water and prevent flooding in the vicinity;
-
Large number of farmers in the downstream is dependent on Belanduru lake water for agriculture, vegetable, etc.
Realizing these, BDA has aptly earmarked these regions in CDP 2005 for “ENVIRONMENT PROTECTION AND HERITAGE CONSERVATION”. The masterplan includes the protection of valleys and tanks as part of the vision and enforcing the ban on construction over protected areas. CDP 2015: As per CDP 2015, valley region are “No Development Zone”
- In case of water bodies a 30.0 m buffer of ‘no development zone’ is to be maintained around the lake (as per revenue records) with exception of activities associated with lake and this buffer may be taken into account for reservation of park while sanctioning plans.
- If the valley portion is a part of the layout/ development plan, then that part of the valley zone could be taken into account for reservation of parks and open spaces both in development plan and under subdivision regulations subject to fulfilling section 17 of KTCP Act, 1961 and sec 32 of BDA Act, 1976.
- Rajakaluve/ storm water drains categorized into 3 types namely primary, secondary and tertiary. These drains will have a buffer of 50, 25 and 15m (measured from the centre of the drain) respectively on either side. No activities shall be permitted in the buffer zone.
SEZ in the wetland and assessment of damages
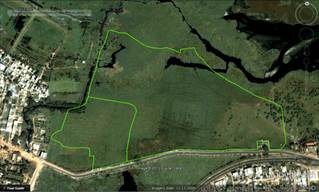
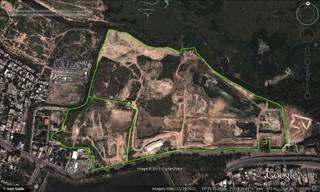
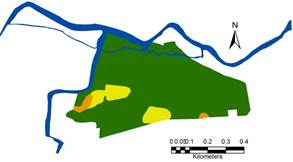
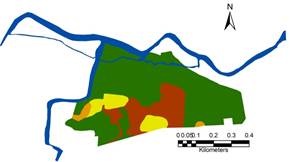
Drainage network and Land cover of the wetland region were mapped using temporal Google earth (http://www.googleearth.com) for the period 2007 to 2012, and the changes in land use and drainages (network as well as width of the channel/drain). Figure 7 depicts drastic land use changes evident from the conversion of wetland to open land (at the proposed SEZ site) during 2000 to 2012. Temporal change analysis done for the region is given in Table 1. Figure 8 illustrates land use changes between 2007 and 2012. Wetlands have decreased from 32.8 Ha to 5.95 Ha whereas the Open land (Conversion of Wetlands to SEZ Construction site) has increased from 0.6 Ha to 27.46 Ha.
Table1: Change in Land use
Year |
Wetland in Ha |
Open land in Ha |
2007 |
32.80 |
0.60 |
2008 |
30.22 |
3.18 |
2009 |
24.31 |
9.10 |
2010 |
19.17 |
14.23 |
2011 |
16.63 |
16.77 |
2012 |
5.95 |
27.46 |
|
|
2000 |
2012 |
Figure 7: land use in the SEZ region during 2000 and 2012
 |
|
2007 |
2008 |
|

|
2009 |
2010 |

|

|
2011 |
2012 |
Legend: Changes in Wetland  |
Figure 8: Change in wetland between 2007 to 2012
 |
2007 - 2009 |
|
2010 - 2011 |
|
2012 |
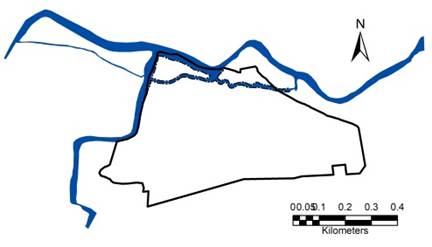
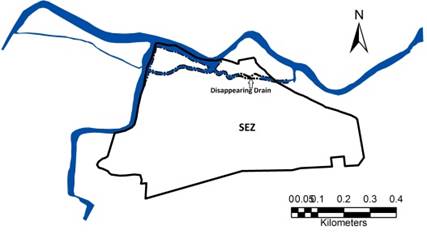
Figure 9: Change in drain network
The change in drainage pattern between 2007 and 2012 is shown in figure 9 and table 2 gives the extent of encroachment of drainage and wetland.
Table2: Encroachment of drainage and wetland
Description |
Area in Ha |
Length in m |
Altered drain width and encroachment |
0.5 |
390 |
Encroached a drain |
0.56 |
586 |
Encroached Wetland |
2.06 |
- |
Effect on vehicle traffic in the region: Figure 10 gives the existing road network (Main Roads) in the region; the length between 2 signals on either side of the SEZ is approximately 1.88 km (Google Earth) the width of road is 15.5 m, 4 lanes and two ways. The capacity of urban roads is listed in table 3.
Table 3: Capacity of urban Roads as per IRC
No. of Traffic Lanes and width |
Traffic Flow |
Capacity in PCU per hour for traffic condition |
Roads with no frontage access, no standing vehicles, very little cross traffic |
Roads with frontage access, but no standing vehicle and high capacity intersections |
Roads with free frontage access, parked vehicles and heavy cross traffic |
Two lane
7.0-7.5 m |
One way |
2400 |
1500 |
1200 |
Two lane
7.0-7.5 m |
Two way |
1500 |
1200 |
750 |
Three lane
10.5 m |
One way |
3600 |
2500 |
2000 |
Four lane
14.0 – 15.5 m |
One way |
4800 |
3000 |
2400 |
Four lane
14.0 – 15.5 m |
Two way |
4000 |
2500 |
2000 |
6 lane
21 m |
Two way |
6000 |
4200 |
3600 |
Source: S.K.Khanna & C.E.G.Justo, (2005). Highway Engineering, 8th Edition, Table 5.8,pp 185-211
Road maximum capacity: As per IRC (http://www.irc.org.in - Indian Road Congress) for a 4 lane road with traffic flow on both sides, for roads with no frontage access, no standing vehicles, very little cross traffic (intersection) capacity is 4000 PCU/hour (PCU- Passenger Car Unit). The capacity for Sarjapur road was estimated to be 3500 PCU/hour, on either side of the road, with average length of a PCU as 4 m at an average speed of 45 kmph and driver reaction time of 0.7 seconds. Along sarjapur road, during the highest peak hour traffic, the number of vehicles is approximately 2000 PCU’s/hour. With this the level of service (LOS) based on the ratio of observed to maximum capacityis
V/C = 2000/3500 = 0.571
For the ratio of 0.57, the current Level of service in under category “C” as per Table 4.

Figure 10: Bellandur Catchement Road Network
Table 4: Category of Roads based on traffic and service
V/C ratio |
LOS |
Performance |
0.0 – 0.2 |
A |
Excellent |
0.2 – 0.4 |
B |
Very Good |
0.4 – 0.6 |
C |
Average / Fair |
0.6 – 0.8 |
D |
Poor |
0.8 – 1.0 |
E |
Very Poor |
1.0 – 1.2 |
F |
Very Very Poor |
Source: IRC
The SEZ has a capacity of over 14000 Car units, in addition to this because of the Floating population that travel in their own mode of transit yields an additional vehicular population.
With added 14000 cars, assuming 8 hour of traffic in a day, the density of car units would increase by 1750 units per hour increasing the traffic to 3750PUC’s/hour. Then the V/C ratio is
V/C = (2000 + 1750) / 3500 = 1.07
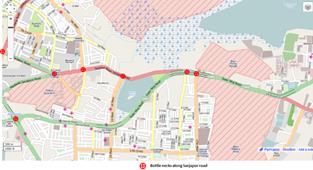
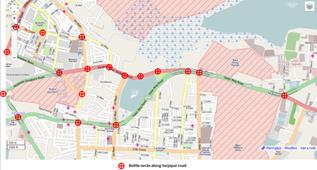
The ratio of 1.07 is equivalent to an LOS category of “F” indicating very very poor traffic conditions indicating higher chances of traffic congestion. The current bottle necks along the Sarjapur Road is as depicted in figure 10(a) and likely bottleneck due to the addition of 14000+ vehicles, is depicted in figure 10(b). Traffic bottlenecks also have higher levels of pollutants such as particulate matter, CO2, NOx, SO2.
 |
|
a. Existing bottlenecks |
b. Likely bottlenecks after SEZ |
Figure 11: Traffic bottlenecks
Major Violations:
- Development in the wetland - Violation of CDP 2015 as valley zone is supposed to be protected as the region is “No Development Zone”;
- the wetland removal wit vegetation effects the ecological functioning. The plants and algae in wetlands aids in bioremediation by uptake of nutrient and heavy metals;
- this activity enchases flooding in the vicinity due to
- Encroachment of drains / rajakaluves;
- Alterations in topography;
- encroachment of lakebed; and
- encroaching of lake itself by dumping debris and filling up of same
- construction activity in the lake floodplain;
- violation of 30 m buffer (lake floodplain);
- encroachment of a drain and land (2.06 hectares);
- gradual encroachment of another drain (by filling with building debris);
- filling of a portion of lake with building debris;
- alterations in topography;
- traffic congestion (due to additional vehicle movement). The density of traffic would increase, the road’s current level of service (LOS) is under category C , the increase in vehicles upto 14000+ would worsen the traffic condition with LOS under category F. enhanced levels of vehicular pollutants; likely increase in respiratory diseases;
- insufficient drinking water in Bangalore (how decision makers can make provision for large quantity of water requirement during construction and operation phase);
The proposed plan to set up SEZ by KIADB needs to be stopped and wetland to be restored considering
Activities |
Norms |
Location of the project (SEZ by Karnataka Industrial Areas Development Board (KIADB)) in the valley zone |
This is contrary to sustainable development as the natural resources (lake, wetlands) get affected due to this decision. Eventually this kills the lake. This reflects the ignorance of the administrative machinery on the importance of ecosystems and the need to protect valley zones |
The proposed activity is in valley zone |
To be protected considering ecological function
And are ‘NO DEVELOPMENT ZONES’ as per CDP 2005, 2015 |
Location of SEZ in flood prone zone of the lake and in wetland - 30 m buffer zone of the water body is to be no development zone |
In case of water bodies a 30.0 m buffer of ‘no development zone’ is to be maintained
around the lake (as per revenue records)
- As per BDA, RMP 2015
- section 17 of KTCP Act, 1961 and sec 32 of BDA Act, 1976
- Wetlands (Conservation and Management) rules 2010, Government of India
|
Alterations in topography |
Adjacent localities would be vulnerable to floods |
Removal of rajakaluve (storm water drain) and gradual encroachment of rajakaluve as well as lake bed |
Removal of lake connectivity enhances the episodes of flooding and associated disasters
The Hon’ble Supreme Court in Civil appeal number 1132/2011 at SLP (C) 3109/2011 on January 28,2011 has ex-pressed concern regarding encroachment of common property resources, more particularly lakes and it has directed the state governments for removal of encroachments on all community lands.
Eviction of encroachment: Need to be evicted as per Karnataka Public Premises (eviction of unauthorised occupants) 1974 and the Karnataka Land Revenue Act, 1964. |
The proposed action by KIADB to set up SEZ violates Hon’ble High Court of Karnataka’s verdict to protect, conserve, rehabilitate and wisely use lakes and their watersheds in Bangalore all lakes in Karnataka and their canal networks (about 38,000) |
High Court of Karnataka (WP No. 817/2008)
- Protects lakes across Karnataka,
- Prohibits dumping of Garbage and Sewage in Lakes
- Lake area to be surveyed and fenced and declare a no development zone around lakes
- Encroachments to be removed.
- Forest department to plant trees in consultation with experts in lake surroundings and in the watershed region
- Member Secretary of state legal services authority to monitor implementation of the above in coordination with Revenue and Forest Departments.
- Also set up district lake protection committees
|
Additional 10000 to 14000 vehicles |
Increases traffic bottleneck in the region and air pollution (with the increase in density of vehicles) |
Increase in vehicular traffic and enhanced pollutants |
Traffic congestion (due to additional vehicle movement). The density of traffic would increase, the road’s current level of service (LOS) is under category C , the increase in vehicles upto 14000+ would worsen the traffic condition with LOS under category F. enhanced levels of vehicular pollutants; likely increase in respiratory diseases; |
Water shortage
The estimate shows that SEZ requires 4587 Kilo Liters per day (4.58 MLD – Million liters per day) |
Bangalore is already experiencing severe water shortages as water yield in rivers (Cauvery, etc.) has come down due to large scale land cover changes. Neither Cauvery, T G Halli nor groundwater can sustain Bangalore’s growing water demand.
BWSSB has not given NOC and has indicated inability to supply such huge quantity of water on regular basis. |
Pathetic water scenario and insufficient drinking water in Bangalore |
At the 4% population growth rate of Bangalore over the past 50 years, the current population of Bangalore is 8.5 million (2011). Water supply from Hessarghatta has dried, Tippegondahanally is drying up, the only reliable water supply to Bangalore is from Cauvery with a gross of 1,410 million liters a day (MLD). There is no way of increasing the drawal from Cauvery as the allocation by the Cauvery Water Disputes Tribunal for the entire urban and rural population in Cauvery Basin in Karnataka is only 8.75 TMC ft (one thousand million cubic – TMC ft equals 78 MLD), Bangalore city is already drawing more water—1,400 MLD equals 18 TMC—than the allocation for the entire rural and urban population in Cauvery basin. |
Ecological and Environmental Implications:
- Land use change: Conversion of watershed area especially valley regions of the lake to paved surfaces would alter the hydrological regime.
- Loss of Drainage Network: Removal of drain (Rajakaluve) and reducing the width of the drain would flood the surrounding residential as the interconnectivities among lakes are lost and there are no mechanisms for the excessive storm water to drain and thus the water stagnates flooding in the surroundings.
- Alteration in landscape topography: This activity alters the integrity of the region affecting the lake catchment. This would also have serious implications on the storm water flow in the catchment.
The dumping of construction waste along the lakebed and lake has altered the natural topography thus rendering the storm water runoff to take a new course that might get into the existing residential areas. Such alteration of topography would not be geologically stable apart from causing soil erosion and lead to siltation in the lake.
- Loss of Shoreline: The loss of shoreline along the lakebed results in the habitat destruction for most of the shoreline birds that wade in this region. Some of the shoreline wading birds like the Stilts, Sandpipers; etc will be devoid of their habitat forcing them to move out such disturbed habitats. It was also apparent from the field investigations that with the illogical land filling and dumping taking place in the Bellandur lakebed, the shoreline are gobbled up by these activities.
- Loss of livelihood: Local people are dependent on the wetlands for fodder, fish etc. estimate shows that wetlands provide goods and services worth Rs 10500 per hectare per day (Ramachandra et al., 2005).
Decision makers need to learn from the similar historical blunder of plundering ecosystems as in the case of Black Swan event (http://blackswanevents.org/?page_id=26) of evacuating half of the city in 10 years due to water scarcity, contaminated water, etc. or abandoning of Fatehpur Sikhri and fading out of Adil Shahi’s Bijapur, or ecological disaster at Easter Island or Vijayanagara empire.
It is the responsibility of Bangalore citizens (for intergenerational equity, sustenance of natural resources and to prevent human-made disasters such as floods, etc.) to stall the irrational conversion of land in the name of development and restrict the decision makers taking the system (ecosystem including humans) for granted as in the case of Bellandur wetlands by KIADB. |
References
-
Ramachandra, T.V. (2002). Restoration and management strategies of wetlands in developing countries. Electronic Green Journal, 15. http://egj.lib.uidaho.edu/index.php/egj/article/view/2839/2797
-
Ramachandra, T.V., Kiran, R., & Ahalya, N. (2002). Status, conservation and management of wetlands. New Del
-
Ramachandra T V, Rajinikanth R and Ranjini V G, (2005), Economic valuation of wetlands, Journal of environment Biology, 26(2):439-447.
-
Ramachandra T V, (2009a), Conservation and management of urban wetlands: Strategies and challenges, ENVIS Technical Report: 32, Environmental Information System, Centre for Ecological Sciences, Bangalore.
-
Ramachandra T V, (2009b). Essentials in urban lake monitoring and management, CiSTUP Technical report 1, Urban Ecology, Environment and Policy Research, Centre for Infrastructure, Susatinable Transportation and Urban Planning, IISc, Bangalore
-
Ramachandra T.V., (2009c).Soil and Groundwater Pollution from Agricultural Activities, Commonwealth Of Learning, Canada and Indian Institute of Science, Bangalore, Printed by TERI Press, New Delhi.
-
Ramachandra T V and Uttam Kumar (2009), Land surface temperature with land cover dynamics: multi-resolution, spatio-temporal data analysis of Greater Bangalore, International Journal of Geoinformatics, 5 (3):43-53
-
Ramachandra T.V. and Shwetmala (2009), Emissions from India's Transport sector: State wise Synthesis, Atmospheric Environment, 43 (2009) 5510–5517.
-
Ramachandra T.V and Kumar U, (2008), Wetlands of Greater Bangalore, India: Automatic Delineation through Pattern Classifiers, The Greendisk Environmental Journal. Issue 26 (http://egj.lib.uidaho.edu/index.php/egj/article/view/3171).
-
Ramachandra T. V., Alakananda B, Ali Rani and Khan M A, (2011), Ecological and socio-economic assessment of Varthur wetland, Bengaluru (India), J Environ Science & Engg, Vol 53. No 1. p 101-108, January 2011
-
Ramachandra. T.V., Bharath H. Aithal and Uttam Kumar., (2012a). Conservation of Wetlands to Mitigate Urban Floods., Resources, Energy, and Development. 9(1), pp. 1-22.
-
Ramachandra. T.V., Bharath H. Aithal and Durgappa D. Sanna, (2012b). Insights to Urban Dynamics through Landscape Spatial Pattern Analysis., International Journal of Applied Earth Observation and Geoinformation, Vol. 18, Pp. 329-343.
|