VARTHUR-BELLANDUR-YAMALUR FIASCO
Status |
Contaminated water, sediment and air |
Cause |
- Encroachment of lakebed, flood plains, and lake itself;
- Loss in lake interconnectivity - Encroachment of rajakaluves / storm water drains and loss of interconnectivity;
- Lake reclamation for infrastructure activities;
- Topography alterations in lake catchment;
- Unauthorised dumping of municipal solid waste and building debris;
- Sustained inflow of untreated or partially treated sewage and industrial effluents;
- Removal of shoreline riparian vegetation; and unabated construction activities in the valley zone has threatened these urban wetlands.
- Pollution due to enhanced vehicular traffic;
- Too many para-state agencies and lack of co-ordination among them.
- Too many para-state agencies and too less governance
|
Solution |
- Good governance (too many para-state agencies and lack of co-ordination)
- Single agency with the statutory and financial autonomy to be the custodian of natural resources (ownership, regular maintenance and action against polluters (encroachers as well as those contaminate through untreated sewage and effluents, dumping of solid wastes)
- Digitation of land records (especially common lands – lakes, open spaces, parks, etc.) and availability of this geo-referenced data with query based information system to public.
- Removal of encroachment near to lakes after the survey based on reliable cadastral maps;
- Effective judicial system for speedy disposal of conflicts related to encroachment;
- Restriction of the entry of untreated sewage into lakes;
- To make land grabbing cognizable non-bail offence;
- Letting off only treated sewage into the lake (as in jakkur lake model);
- Regular removal of macrophytes in the lakes;
- Implementation of ‘polluter pays’ principle as per water act 1974;
- Plant native species of macrophytes in open spaces of lake catchment area;
- Stop solid wastes dumping into lakes
- Ensure proper fencing of lakes
- Restrictions on the diversion of lake for any other purposes;
- Complete ban on construction activities in the valley zones.
|
The restoration and conservation strategies has to be implemented for maintaining the ecological health of aquatic ecosystems, aquatic biodiversity in the region, inter-connectivity among lakes, preserve its physical integrity (shorelines, banks and bottom configurations) and water quality to support healthy riparian, aquatic and wetland ecosystems. The regular monitoring of water bodies and public awareness will help in developing appropriate conservation and management strategies. |
Varthur – Bellandur – Yamalur Fiasco
Lakes in Bangalore are interconnected and there are three valleys and Kormangala-Challaghatta-Bellandur-Varthur Valley is one among them (Figure 2.1). Varthur Lake series belongs to Kormangala-Challaghatta Valley consisting of Byappanahalli, Harlur, Kasavanahalli, Kaikondanahalli, Doddanakundi, Vibuthipura, Kundalahalli, Chinnappanahalli, Bellandur, Agara and Varthur Lakes.
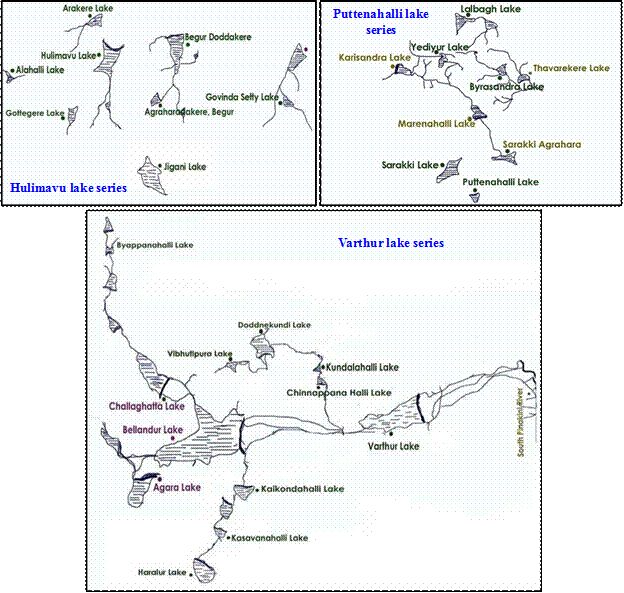
Figure 2.1: Lakes in Kormangala – Challaghatta Valley
(Source: http://parisaramahiti.kar.nic.in/vseries.html)
Varthur lake is the second largest lake in Bangalore. It is a part of a system of interconnected tanks and canals, i.e. three chain of lakes in the upstream joins Bellandur lake with a catchment area of about 148 square kilometres (14979 Hectares) and overflow of this lake gets into Varthur lake and from where it flows down the plateau and joins Pinakini river basin. Thus, Varthur lake receives all the surface runoff, wastewater and sewage from the Bangalore South taluk. The pollution levels had increased beyond the lake’s assimilative capacity. Thus, nutrient enrichment and profuse growth of macrophytes and algae occurs, which leads to reduced oxygen levels and threats the aquatic life. A decline in ecosystem goods and services was also evident that affects economic growth and livelihood of local people. Thus, Varthur lake series has to be restored in order to maintain and improve the quality of life of local residents of the Varthur lake area.
The water quality analysis show that Varthur is heavily polluted/enriched with nutrients with high organic load, increased decomposition of organic matter, depletion of oxygen levels and macrophytes cover. The overgrowth of algae, bacteria and macrophytes had lowered nitrate level as it is required for their growth as well as reproduction, but orthophosphate levels were very high. The nutrients accumulated in Varthur lake due to sewage entry to the lake water daily (~500 million liters per day, MLD). Foam generated from Varthur lake (at Varthur Kodi junction) and spilled over to a road adjacent to the lake, causing hindrance to traffic movement and emanating a foul smell. It is normally sticky and white in colour. The physico-chemical characteristics of foam samples (collected from V2) of Varthur lake (Kodi junction) revealed that the foam had higher concentrations of ionic as well as organic components. Foams were enriched with particulate organic and inorganic compounds such as nutrients (Nitrogen, Phosphorus and Carbon) and cations (Sodium, Potassium, Calcium and Magnesium). These foams will cause an environmental problem. Varthur lake water has been contaminating groundwater sources. The nutrient enrichment in Varthur lake is evident from the overgrowth of macrophytes (85%) dominated mainly by Eichhornia sp., Alternanthera sp., Typha sp., and Lemna sp. The algae of Varthur lake was categorized mainly into four groups like Chlorophyceae, Bacillariophyceae, Cyanophyceae and Euglenophyceae.
This series receives about 500 MLD (million liters per day) of untreated and partially treated sewage daily. Sustained inflow of untreated sewage (due to BWSSB) and effluents (from industries) has contaminated the lake as the inflow of pollutants has surpassed the lake’s assimilative capacity. Froth formation at outlets, profuse growth and spread of marcrophytes are all the indicators of nutrient enrichment. Nutrients in the form of N (nitrogen), carbon (C) and P (phosphorous) enters the lake through untreated sewage. Major part of N is up-taken by plants and algae while phosphorous and carbon gets trapped in sediments. Due to high wind coupled with high intensity of rainfall leads to upwelling of sediments with the churning of water as it travels from higher elevation to lower elevation forming froth due to phosphorous. Discharge of untreated effluents (rich in hydro carbon) with accidental fire (like throwing cigarettes, beedi) has led to the fire in the lake.
Rejuvenation of Bellandur -Varthur lake involves:
- De-silting: Due to sustained inflow of sewage and effluents, lake sediments are contaminated (with heavy metal, etc.). Needs de-silting and technological advancements allow wet dredging in a lake. Removal of accumulated silt will help in the storage of rain water and also recharging of ground water resources in the vicinity. This is essential as the groundwater table in the vicinity is as high as 1000-1500 feet.
- Treatment of wastewater through constructed wetlands and algal ponds (similar to Jakkur lake). Constructed wetlands with shallow algal ponds helps in the removal of nutrients
- Allowing only treated wastewater (sewage and effluents) to the lake.
- Re-establishing interconnectivity among lakes. Removal of all encroachments (of storm water drains and Raja Kaluves). Encroachments of storm water drains has led to stagnation of water and flooding in Yamalur region.
- Ban on alterations in the topography. Due to large scale land use changes and filling of low lying area, some of the new localities are now vulnerable to floods.
- Removal of all encroachments in the lake bed. We need to show mercy to our next generation (not to land grabbers) and evict all types of encroachers.
- Re-establishing wetlands at the inlets of these lakes. Bellandur lake on either side (inlet as well as at outlets) had large spatial extent wetlands, which have been and are being encroached by land mafia. These encroachments have to be evicted immediately to ensure the successful lake restoration and ensuring water security in the region.
- Maintaining 30 m buffer around the lake (with regulated activities)
- Stoppage of dumping of solid waste (and building debris in the lake bed and in the lake) and disposal of liquid waste by tankers.
- Constituting lake conservation committee consisting of all stakeholders for regular monitoring and management.
- Threshold on high raise building in the region. Need to protect valley zones considering ecological function and these regions are ‘NO DEVELOPMENT ZONES’ as per CDP 2005, 2015. No new projects in Bangalore unless carrying capacity assessment is done.
- Rejuvenation is meaningful only when all interconnected lakes in the series are restored otherwise Bellandur and Varthur lake will continue to face contamination due to polluted lakes in the upstream.
INTRODUCTION
Wetlands constitute a transitional zone between terrestrial and aquatic habitats, which are influenced to varying degrees by both terrestrial and aquatic habitats. They differ widely in character due to regional and local differences in climate, soils, topography, hydrology, water chemistry, vegetation, and other factors (Ramachandra and Rajinikanth, 2005). Wetlands supports large biological diversity and provide a wide range of ecosystem services, such as food and fibre; waste assimilation; water purification; flood mitigation; erosion control; groundwater recharge; microclimate regulation; support many significant recreational, social and cultural activities, besides being a part of our cultural heritage (Ramachandra, 2012). Lakes have vanished due to adhoc approaches in planning leading to intense urbanization and urban sprawl. Some lakes are reduced to small pools of water, some are unauthorized encroached for illegal buildings, some have undergone unauthorised encroachment by slums and private parties, some have dried up and are leased out by the Government, many are sewage fed and are also used as dumping yards for either municipal solid waste or building debris (Ramachandra, 2010). Lack of proper management strategies will eventually lead to loss of lakes around Bangalore and depletion of ground water resources (Shivakumar, 2008). The failure to restore these ecosystems will result in extinction of species or ecosystem types and cause permanent ecological damage (Ramachandra, 2008).
Greater Bangalore (77°37’19.54’’ E and 12°59’09.76’’ N) is the principal administrative, cultural, commercial, industrial, and knowledge capital of the state of Karnataka with an area of 741 square kilometers and lies between the latitudes 12°39’00’’ to 131°3’00’’N and longitude 77°22’00’’ to 77°52’00’’E. Bangalore is located at an altitude of 920 metres above mean sea level, delineating three watersheds: Hebbal, Koramangala - Challaghatta and Vrishabhavathi watersheds. The undulating terrain in the region has facilitated creation of a large number of tanks for traditional uses such as irrigation, drinking, fishing, and washing (Ramachandra and Kumar, 2008). Bangalore has grown spatially more than ten times since 1949 (~69 square kilometers to 741) and is the fifth largest metropolis in India. The rapid urbanization process in Bangalore has led to the drastic changes in land use leading to imbalance in biological and social environment. There has been a % growth in built-up area during the last four decades with the decline of vegetation by 66% and water bodies by 74% (Ramachandra et al., 2012). The population has increased accounting for 45.68% growth in a decade. (Ramachandra et al., 2013).
Varthur lake is located in the south of Bangalore District in Karnataka. This lake is the second largest freshwater body in Bangalore built by the Ganga Kings over a thousand years ago for domestic and agricultural purposes. It covers a water-spread area of 190 ha (mean depth 1.1 m). It is a part of a system of interconnected tanks (figure 2.1, table 2.1) and canals that receive all the surface runoff, wastewater and sewage from the Bangalore South taluk and finally drains into the Dakshina Pinakini River (Mahapatra et al., 2011). The lake provides the local community with a pleasant microclimate and considerable aesthetic appeal. Varthur lake is surrounded by small farms that grow rice, ragi, coconut, flowers, and a variety of fruits and vegetables using the lake water (Ramachandra et al., 2006).
Lakes should maintain the physical, chemical and biological integrity for the survival, growth and reproduction of aquatic as well as riparian communities (Ramachandra, 2005). Most of the sewage and wastewater generated is discharged directly into storm water drains that are ultimately linked to water bodies which have contaminated the surface and ground waters. The deterioration and degradation of lake water quality occurs due to inflow of untreated sewage, dumping of domestic and municipal solid waste, silt and nutrient accumulation that allow profuse growth of algae and aquatic plants leading to depletion of aquatic biodiversity and other anthropogenic activities (like encroachments etc.). These activities in the lake would lead to the extinction or permanent ecological damages, so proper restoration measures and conservation strategies should be taken immediately
Pollution of aquatic ecosystems causes a decline in ecosystem goods and services that affects economic growth and livelihood of local people (Ramachandra et al., 2011). Rapid development and population expansion within Bangalore and its surrounding towns and villages, have polluted tanks and lakes in the area. . The sewage brings in large quantities of C, N and P that enables massive algal and macrophyte (water hyacinth, covering about 85% lake area) growth and malodour generation (Mahapatra et al., 2011).
Table 2.1: Lakes in Varthur series and their area (Source: http://parisaramahiti.kar.nic.in/vseries.html)
Sl. No. |
Name of the Lake |
Area (Hectares) |
1 |
Byappanahalli Lake |
3.23 |
2 |
Haralur Lake |
5.16 |
3 |
Kasavanahalli Lake |
8.91 |
4 |
Kaikondanahalli Lake |
27.09 |
5 |
Doddanakundi Lake |
47.08 |
6 |
Vibhuthipura Lake |
30.20 |
7 |
Kundalahalli Lake |
10.48 |
8 |
Chinnappanahalli Lake |
56.80 |
9 |
Varthur Lake |
180.40 |
Foam from Varthur lake has spilled over to a road adjacent to the lake, causing hindrance to traffic movement on the busy road and a foul smell was emanating from it at Varthur Kodi junction on 29/04/2015, in the morning. Foams are formed in lakes due to sustained inflow of sewage (rich in phosphates). Decomposition of algae, fish and macrophytes, releasing a variety of organic compounds into the water body. These organic compounds act as surfactants (foaming agents) that has a hydrophilic (water attracting) end and hydrophobic hydrocarbon chain (water repelling) at the other end. Also, surface-active agents in wastewater include synthetic detergents, fats, oils, greases and biosurfactants. These agents rise to the surface of lakes and interact with water molecules thus, reducing the attraction of water molecules to each other (i.e. surface tension of the water). When the surface tension decreases, air mixes with the water molecules and foaming agents resulting in bubbles formation. These bubbles aggregate together and forms foam in lakes (figure 2.2). The foams formed in large quantities moves to shorelines by wind and water currents. Natural foams are usually linked to humic and fulvic acid substances, fine colloidal particles, lipids and proteins released from aquatic or terrestrial plants, saponins (plant glycosides), the decomposition products of phytoplankton containing carbohydrates and proteins and the organic matter in sediments (Schilling and Zessner, 2011).
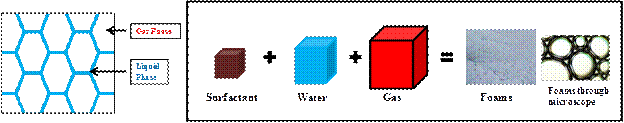
Figure 2.2: Structure and formation of foam in lakes
Foam accumulates compounds that are repelled by water (hydrophobic). Thus, foams are enriched with particulate organic and inorganic compounds such as nutrients (Nitrogen, Phosphorus, Carbon), cations (Sodium, Potassium, Calcium, Magnesium), heavy metals (Cadmium, Copper, Iron, Lead, Zinc) and chlorinated hydrocarbons. The organisms that inhabit the surface layer will be exposed to these contaminants and thus, affect the food web. These foams will cause an environmental problem, when it reaches drinking water supplies.
OBJECTIVE: The main objective of the study is to assess the present status of Varthur lake and to understand the causal factors of the foam emerging out of the lake and to suggest remedial measures for the protection of the lake.
MATERIALS AND METHODS
Study Area: Varthur lake (12°57 ′24.98″ to 12°56′31.24″ N, 77°43′03.02″ to 77°44′51.1″ E) is located in the Bangalore South taluk of the Bangalore District in Karnataka (figure 2.3). It covers a water-spread area of 190 ha and is the main irrigation source to the nearby agricultural fields and, supports a wide variety of flora and fauna. The average annual rainfall of Bangalore is 859 mm and temperatures vary from 14°C (December to January) to 33°C (maximum during March to May). There are two rainy periods, i.e. from June to September (south-west monsoon) and November to December (north-east monsoon).
Water Quality Analysis: The analysis of physico- chemical parameters like water temperature (WT); pH; total dissolved solids (TDS); electrical conductivity (EC); dissolved oxygen (DO); chemical oxygen demand (COD); total alkalinity (TA); chloride (Cl); total hardness (TH); calcium hardness (CaH); magnesium hardness (MgH); nitrate; orthophosphate (OP); sodium (Na) and potassium (K) of water and foam samples collected from Varthur lake were done according to the standard protocol (table 2.2; figure 2.4) as per APHA AWWA WEF (1998) and Trivedy Goel (1986).
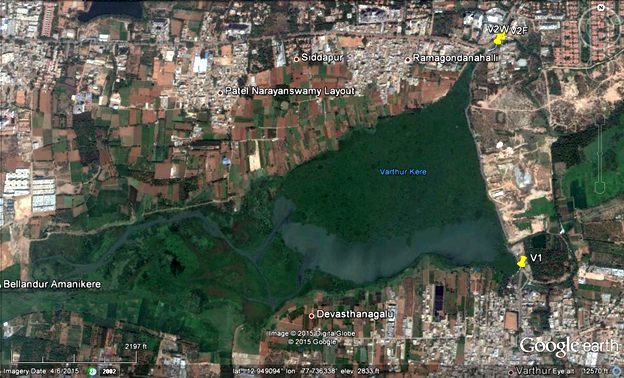
Figure 2.3: Google Earth image of Varthur lake
Table 2.2: Standard methods followed for water quality analysis
Parameters |
Methods (with Reference) |
Onsite Measurements |
Water temperature (0C) |
Eutech: PCSTestr 35 |
pH |
Eutech: PCSTestr 35 |
Total Dissolved Solids (TDS, mg/l) |
Eutech: PCSTestr 35 |
Electrical conductivity (µS/cm) |
Eutech: PCSTestr 35 |
Dissolved Oxygen (DO) (mg/l) |
Winkler’s Method (APHA, 1998: 4500-O) |
Laboratory Measurements |
Hardness (mg/l) |
EDTA titrimetric method (APHA, 1998: 2340-C) |
Calcium hardness (mg/l) |
EDTA titrimetric method (APHA, 1998: 3500-Ca B) |
Magnesium hardness (mg/l) |
Magnesium by calculation (APHA, 1998:3500-Mg) |
Sodium (mg/l) |
Flame emission photometric method (APHA, 1998:3500-Na B) |
Potassium (mg/l) |
Flame emission photometric method (APHA, 1998: 3500-K B) |
Alkalinity (mg/l) |
Titrimetric method (APHA, 1998: 2320 B) |
Chloride (mg/l) |
Argentometric method (APHA, 1998:4500-Cl- B) |
Biochemical Oxygen Demand (BOD) (mg/l) |
5-Day BOD test (APHA, 5210 B, Trivedi&Goel, 1986, pp.53-55) |
Chemical Oxygen Demand (COD) (mg/l) |
Closed reflux, titrimetric method (APHA, 5220 C, Trivedi&Goel, 1986, pp.55-57) |
Nitrates |
Phenol Disulphonic acid method (Trivedy and Goel, 1986: pp 61) |
Orthophosphates (mg/l) |
Stannous chloride method (APHA, 4500-P) |
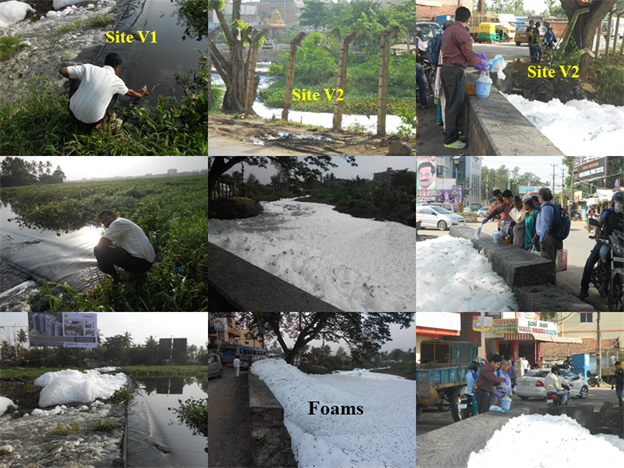
Figure 2.4: Collection of water and foam from Varthur South (V1) and North (V2) outlets.
RESULTS AND DISCUSSIONS
The physico-chemical parameters of water (collected from V1 and V2) and foam samples (from V2) of Varthur lake (table 2.3) revealed that the foam had higher concentrations of all the parameters compared to that of water. Thus, foams are enriched with particulate organic and inorganic compounds such as nutrients (Nitrogen, Phosphorus and Carbon), cations (Sodium, Potassium, Calcium and Magnesium). Foam generated is normally sticky and white in color. Most surfactants originate from the detergents, oil and grease that are used in households or industry. Surfactant could stabilize the foaming and allow foam to accumulate. The organisms living at the surface layer of lake will be exposed to these contaminants and thus, these contaminants enter the food chain/web. These foams will cause an environmental problem. The use of Varthur lake water for domestic and irrigational purposes will be harmful and this is likely to contaminate groundwater.
Table 2.3: Physico-chemical parameters of water and foam samples from Varthur lake (01/05/2015)
Parameters |
V1 |
V2 |
Foam |
Water temperature (0C) |
27.1 |
26.9 |
27.2 |
TDS (mg/l) |
448 |
454 |
7000 |
EC (µS) |
749 |
764 |
17000 |
pH |
7.46 |
7.35 |
6.98 |
DO (mg/l) |
2.6 |
0 |
- |
BOD (mg/l) |
24.39 |
60.98 |
650.41 |
COD (mg/l) |
40 |
88 |
1140 |
Alkalinity (mg/l) |
336 |
336 |
12000 |
Chloride (mg/l) |
117.86 |
122.12 |
3195 |
Total Hardness (mg/l) |
206 |
224 |
13000 |
Ca Hardness (mg/l) |
57.72 |
64.13 |
3607.2 |
Mg Hardness (mg/l) |
36.03 |
38.85 |
2282.45 |
Phosphate (mg/l) |
1.263 |
0.881 |
74.59 |
Nitrate (mg/l) |
0.541 |
0.361 |
129.72 |
Sodium |
169.5 |
161 |
770 |
Potassium |
35 |
34 |
230 |
REVIEW OF VARTHUR LAKE WATER QUALITY (from 2001 – 2015)
The physico-chemical characteristics of Varthur lake from 2001 to 2015 (table 2.4, 2.5; figure 2.5) revealed that Varthur lake had received higher amounts of nutrients and ionic components over years. The presence of higher amount of different physico-chemical parameters like total dissolved solids (332-1246 mg/l); electrical conductivity (460-1470 µS); dissolved oxygen (0-8.16 mg/l); chemical oxygen demand (40-325.33 mg/l); biochemical oxygen demand (24.39-140.8 mg/l); alkalinity (56-520 mg/l); chloride (88.04-191.7 mg/l); total hardness (198-436 mg/l); calcium hardness (56.11-344.27 mg/l); magnesium hardness (18.08-124 mg/l); sodium (9-1046 mg/l) and potassium (0-130 mg/l), indicate pollution/sewage entry into the lake as per CPCB standards (table 2.6).
Table 2.4: Physico-chemical parameters of Varthur lake at South outlet (V1)
|
2015 |
2014 |
2013 |
2013 |
2009 |
2008 |
2002 |
2001 |
2001 |
WT (0C) |
27.1 |
32 |
24 |
24.4 |
30 |
26.3 |
22 |
26 |
23 |
TDS (mg/l) |
448 |
596 |
500 |
532 |
749 |
840 |
1204 |
335 |
358 |
EC (µS) |
749 |
1027 |
1030 |
1084 |
1075 |
1057 |
1470 |
460 |
474 |
pH |
7.46 |
7.57 |
7.5 |
7.2 |
7.5 |
8.06 |
- |
8 |
- |
DO (mg/l) |
2.6 |
0.24 |
0 |
0 |
8.16 |
0.81 |
2.2 |
2.8 |
5.5 |
COD (mg/l) |
40 |
69.29 |
168 |
44 |
124 |
229.33 |
- |
- |
- |
TA (mg/l) |
336 |
520 |
317.33 |
377.33 |
400 |
300 |
- |
- |
348 |
Chloride (mg/l) |
117.86 |
176.79 |
132.06 |
142 |
173.24 |
88.04 |
170 |
- |
96 |
TH (mg/l) |
206 |
253 |
198 |
210 |
236 |
420 |
251.1 |
383.7 |
218.4 |
Ca H (mg/l) |
57.72 |
158.15 |
62.52 |
70.01 |
128 |
344.27 |
- |
- |
- |
Mg H (mg/l) |
36.03 |
23.05 |
32.92 |
34.02 |
26.24 |
102.4 |
- |
- |
- |
OP (mg/l) |
1.263 |
0.527 |
0.084 |
0.664 |
4.22 |
1.8 |
15.06 |
- |
1 |
Nitrate (mg/l) |
0.541 |
0.112 |
0.466 |
0.487 |
0.47 |
0.04 |
1.3 |
0.21 |
0.3 |
Na (mg/l) |
169.5 |
178 |
41.2 |
208 |
174 |
23.2 |
- |
1046 |
18.9 |
K (mg/l) |
35 |
35.6 |
5.6 |
43.6 |
19 |
4.3 |
1.8 |
115 |
21.4 |
BOD (mg/l) |
24.39 |
- |
- |
- |
119.5 |
40.78 |
74.2 |
- |
- |
Note: 2013 – twice sampling was done
Table 2.5: Physico-chemical parameters of Varthur lake at North outlet (V2)
|
2015 |
2013 |
2013 |
2011 |
2010 |
2010 |
2010 |
2010 |
2009 |
2008 |
2003 |
2003 |
2003 |
2002 |
2001 |
2001 |
WT (0C) |
26.9 |
24.4 |
25 |
- |
29.5 |
27.5 |
26.5 |
26 |
26 |
25.6 |
27 |
27 |
23 |
23 |
27 |
26 |
TDS (mg/l) |
454 |
489 |
532 |
- |
636 |
700 |
- |
- |
849 |
849 |
- |
- |
- |
1246 |
332 |
371 |
EC (µS) |
764 |
1014 |
1075 |
1054 |
798 |
890 |
- |
- |
1224 |
1068 |
460 |
474 |
1420 |
1420 |
460 |
474 |
pH |
7.35 |
7.7 |
7.2 |
7.61 |
7.84 |
7.58 |
8 |
8 |
7.5 |
9.03 |
7.61 |
7.55 |
7.68 |
- |
7.75 |
- |
DO (mg/l) |
0 |
0 |
0 |
1.56 |
4.07 |
7.15 |
1.63 |
4.06 |
0 |
4.22 |
2 |
3 |
2.9 |
2.9 |
2 |
3 |
COD (mg/l) |
88 |
184 |
52 |
98.2 |
192 |
298.67 |
- |
234.66 |
188 |
325.33 |
- |
- |
82.2 |
- |
- |
- |
TA (mg/l) |
336 |
308 |
372 |
- |
260 |
56 |
- |
120 |
420 |
420 |
- |
- |
- |
- |
- |
332 |
Cl (mg/l) |
122.12 |
130.64 |
142 |
- |
119.28 |
142 |
- |
142 |
191.7 |
144.84 |
- |
100 |
170 |
170 |
- |
100 |
TH (mg/l) |
224 |
198 |
214 |
- |
264 |
236 |
292 |
420 |
288 |
436 |
213.6 |
209.3 |
232.5 |
232.5 |
213.6 |
209.3 |
Ca H (mg/l) |
64.13 |
56.11 |
70.01 |
- |
132 |
112 |
200 |
188.17 |
135 |
176.14 |
132 |
124 |
158.1 |
- |
- |
- |
Mg H (mg/l) |
38.85 |
34.48 |
34.99 |
- |
85.39 |
124 |
92 |
48.76 |
37.18 |
106.38 |
19.83 |
20.73 |
18.08 |
- |
- |
- |
OP (mg/l) |
0.881 |
0.18 |
0.596 |
0.98 |
0.05 |
1.73 |
4.175 |
0.718 |
5 |
1.7 |
- |
1 |
15.54 |
1.5 |
- |
1 |
Nitrate (mg/l) |
0.361 |
0.418 |
0.364 |
0.3 |
0.03 |
0.28 |
0.162 |
0.24 |
0.55 |
0.04 |
- |
- |
- |
1.4 |
- |
1.07 |
Na (mg/l) |
161 |
48 |
202 |
- |
34.6 |
31.5 |
- |
18.93 |
180 |
19.4 |
- |
- |
- |
9 |
907 |
32.8 |
K (mg/l) |
34 |
12 |
43.2 |
- |
6.7 |
6.3 |
0 |
0 |
19 |
3.5 |
- |
- |
- |
2.2 |
130 |
20.2 |
BOD (mg/l) |
60.98 |
- |
- |
89.7 |
46.28 |
55.28 |
44.7 |
- |
140.8 |
41.68 |
- |
- |
74.2 |
74.2 |
- |
- |
Note: 2013 and 2001 – twice sampling was done, quarterly sampling in 2010 and 2003
Higher values of chemical parameters in Varthur lake is due to the sustained inflow of untreated daily (~500 million liters per day, MLD). The BOD and COD values reflected high pollution at Varthur with heavy organic load, decomposition of organic matter, depletion of oxygen levels and macrophytes cover. Water temperature (22-32°C) showed seasonal variations, while pH was found to be alkaline (7.2- 9.03). The nutrient like nitrate (0.03-1.4 mg/l) was lower in the system due to the uptake of nutrients by algae, bacteria and macrophytes for growth as well as reproduction. The orthophosphate (0.05-15.54 mg/l) levels were high.
Table 2.6: Classification of Inland Surface Water (CPCB)
As per ISI-IS: 2296-1982 |
Classification |
Type of use |
Class A |
Drinking water source without conventional treatment but after disinfection |
Class B |
Outdoor bathing |
Class C |
Drinking water source with conventional treatment followed by disinfection. |
Class D |
Fish culture and wild life propagation |
Class E |
Irrigation, industrial cooling or controlled waste disposal |
Characteristic |
A |
B |
C |
D |
E |
pH |
6.5 - 8.5 |
6.5 - 8.5 |
6.5 - 8.5 |
6.5 - 8.5 |
6.0 - 8.5 |
DO (mg/L) |
6 |
5 |
4 |
4 |
- |
BOD (mg/L) |
2 |
3 |
3 |
- |
- |
TDS, mg/l, Max |
500 |
- |
1500 |
- |
2100 |
Electrical Conductance at 25 °C, µS, Max |
- |
- |
- |
1000 |
2250 |
Total Hardness (as CaCO3), mg/l, Max |
300 |
- |
- |
- |
- |
Calcium Hardness (as CaCO3), mg/l, Max |
200 |
- |
- |
- |
- |
Magnesium Hardness (as CaCO3), mg/l, Max |
100 |
- |
- |
- |
- |
Chlorides (as Cl), mg/l, Max |
250 |
- |
600 |
- |
600 |
Nitrates (as NO2), mg/1, Max |
20 |
- |
50 |
- |
- |
The continuous entry of sewage water and rainwater runoff to Varthur lake had reduced the depth of the lake (due to sedimentation with silt transport from the catchment due to large scale construction activities), reduction of ground water recharge (sedimentation has formed semi-paved surface, reducing the groundwater recharge potential) and contamination of ground water (due to sustained inflow of untreated sewage from household and untreated effluents from industries). The solid waste dumping and discharge of municipal wastewater had caused nutrient enrichment in Varthur lake, which is evident from the overgrowth of macrophytes (85%) dominated mainly by Eichhornia sp., Alternanthera sp., Typha sp., and Lemna sp. The algae of Varthur lake was categorized mainly into 4 groups: Chlorophyceae (Chlamydomonas sp., Chlorogonium sp., Scenedesmus sp., Ankistrodesmus sp., Chlorella sp., Oedogonium sp.); Cyanophyceae (Cylindrospermopsis sp., Arthrospira sp., Microcystis sp., Oscillatoria sp., Anabaena sp., Merismopedia sp., Lyngbya sp.); Bacillariophyceae (Gomphonema sp., Cymbella sp., Navicula sp., Pinnularia sp., Nitzschia sp., Synedra sp., Fragilaria sp., Cocconeis sp., Melosira sp.); Euglenophyceae ( Phacus sp., Euglena sp., Trachelomonas sp., Lepocinclis sp.).
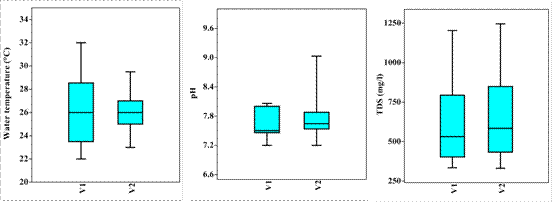
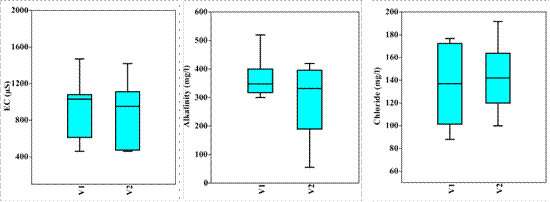
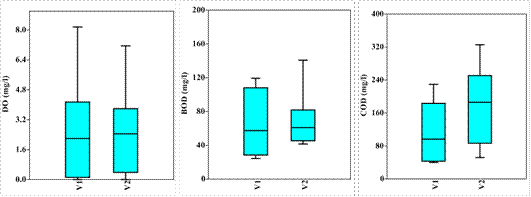
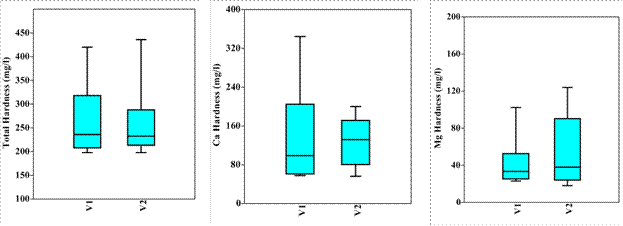
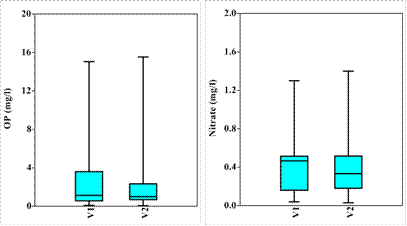
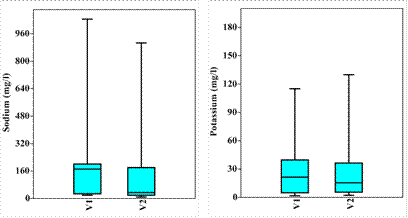
Figure 2.5: Temporal variation of physico-chemical parameters in Varthur lake water samples
(2001 to 2015).
WATER QUALITY AND PHYTOPLANKTON STUDIES ON VARTHUR LAKE
Table 2.7: Water quality studies on Varthur lake (2001 – 2013)
Influence of Catchment Land Cover Dynamics on the Physical, Chemical and Biological Integrity of Wetlands
LULC changes in the wetland catchment that alters the physical and chemical integrity of the system are the direct and indirect consequence of anthropogenic activities leading to loss of biodiversity, water and soil pollution and climatic changes. Varthur wetland with high percent of built-up and being densely populated is in stressed condition with high pollution due to inflow of sewage and industrial wastes. During the study, hypoxic and even anoxic condition prevailed due to low dissolved oxygen levels that attributed to the presence of water hyacinth covering the water surface, with heavy domestic organic load and decomposition of organic matter. Thus, the concentration of both BOD and COD exceeded the permissible limits at all sampling sites and across months. Total hardness (236-420 mg/l), alkalinity (55-440 mg/l) and chlorides (119.28-153.36 mg/l) were recorded very high due to sewage inflow. Thus, the plans for conservation of wetlands should be done at catchment scale.
Diatom community comprised of pollution tolerant species reflecting trophic status. Pollution tolerant diatoms dominated the wetlands with eutrophic water quality condition. The species such as Gomphonema parvulum, Cyclotella meneghiniana, Nitzschia palea and Nitzschia umbonata are tolerant to high electrolyte and organic rich condition inhabited Varthur wetland. This clearly signifies that the wetland is polluted and eutrophic in condition. Thus, catchment characteristics are critical in determining biota of freshwater bodies, thus plans for conservation of wetlands should also be seen at catchment scale, rather than looking wetlands as isolated ecosystem.
Recommendation: The restoration and conservation measures should be taken based on the LULC changes in the catchment area of wetlands.
Reference: Ramachandra T.V, Meera D.S. and Alakananda B., 2013, Influence of Catchment Land Cover Dynamics on the Physical, Chemical and Biological Integrity of Wetlands, Environment & We -International Journal of Science & Technology - (EWIJST), 8(1): 37-54.
|
Annexure 1
2013 |
Biomonitoring to Assess the Efficacy of Restoration and Management of Urban Water Bodies
The Varthur lake categorized under polluted wetlands was characterized by high ionic contents with high EC (1245.5 µS), BOD (34.27 mg/l) and COD (81.3 mg/l) but low DO levels (2.96 mg/l), indicating the presence of high organic matter. Varthur lake had about 91.7% of eutrophic algal species with a Shannon diversity of 1.28 and Dominance index of 0.37. The abundance of Cyclotella meneghiniana, Nitzschia palea, Fallacia pygmaea and Staurosirella pinnata were evident.
Reference: Alakananda B., Mahesh M.K and Ramachandra T.V., 2013, Biomonitoring to assess the efficacy of restoration and management of urban water bodies, International Journal of Environmental Sciences, Vol 2 (3), pp: 165-178. |
Annexure 2
2013 |
Role of Macrophytes in a Sewage Fed Urban Lake
Macrophytes help in maintaining the nutrient levels in urban lakes. The analysis of seasonal data of Varthur lake reveals that dissolved oxygen concentration and redox condition is dependent on the extent of macrophyte spread. The increase in nutrient content (32 t N/d) due to sustained inflow of sewage has resulted in the prolific growth of invasive species like water hyacinth (Eichhornia crassipes). This hinders aerobic functioning of the lake by restricting sunlight penetration and hence, reducing algal photosynthesis. This in turn, results in anoxic environment due to blockage of air-water interface, influencing oxygen diffusion. The roots of these floating macrophytes provide a good substratum for the attachment of bacteria, increasing bacterial activity in the system that leads to reduced DO levels. The increased amount of plant litter decomposition also contributes to higher autochthonous organic load and hence higher BOD levels. In Varthur lake (with 85% macrophytes cover), highly anaerobic conditions (-235 mV), low DO level (0 mg/l) and high BOD load (180 mg/l) persisted during summer. Varthur lake behaves as an aerobic lagoon in monsoon, aerobic-anaerobic lagoon in pre-monsoon and as anaerobic–aerobic system in post-monsoon. The overgrowth, ageing, and subsequent decay of macrophytes creates anoxic conditions and devours the lake from oxygen, which in turn, affects the food chain and interferes with the ecological integrity of the system. This necessitates the regular removal of macrophytes from the lake, which allows the growth of primary producers and other aquatic organisms.
Recommendation: Regular removal of macrophytes from the lake.
Reference: Durga Madhab Mahapatra, Chanakya H.N., Ramachandra. T.V., 2011, Role of macrophytes in a sewage fed urban lake. Institute of Integrative Omics and Applied Biotechnology Journal (IIOABJ), Vol. 2, Issue 8, pp. 1-9. |
Annexure 3
2011 |
Ecological and Socio-Economic Assessment of Varthur Wetland, Bengaluru (India)
The socio-economic survey and water quality analysis showed a decline of ecosystem goods and services with the decline in water quality affecting the livelihood of dependent population and local economy. Varthur had a total economic value of only Rs 118.9/ha/d, which is lower than unpolluted lakes. The main effects of pollutants entering Varthur lake are disappearance of native species, dominance of invasive exotic species (African catfish), in addition to profuse breeding of disease vectors and pathogens. This necessitates the implementation of sustainable management strategies to recover the lost wetland benefits or to enhance the use-value of Varthur lake. The strategies include restoration of wetlands, letting of treated sewage into the wetlands, letting treated water through series of wetlands for further improvement of water quality, removal of excess growth of macrophytes and exotic fish species, regular monitoring of wetlands, public awareness and enhanced co-operation among government agencies. Also, water treatment plant for Varthur wetland will improve the water quality and the massive sludge can be used for agricultural fields as fertilizers.
Reference: Ramachandra T. V., Alakananda B, Ali Rani and Khan M. A, 2011, Ecological and socio-economic assessment of Varthur wetland, Bengaluru (India), Journal of Environment Science & Engineering, Vol 53. No 1. p 101-108, January 2011. |
Annexure 4
2011 |
C:N Ratio of Sediments in a Sewage Fed Urban Lake
The analysis of C:N ratio of surficial sediments collected from Varthur lake was done as the sludge/sediments act as a major sink for C and N. The C and N values were found to be significantly higher in the deeper areas than the shallow inlet regions due to the accumulation of autochthonous organic material. About 60% of the nutrients were terrestrial in origin. The quantity of C and N stored on the sediments in a daily basis was large which accounts to 9 t C and 2.9 t N. The north side of the lake had higher C content compared to the other regions, which attributed to higher anthropogenic effects and terrestrial C sources like sewage from the urbanized pocket. A lower C value in the southern side is attributable to suburb type habitations with more agricultural fields in the immediate vicinity. The lake has a higher organic matter at the centre and near the outlets, due to rapid decay and settling of the autochthonous organic matter.
The N content was very low (below 5% of the dry wt.) in the sediment/sludge sample of Varthur lake, indicating an N deficient system. The N limitation is due to uptake by micro and macro-biota or rapid volatilization, denitrification and leaching in water. The organic N in the sediments will be transformed to various inorganic forms as nitrites, ammonia, nitrous oxide or molecular nitrogen. The source of organic matter (OM) in sediments of Varthur lake is essentially autochthonous macrophytes near the outlets and terrestrial N near the inlet zones, whereas the middle part OM is phycogenic in origin. The C/N ratios indicate that run-off water from the catchment can increase the terrestrial OM component. This lake surrounded by agricultural and horticultural lands (67%) can increase OM content. Therefore, proper wastewater management strategies have to be taken to minimize sewage inflow and prevent agricultural run-off into the lake systems.
Reference: Durga Madhab Mahapatra, Chanakya H. N. and T. V. Ramachandra, 2011, C:N ratio of Sediments in a sewage fed Urban Lake. International Journal of Geology, Issue 3, Vol. 5, pp. 86 - 92. |
Annexure 5
2011 |
Assessment of Treatment Capabilities of Varthur Lake, Bangalore, India
This study includes the physico-chemical and biological analysis of sewage-fed Varthur lake and assessment of its treatment capabilities in terms of BOD removal, nutrient assimilation and self-remediation. Varthur lake with an average water depth of 1.1m, water spread area of 220 ha, and receiving about 500 MLD of wastewater per day has a water retention time of 4.84d. Anaerobic conditions (0 mg/L) prevailed at the inlet but at the middle and outlets DO were higher due to algal photosynthetic activities. About >50% BOD removal was achieved in the monsoon season but the extensive coverage of macrophytes during February - May lowered the organic decomposition, and BOD removal. Alkalinity, TDS, conductivity and hardness values were higher than earlier studies due to continuous influx of untreated sewage.
The lake behaved as an anaerobic - aerobic lagoon. The primary producers (phytoplankton) treated the water to nearly standard water quality levels. The macrophytes and the algae together with wetland vegetation have an important role in regulating the amount of nutrients. The role of macrophytes and phytoplankton in removing nutrients in sewage-enriched systems varies with the nature of the effluent and age of the wetland, in addition to other environmental factors like sunlight.
Reference: Mahapatra, D.M., Chanakya, H.N. and Ramachandra, T.V. 2011, Assessment of Treatment capabilities of Varthur Lake, Bangalore, India. International Journal of Environment, Technology and Management, Vol. 14, Nos. 1/2/3/4, pp. 84-102. |
Annexure 6
2011 |
Biofuel Prospects of Microalgal Community in Urban Wetlands
Varthur lake showed moderate water quality. The class Bacillariophyta (diatoms) and Chlorophyta dominated at Varthur lake as well as agricultural sample with Achnanthidium sp., Gomphonema sp., Nitzschia sp., Navicula sp., Chlamydomonas sp., Scenedesmus sp. and Anabaena sp. accounting more in number (occurrence number in microscopic field). The Varthur lake and agriculture field samples had diatoms that are lipid-rich were suggested as an important source for biodiesel.
Reference: Ramachandra, T.V., Alakananda, B. and Supriya G., 2011, Biofuel prospects of microalgal community in urban wetlands. International Journal of Environmental Protection (IJEP), Vol.1 No. 2, PP.54-61. |
Annexure 7
2011 |
Algal Photosynthetic Dynamics in Urban Lakes Under Stress Conditions
Varthur lake is undergoing a high nutrient stress resulting in anaerobic conditions with prolonged sewage inflow. Thus, deprivation of oxygen (hypoxic conditions at the inflow region and 4.22 mg/l at the outlets of Varthur lake) is an indicator of the present trophic status of the lake, which is rich in inorganic and organic matter making the conditions increasingly eutrophied. The biochemical oxygen demand levels in Varthur lake (BOD level: 40.78 - 99.95 mg/l) indicate higher levels of biodegradable organic matter, high oxygen consumption by heterotrophic organisms and a high rate of organic matter remineralization. The phosphate content in Varthur lake (1.3-2.1 mg/l) was well beyond the eutrophic levels due the inflow of sewage, sediment resuspension during high turbulence period, anaerobic conditions at the lake bottom and agricultural runoff from the cultivated lands nearby. The nitrate content in Varthur (0.03 – 0.05 mg/l) was very low due to the growth of aquatic weeds, persistence of anaerobic conditions and scant oxidation. The Day net productivity values indicates lower productivities in Varthur lake which can be attributed to decreased transparency and hence, lesser sunlight penetration due to microalgal bloom (Chlorella sp.).
The productivity of the lake directly linked to the type and the abundance of the algal community. In Varthur lake, the algal community dominated by Chlorella sp. (member of Chlorophyceae) that comprised of C. vulgaris, C. pyrenoidosa and C.minutissima, followed by members of Bacillariophyceae (18%) as Nitzschia palea and Gomphonema parvulum. Microcystis aeruginosa (Cyanophyceae) occured in minor proportions (1%). The abundance of Chlorophyceae and Cyanophyceae members in Varthur lake is an indicator of organic pollution and nutrient accumulation. The turbidity values shows very high algal abundance in Varthur lake, which is attributing to algal bloom, coincides with the high inorganic nutrients and high BOD values. Chlorophyceae growth depends upon the nutrient load and is an indicator of trophic status of the lake.
Reference: Durga Madhab Mahapatra, Supriya Guruprasad, Chanakya H. N. and Ramachandra T. V., 2010, Algal Photosynthetic Dynamics in Urban Lakes under Stress Conditions. Proceedings of the Conference on Infrastructure, Sustainable Transportation and Urban Planning CiSTUP@CiSTUP 2010, 18th - 20th October 2010, CiSTUP, IISc, Bangalore. |
Annexure 8
2010 |
Status of Varthur Lake: Opportunities for Restoration and Sustainable Management
This study focuses on restoration aspects of Varthur lake based on hydrological, morphometric, physical-chemical and socio-economic aspects. The results of the water quality analysis showed that the lake is eutrophic with high concentrations of phosphorous and organic matter. The results of the morphometric analysis reveal that Varthur is a shallow lake, with a very large surface area in relation to its depth. The total area of the lake was estimated 1,478,000 m2. The bathymetric map of Varthur lake shows that the lake has an estimated maximum depth of approximately 2.0 meters with the mean depth of 1.05 m. The lake bottom exhibits a very gradual downward slope from west to east, with maximum observed depth occurring near the dam wall. The presence of bacterium Escherichia coli in Varthur indicates faecal contamination. The water quality analysis of groundwater revealed that the parameters (ammonia, chloride, electrical conductivity, fluoride, nitrate, and pH) were within the limits set by Indian Standards Specification for Drinking Water. The lake water has not contaminated the groundwater in the vicinity. The socio-economic aspects of Varthur lake showed that local residents relied heavily on the lake for cattle fodder and irrigation. The total land area irrigated using Varthur lake water was 622.27 hectares and the total number of farmers dependent on the lake water for irrigational purposes was1159. The crops grown in Varthur village include paddy, coconut, banana, beetle leaf, arecanut and floriculture. Thus, the lake has to be restored in order to maintain and improve the quality of life of local residents of the Varthur lake area.
Recommendations: Pollution impediment, harvesting of macrophytes, desiltation, rain water harvesting, watershed management and the adoption of restoration programmes with an ecosystem approach through Best Management Practices (BMPs) which will help in correcting point and non-point sources of pollution.
Reference: Ramachandra T .V., Ahalya N. and Payne, M., 2006, Status of Varthur Lake: Opportunities for Restoration and Sustainable Management. Technical Report: 102, Centre for Ecological Sciences, Bangalore. |
Annexure 9
2003 |
Conservation of Bellandur Wetlands: Obligation of Decision Makers to Ensure Intergenerational Equity
The Mixed Use Development Project - SEZ is proposed by Karnataka Industrial Areas Development Board (KIADB) along Sarjapur Road in a wetland between Bellandur and Agara Lake, with an area of 33 hectare. The proposal of the project is to construct residential areas, offices, and retail and hotel buildings in this area, which is contrary to sustainable development as the natural resources (lakes, wetlands) will be affected. This violates Hon’ble High Court of Karnataka’s verdict to protect, conserve, rehabilitate and wisely use lakes and their watersheds in Bangalore, all lakes in Karnataka and their canal networks, and also violates CDP 2015 as the valley zone is supposed to be protected as the region is “No Development Zone”. The SEZ will affect the ecological functioning, enhances flooding in the vicinity (due to encroachment of drains/rajakaluves; alterations in topography; encroachment of lakebed and encroachment of lake itself by dumping debris and land filling), traffic congestion due to additional vehicle movement (SEZ has a capacity of over 14000 Car units); enhances levels of vehicular pollutants that causes health problems (increase in respiratory diseases) and brings shortage in drinking water in Bangalore (SEZ requires 4587 Kilo Liters per day (4.58 MLD – Million liters per day)).
Reference: Ramachandra, T. V., Aithal, B. H., Vinay, S., and Lone, A. A., Conservation of Bellandur wetlands: Obligation of decision makers to ensure intergenerational equity. ENVIS Technical Report: 55, Environmental Information System, Centre for Ecological Sciences, Bangalore, 2013. |
Annexure 10
2013 |
DISCUSSIONS: The major problems faced by Varthur lake (table 2.8) are (i) encroachment, (ii) sustained inflow of untreated sewage and industrial effluents and (iii) dumping of municipal solid wastes and building debris.
Table 2.8: Threats to lakes and its effects
Sl.No |
Problems faced by lakes |
Effects on lakes |
1. |
Discharge of untreated domestic sewage and industrial effluents |
- Degradation of water quality
- Odour problems
- Dissolved oxygen depletion
- Nutrient accumulation
- Heavy metal contamination
- Over growth of algae and aquatic macrophytes
- Accumulation of silt and organic matter
- Reduction in depth of lake
- Contamination of ground water.
- Loss of aesthetic value
|
2. |
Encroachment of lake and construction activities in the lake catchment |
- Reduction of catchment area of lakes
- Reduction of ground water table as water recharge capacity goes down
- Increased discharge of domestic sewage
- Generation of building debris and solid wastes
- Soil erosion, sedminentation
- Cutting down of trees in that location
- Affects fauna population
- Loss of interconnectivity among lakes
|
3. |
Land use change |
- Reduction of catchment area
- Affected the hydrological regime
- Affected micro climatic conditions
|
4. |
Unplanned urbanization |
- Loss of wetlands and green spaces
- Increased frequency of floods
- Decline in groundwater table
- Heat island
- Increased carbon footprint
|
5. |
Threat to ecological balance |
- Aquatic biodiversity is affected (fish, birds, flora and fauna that are dependent on lake system)
|
6. |
Decline of Ecosystem goods and services |
- Affects economic growth and livelihood of local people
|
7. |
Removal of shoreline riparian vegetation |
- Causes soil erosion
- Effests the habitat of aquatic organisms
|
8. |
Dumping of municipal solid waste and building debris |
- Affects human health
- Breeding of disease vectors and pathogens
|
SOLUTIONS:
- Mapping of water body (identification of flood plain and buffer zone)
- Remove encroachments near to lakes after surveying the lake area
- Apply ‘polluter pays principle’ in true spirit - Restrict the entry of untreated sewage into lakes
- Let only treated sewage through constructed wetlands and shallow algae pond into the lake (as in Jakkur lake)
- Regular maintenance of floating macrophytes
- Planting of native species of macrophytes in open spaces of lake catchment area (for retaining water in the lake)
- Avoid dumping of solid wastes into lakes
- Ensure proper fencing of lakes
- Lake area cannot be diverted for any other purpose
- Make local residents environmentally literate
SUGGESTIONS
Table 2.9: Suggestions to be implemented in lakes
Desilting of lakes |
Silt has accumulated during last 50 years and with sustained inflow of sewage, the accumulated silt had contaminated which has to be removed on priority. Lake has become a shallow lake with a maximum depth of 2m.
Desilting of the lake was done by local people in mid 70’s. Removal of silt also helps in ground water recharge in the region as the accumulated silt in the lake over a period has become non-permeable, which had prevented the vertical and lateral flow of water.
Bangalore is facing a severe water crisis and removal of silt will help in harvesting of rain water efficiently. |
Letting only treated sewage into lake |
Model similar to Jakkur lake with constructed wetland and algal pond will help in removal of nutrients (Annexure 11). |
Restoration and treatment of lake in the entire basin |
Varthur lake, being located in the downstream of Agaram and Madivala lake series, will get rejuvenated only when the connected and interconnected lakes are restored and treated in similar way. |
Protection of riparian and buffer zone vegetation |
Any clearances of riparian vegetation and buffer zone vegetation (around lakes) have to be prohibited. |
Management of polluted lakes |
- The highly polluted lakes should be fenced off to prevent fishing, cattle grazing, washing, bathing and collection of edible or medicinal plants to prevent health hazards
- Warning boards should be displayed around water bodies
- Implementation of bioremediation method for detoxification of polluted water bodies
- Based on the concept of polluter pays, a mechanism be evolved to set up efficient effluent treatment plants [ETP], individual or collective, to reduce the pollution load
|
Environment Education |
- Public education and outreach should include all components of aquatic ecosystem restoration, management and conservation
- Lake associations and citizen monitoring groups have proved helpful in educating the general public
- Environmental education program should be more proactive, field oriented and experimental (with real time examples) for effective learning
- Environmental education should be made mandatory at all levels – schools, colleges, universities, professional courses, teachers and teacher educators at the teachers’ training institutes (Tch, B Ed, D Ed)
|
The important recommendations suggested through Lakshman Rau committee report, emphasizing the preservation and restoration of existing tanks in Bangalore in 1988 are applicable for Varthur lake also.
This includes:
- Efforts should be made to ensure that these tanks are not polluted by discharge of wastes.
- Off shore development by large scale planting of trees and also removal of encroachments to prevent silting
- Existing tanks should be deweeded and aquatic life must be developed
- The Bangalore Development Authority / Bangalore City Corporation / Minor Irrigation Department must remove encroachments in the tank areas
- The Forest Department, Bangalore Development Authority, Bruhat Bengaluru Mahanagara Palike, Minor Irrigation Department, Bangalore Water Supply and Sewerage Board, and Town Planning Department should play an active role in the implementation of recommendations and these recommendations should be reviewed periodically
- Mosquito control measures are to be entrusted to BBMP or any other suitable agency
- The responsibility of maintenance of water bodies in a clean and safe condition should be with Bangalore Water Supply and Sewerage Board
The aquatic conservation strategy (Ramachandra et al., 2005) focuses on conservation and maintainence of ecological health of aquatic ecosystems so as to maintain the aquatic biodiversity in the region, maintain inter-connectivity among lakes, preserve its physical integrity (shorelines, banks and bottom configurations) and water quality to support healthy riparian, aquatic and wetland ecosystems. The regular monitoring of waterbodies involving students at school, college and research institutions, and also public awareness will help in developing appropriate conservation and management strategies.
REFERENCES
-
Alakananda, B., Mahesh, M. K., and Ramachandra, T. V., 2013, Biomonitoring to assess the efficacy of restoration and management of urban water bodies. International Journal of Environmental Sciences, Vol 2(3), pp: 165-178.
-
APHA, Standard Methods (20 Ed.) for the examination of water and waste water, APHA, AWWA, WPCE, Washington DC, 1998.
-
Mahapatra, D. M., Chanakya, H. N., and Ramachandra, T. V., 2011, C:N ratio of sediments in a sewage fed urban lake. International Journal of Geology, Vol. 5(3), pp. 86 - 92.
-
Mahapatra, D. M., Chanakya, H. N., and Ramachandra, T. V., 2011, Role of macrophytes in a sewage fed urban lake. Institute of Integrative Omics and Applied Biotechnology Journal (IIOABJ), Vol. 2(8), pp. 1-9.
-
Mahapatra, D. M., Chanakya, H. N., and Ramachandra, T. V., 2011, Assessment of treatment capabilities of Varthur Lake, Bangalore, India. International Journal of Environmental Technology and Management, Vol. 14, pp. 84-102.
-
Mahapatra, D. M., Supriya, G., Chanakya, H. N., and Ramachandra, T. V., 2010, Algal photosynthetic dynamics in urban lakes under stress conditions. Proceedings of the Conference on Infrastructure, Sustainable Transportation and Urban Planning CiSTUP@CiSTUP 2010. 18th - 20th October 2010, CiSTUP, IISc, Bangalore.
-
Ramachandra, T. V., 2012, Conservation and Management of Wetlands: Requisite Strategies. LAKE 2012:National Conference on Conservation and Management of Wetland Ecosystems.
-
Ramachandra, T. V., Conservation and management of urban wetlands: Strategies and challenges, ENVIS Technical Report: 32, Environmental Information System, Centre for Ecological Sciences, Bangalore, 2009.
-
Ramachandra, T. V., Conservation, restoration and management of aquatic ecosystems, In Aquatic Ecosystems - Conservation, Restoration and Management, Ramachandra, Ahalya N. and Rajasekara Murthy (ed.), Capital Publishing Company, New Delhi, 2005.
-
Ramachandra, T. V., Ahalya N., and Payne, M., Status of Varthur Lake: opportunities for restoration and sustainable management. Technical report 102, Centre for Ecological Sciences, Indian Institute of Science, Bangalore, 2003.
-
Ramachandra, T. V., Aithal, B. H., and Durgappa, D. S., 2012, Insights to urban dynamics through landscape spatial pattern analysis. International Journal of Applied Earth Observation and Geoinformation, Vol.18, pp. 329-343.
-
Ramachandra, T. V., Aithal, B. H., and Kumar, U., 2012, Conservation of wetlands to mitigate urban floods. Resources, Energy, and Development. Vol. 9(1), pp. 1-22.
-
Ramachandra, T. V., Aithal, B. H., Vinay, S., Setturu, B., Asulabha, K. S., Sincy, V., and Bhat, S. P., Vanishing lakes interconnectivity and violations in valley zone: Lack of co-ordination among para-state agencies, ENVIS Technical Report 85, CES, Indian Institute of Science, Bangalore, 2015.
-
Ramachandra, T. V., Aithal, B. H., Vinay, S., and Lone, A. A., Conservation of Bellandur wetlands: Obligation of decision makers to ensure intergenerational equity. ENVIS Technical Report: 55, Environmental Information System, Centre for Ecological Sciences, Bangalore, 2013.
-
Ramachandra, T. V., Alakananda, B., Ali Rani and Khan, M. A., 2011, Ecological and socio-economic assessment of Varthur wetland, Bengaluru (India). Journal of Environmental Science and Engineering, Vol. 53(1), pp. 101-108.
-
Ramachandra, T. V., Alakananda, B., and Supriya, G., 2011, Biofuel prospects of microalgal community in urban wetlands. International Journal of Environmental Protection (IJEP), Vol.1(2), pp. 54-61.
-
Ramachandra, T. V., and Ahalya, N., Essentials of Limnology and Geographical Information System (GIS). Energy and Wetlands Research Group, Center for Ecological Sciences, Indian Institute of Science, Bangalore, 2001.
-
Ramachandra, T. V., and Kumar, U., 2008, Wetlands of Greater Bangalore, India: Automatic delineation through pattern classifiers, The Greendisk Environmental Journal. Issue 26 (http://egj.lib.uidaho.edu/index.php/egj/article/view/3171).
-
Ramachandra, T. V., Mahapatra, D. M., Bhat, S. P., Asulabha, K. S., Sincy, V., and Aithal, B. H., Integrated wetlands ecosystem: Sustainable model to mitigate water crisis in Bangalore. ENVIS Technical Report 76, Environmental Information System, CES, Indian Institute of Science, Bangalore, 2014.
-
Ramachandra, T. V, Meera, D. S., and Alakananda, B., 2013, Influence of catchment land cover dynamics on the physical, chemical and biological integrity of wetlands. Environment and We -International Journal of Science and Technology - (EWIJST), Vol. 8(1), pp. 37-54.
-
Ramachandra, T. V., and Rajinikanth, R., 2005, Economic valuation of wetlands. Journal of Environmental Biology, Vol. 26(3), pp. 439-447.
-
Rau, L., 1988, Report of the expert committee for preservation, restoration or otherwise of the existing tanks in Bangalore metropolitan area.
-
Schilling, K., and Zessner, M., 2011, Foam in the aquatic environment, Water Research, Vol. 45, pp. 4355 – 4366.
-
Shivakumar, K. V., 2008, Water quality monitoring of lakes in Bangalore-Laborattory Central Laborattory KSPCB. Proceedings of Taal 2007: The 12th World Lake Conference, pp. 1908 – 1915.
-
Trivedi, R. K., and Goel, P. K., Chemical and biological methods for water pollution studies. Published by Environmental Publications, Post Box 60, Karad, 1986.
-
http://esrd.alberta.ca/water/programs-and-services/surface-water-quality-program/documents/FoamSurfaceWaters
-
http://nhlakes.mylaketown.com/uploads/tinymce/nhlakes/NewsArticles/LakeConcerns/5-3 Lake Foam
-
http://www.deccanchronicle.com/150430/nation-current-affairs/article/filthy-foam-varthur-lake-spills-bengaluru-road
-
http://www.in.gov/idem/files/wqsurvey_025surfacefoam
-
http://parisaramahiti.kar.nic.in/vseries.html
http://wgbis.ces.iisc.ac.in/energy/water/paper/researchpaper2.html |