Water Sustainability
Water balance assessment carried out is depicted in figure 7.1, in order to understand the water availability and capability of catering current domestic demands catchment wise for Bangalore.
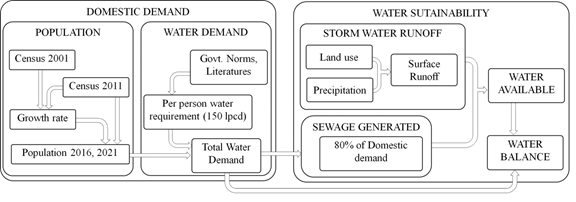
Figure 7.1: Method involved in water balance assessment
Domestic water demand is about 20.05 TMC (Section 6). Water availability in the catchments and sub catchments in Bangalore is quantified based on the rainfall yield, (Section 5) and by quantifying sewage generated. Sewage generated at ward level and at watershed level was quantified as 80% of the total water demand, is depicted in Figure 7.2. Total water demand in the catchment is about 20.05 TMC and sewage generated is 16.04 TMC (1258 MLD). Cumulative sewage generated is quantified at select points is depicted in Figure 7.3. Sewage generated across the major valleys shows that Vrishabhavathi valley catchment generates sewage of 522 MLD (41.5%), followed by Koramangala and Challaghatta valley of 410 MLD (32.6%), Hebbal Nagavara valley of 242 (18.8%) and the remaining 84 MLD (7.1%) is in Arkavathi and Suvarnamukhi valleys.
On an average 1.67 TMC of water is required every month for domestic purposes and about 1.34 TMC could be met just by treating sewage. Sewage treatment with complete removal of nutrients and chemical contaminants happens by adopting decentralized treatment plants similar to the success model (secondary treatment plant integrated with constructed wetlands and algae pond) at Jakkur Lake. In addition to this, water available with efficient rainwater harvesting is about 14.8 TMC. This means that total of 30.85 TMC of water is available annually to cater the demand of 20.08 TMC, provided the city administration opts for decentralized optimal water management through (i) rainwater harvesting by rejuvenating lakes. The best option to harvest rain water is through interconnected lake systems that exists in Bangalore, (ii) treatment of sewage generated in households in each locality (opting the model at Jakkur lake – STP (Sewage Treatment Plant) integrated with constructed wetlands and algal pond; (iii) conservation of water by minimizing the pilferages (due to faulty distribution system); (iv) ensuring water supply 24x7 and (v) ensuring all sections of the society get equal quantity and quality of water. Rejuvenating lakes in the region helps in retaining the rain water. Treating sewage and options to recycle and reuse would minimize the demand for water from outside the region. Figures 7.4 to 7.7 and Tables 7.1 to 7.4 depicts the city and catchment wise sewage generated and domestic water demands. The analysis shows that the city has at least 30 TMC (Bangalore city) of water higher than the existing demand if the city adopts 5R’s (Retain, Rejuvenate, Recycle, Reuse, Retain and Responsible citizens).
Table 7.1: Water balance assessment for Bangalore city
Month |
Rainfall (mm) |
Rainfall TMC |
Runoff (TMC) |
Sewage Water (TMC) |
Water Available (TMC) |
Domestic Demand (TMC) |
Difference (available – demand) |
Water Availability to Demand Ratio |
Water Balance |
May |
93 |
2.5 |
2.0 |
1.36 |
3.35 |
1.70 |
1.63 |
1.97 |
1.63 |
June |
62 |
1.6 |
1.3 |
1.32 |
2.65 |
1.65 |
0.98 |
1.60 |
2.61 |
July |
81 |
2.1 |
1.7 |
1.36 |
3.09 |
1.70 |
1.37 |
1.82 |
3.99 |
August |
104 |
2.8 |
2.2 |
1.36 |
3.59 |
1.70 |
1.88 |
2.11 |
5.87 |
September |
153 |
4.1 |
3.3 |
1.32 |
4.60 |
1.65 |
2.94 |
2.79 |
8.81 |
October |
152 |
4.0 |
3.2 |
1.36 |
4.61 |
1.70 |
2.90 |
2.71 |
11.71 |
November |
47 |
1.2 |
1.0 |
1.32 |
2.32 |
1.65 |
0.65 |
1.41 |
12.36 |
December |
17 |
0.4 |
0.0 |
1.36 |
1.36 |
1.70 |
-0.36 |
0.80 |
12.00 |
January |
9 |
0.2 |
0.0 |
1.36 |
1.36 |
1.70 |
-0.36 |
0.80 |
11.64 |
February |
28 |
0.8 |
0.0 |
1.23 |
1.23 |
1.54 |
-0.32 |
0.80 |
11.32 |
March |
20 |
0.5 |
0.0 |
1.36 |
1.36 |
1.70 |
-0.36 |
0.80 |
10.96 |
April |
38 |
1.0 |
0.0 |
1.32 |
1.32 |
1.65 |
-0.34 |
0.80 |
10.62 |
Annual |
804 |
21.29 |
14.80 |
16.04 |
30.85 |
20.05 |
10.62 |
|
|
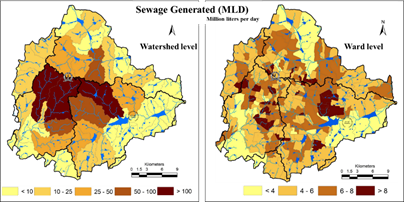
Figure 7.2: Domestic sewage generated
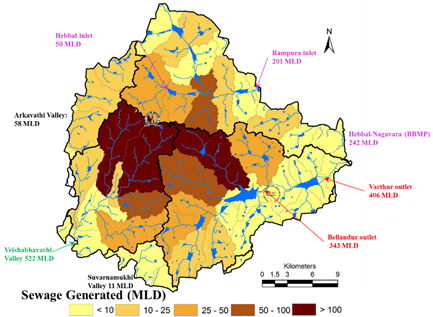
Figure 7.3: Domestic sewage generated – valley wise in Bangalore
Figure 7.4: Water balance in Bangalore city (BBMP)
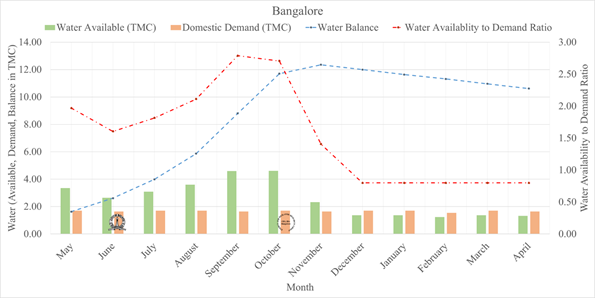
Table 7.2: Water balance assessment for KC valley
Month |
Rainfall (mm) |
Rainfall TMC |
Runoff (TMC) |
Sewage Water (TMC) |
Water Available (TMC) |
Domestic Demand (TMC) |
Difference (Available – Demand) |
Water Availability to Demand Ratio |
Water Balance |
May |
87 |
0.80 |
0.68 |
0.57 |
1.25 |
0.71 |
0.54 |
1.75 |
0.54 |
June |
58 |
0.53 |
0.45 |
0.55 |
1.00 |
0.69 |
0.31 |
1.45 |
0.85 |
July |
79 |
0.73 |
0.62 |
0.57 |
1.19 |
0.71 |
0.48 |
1.67 |
1.32 |
August |
98 |
0.89 |
0.76 |
0.57 |
1.33 |
0.71 |
0.62 |
1.87 |
1.94 |
September |
142 |
1.30 |
1.11 |
0.55 |
1.66 |
0.69 |
0.97 |
2.41 |
2.91 |
October |
158 |
1.45 |
1.23 |
0.57 |
1.80 |
0.71 |
1.09 |
2.53 |
4.00 |
November |
47 |
0.43 |
0.36 |
0.55 |
0.92 |
0.69 |
0.23 |
1.33 |
4.22 |
December |
12 |
0.11 |
0.00 |
0.57 |
0.57 |
0.71 |
-0.14 |
0.80 |
4.08 |
January |
8 |
0.08 |
0.00 |
0.57 |
0.57 |
0.71 |
-0.14 |
0.80 |
3.94 |
February |
33 |
0.30 |
0.00 |
0.51 |
0.51 |
0.64 |
-0.13 |
0.80 |
3.81 |
March |
18 |
0.17 |
0.00 |
0.57 |
0.57 |
0.71 |
-0.14 |
0.80 |
3.67 |
April |
38 |
0.35 |
0.00 |
0.55 |
0.55 |
0.69 |
-0.14 |
0.80 |
3.53 |
Annual |
778.78 |
7.12 |
5.20 |
6.70 |
11.91 |
8.38 |
3.53 |
|
|
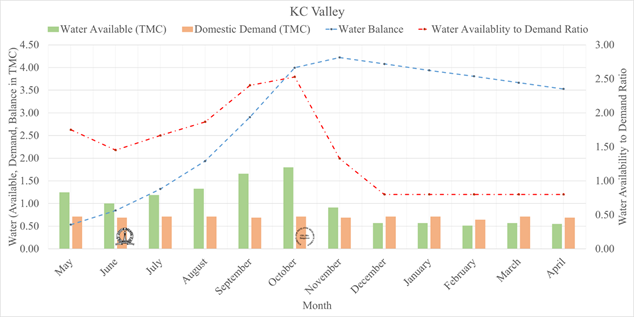
Figure 7.5: Water balance in KC valley
Table 7.3: Water balance assessment for Vrishabhavathi valley
Month |
Rainfall (mm) |
Rainfall TMC |
Runoff (TMC) |
Sewage Water (TMC) |
Water Available (TMC) |
Domestic Demand (TMC) |
Difference (Available – Demand) |
Water Availability to Demand Ratio |
Water Balance |
May |
100 |
0.86 |
0.74 |
0.64 |
1.37 |
0.80 |
0.58 |
1.72 |
0.58 |
June |
66 |
0.58 |
0.49 |
0.62 |
1.11 |
0.77 |
0.34 |
1.44 |
0.91 |
July |
84 |
0.73 |
0.62 |
0.64 |
1.26 |
0.80 |
0.46 |
1.58 |
1.37 |
August |
118 |
1.03 |
0.87 |
0.64 |
1.51 |
0.80 |
0.71 |
1.90 |
2.08 |
September |
173 |
1.51 |
1.28 |
0.62 |
1.90 |
0.77 |
1.13 |
2.46 |
3.21 |
October |
148 |
1.29 |
1.09 |
0.64 |
1.73 |
0.80 |
0.93 |
2.17 |
4.14 |
November |
43 |
0.38 |
0.32 |
0.62 |
0.94 |
0.77 |
0.17 |
1.22 |
4.31 |
December |
22 |
0.19 |
0.00 |
0.64 |
0.64 |
0.80 |
-0.16 |
0.80 |
4.15 |
January |
9 |
0.07 |
0.00 |
0.64 |
0.64 |
0.80 |
-0.16 |
0.80 |
3.99 |
February |
19 |
0.17 |
0.00 |
0.58 |
0.58 |
0.72 |
-0.14 |
0.80 |
3.85 |
March |
21 |
0.18 |
0.00 |
0.64 |
0.64 |
0.80 |
-0.16 |
0.80 |
3.69 |
April |
40 |
0.34 |
0.00 |
0.62 |
0.62 |
0.77 |
-0.15 |
0.80 |
3.54 |
Annual |
843.38 |
7.32 |
5.41 |
7.50 |
12.90 |
9.37 |
3.54 |
|
|
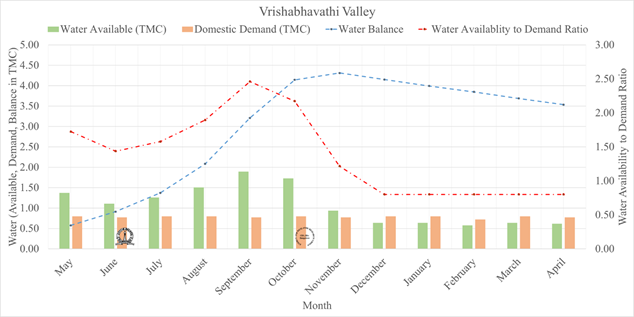
Figure 7.6: Water balance in Vrishabhavathi valley
Table 7.4: Water balance assessment for Hebbal valley
Month |
Rainfall (mm) |
Rainfall TMC |
Runoff (TMC) |
Sewage Water (TMC) |
Water Available (TMC) |
Domestic Demand (TMC) |
Difference (Available – Demand) |
Water Availability to Demand Ratio |
Water Balance |
May |
93 |
0.68 |
0.58 |
0.22 |
0.80 |
0.27 |
0.52 |
2.90 |
0.52 |
June |
62 |
0.45 |
0.39 |
0.21 |
0.60 |
0.27 |
0.33 |
2.25 |
0.86 |
July |
79 |
0.58 |
0.49 |
0.22 |
0.71 |
0.27 |
0.44 |
2.60 |
1.29 |
August |
97 |
0.71 |
0.61 |
0.22 |
0.83 |
0.27 |
0.55 |
3.01 |
1.85 |
September |
144 |
1.06 |
0.90 |
0.21 |
1.11 |
0.27 |
0.85 |
4.18 |
2.69 |
October |
149 |
1.09 |
0.93 |
0.22 |
1.15 |
0.27 |
0.88 |
4.19 |
3.57 |
November |
50 |
0.36 |
0.31 |
0.21 |
0.52 |
0.27 |
0.26 |
1.97 |
3.82 |
December |
17 |
0.12 |
0.00 |
0.22 |
0.22 |
0.27 |
-0.05 |
0.80 |
3.77 |
January |
9 |
0.07 |
0.00 |
0.22 |
0.22 |
0.27 |
-0.05 |
0.80 |
3.71 |
February |
33 |
0.24 |
0.00 |
0.20 |
0.20 |
0.25 |
-0.05 |
0.80 |
3.66 |
March |
21 |
0.15 |
0.00 |
0.22 |
0.22 |
0.27 |
-0.05 |
0.80 |
3.61 |
April |
36 |
0.26 |
0.00 |
0.21 |
0.21 |
0.27 |
-0.05 |
0.80 |
3.56 |
Annual |
791.12 |
5.79 |
4.20 |
2.59 |
6.79 |
3.23 |
3.56 |
|
|
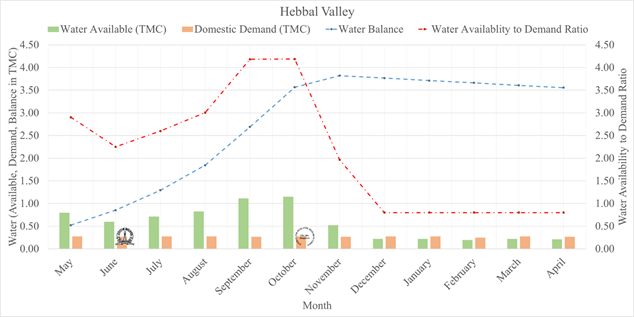
Figure 7.7: Water balance in Hebbal valley