Land Use Land Cover [LULC] Dynamics
3.1 LAND USE CHANGES
Land use Land cover (LULC) dynamics alters the landscape structure, which affects the functional abilities. Landscape is heterogeneous land area of interacting systems which forms an interconnected system called ecosystem. The functional aspects (interaction of spatial elements, cycling of water and nutrients, bio-geo-chemical cycles) of an ecosystem depends on its structure (size, shape, and configuration) and constituent’s spatial patterns (linear, regular, aggregated). Deforestation and loss of green cover and water bodies is a major concern, as the abrupt changes impact ecology, micro climate, hydrological regime, ecological flow, and also people’s livelihood. LULC dynamics may vary from region to region. Land Cover (LC) refers to the observed physical cover on the earth’s surface. Land cover essentially distinguishes the region under vegetation with that of non-vegetation. Land Use (LU) refers to use of the land surface through modifications by humans and natural phenomena. Land use can be classified into various classes such as water bodies, built up, forests, agriculture, open lands, sand, soil, etc. Land use land cover information of a region provides a base for accounting the natural resources availability and its utilization. Land use land cover information of a region provides a base for accounting the natural resources availability and its utilization. Land use modifications alter the structure of the landscape and hence the functional ability of the landscape. Advance visualisation and simulation of likely LULC changes would help in evolving sustainable natural resources management strategies. The status of a Land use land cover can be visualized, simulated for future changes using the earlier trends of LULC dynamics. Figure 3.1 outlines the method adopted to derive land use information using temporal spatial data acquired through space borne sensors.
3.1.1 LAND USE
This involves understanding the land use by processing spatial data (remote sensing data) and Geo-informatics (GIS). Land use analysis involves acquisition of spatial data and generation of false colour composite (FCC) of 3 bands (Green, Red and NIR). Creation of FCC directly helps in identifying heterogeneous patches in the landscape (Ramachandra et al., 2014). Training polygons are digitized based on the distinguishable heterogeneous features in FCC, covering at least 15% and uniformly distributed across the entire study area. These polygons and its coordinates are entered into GPS and attribute information is compiled with respect to corresponding land use type (ground truth data). Training polygons were supplemented with the data available at Google earth (https://www.google.com/earth) for classification. 60% of these training polygons were used for classification purpose while the rest 40% for validation and accuracy assessment. Supervised Gaussian maximum likelihood classification (GMLC) was employed to assess quantitatively land uses in the region. GMLC algorithm considers cost functions as well as probability density functions and proved to be efficient among other classifiers. It evaluates both variance and co-variance of the category while classifying an unknown pixel. Land use classification was done with the help of open source software GRASS (http://ces.iisc.ac.in/grass).
Additional collateral data for spatial data rectification and classification were collected (i) through field visits using handheld pre-calibrated GPS (Global Positioning System) (ii) the Survey of India topographic maps (1: 25000, 1:50000 and 1:250000), (iii) online data portals (Google earth, http://earth.google.com; Bhuvan, http://bhuvan.nrsc.gov.in), etc. Satellite Data for the period 1973 to 2016 were acquired from the United States Geological Survey’s public domain (http://earthexplorer.usgs.gov/), National Remote Sensing Centre Hyderabad (http://nrsc.gov.in). Preprocessing of spatial data involved geo-referencing of data, done with the help of known location points (compiled from the Survey of India topographic maps and also from field using pre-calibrated GPS – Global Positioning System). Remote sensing data were cropped corresponding to study regions. Co-ordinates of known locations such as road intersections, edges of huge permanent structures, etc. were compiled using GPS and online high resolution data (Google Earth). Further, resampling was performed to maintain the spatial resolution uniformity across temporal remote sensing data.
3.1.2 MODELING
Various factors and constraints (agents) of growth such as water bodies, City Development Plans (CDP; approved policy document), Defence Lands, Slope, Proximity to roads, industries, educational institutions, bus, railway and metro stations, socio economic structures etc. were considered for the analysis. Fuzzy logic was used to normalise the factors and binary algorithm was used to define constraints. Based on expert systems multi criteria evaluation, weightages were derived for each factor of growth. The site suitability maps are derived using the weightages, factors and constraints.
Markov chains were used to understand the transition probability between two time frames i.e., probability changes between 2012 and 2016 is used to project for the year 2020. The Markov chains are statistical and don’t take into account spatial context. In order to understand spatial context of landscape changes, Cellular Automata was used with inputs from Markov chains and the site suitability maps.
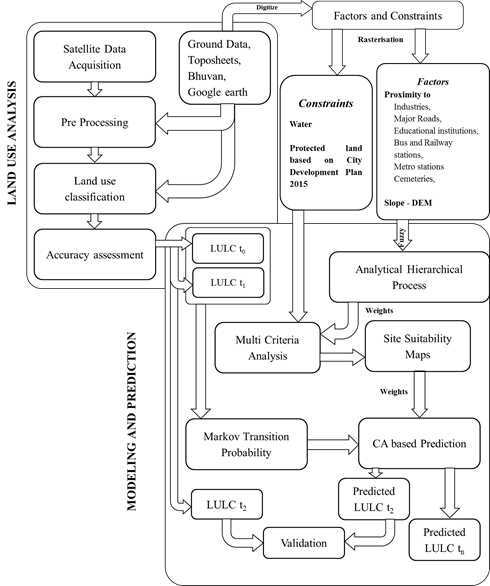
Figure 3.1: Method involved in understanding landscape dynamics
3.2 RESULTS OF LAND USE ANALYSIS AND MODELING
Figure 3.2 and Table 3.1 depicts the land use changes between 1973 and 2016, with projected land use for the year 2020.
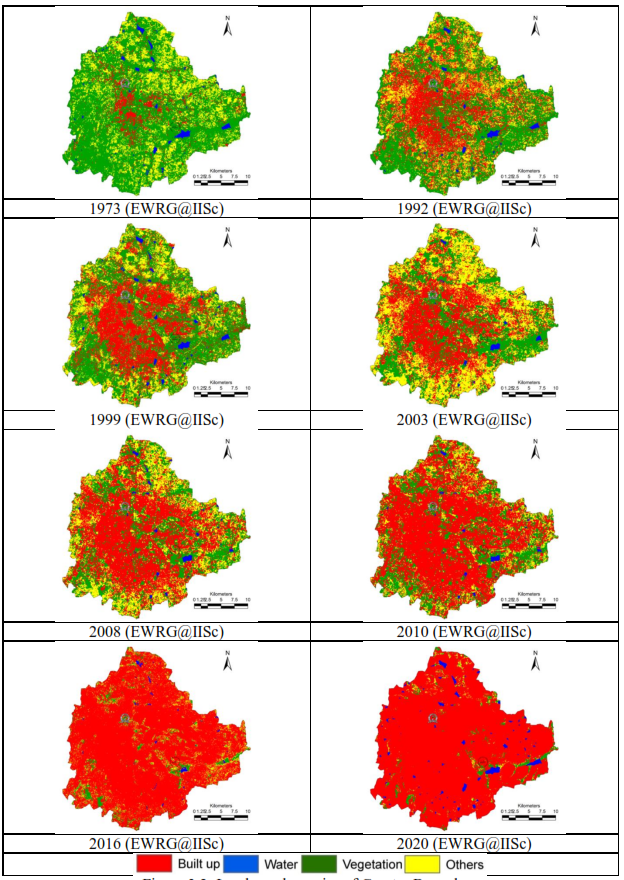
Figure 3.2: Land use dynamics of Greater Bangalore
Table 3.1: Land use dynamics in Bangalore City
Area in sq.km |
Year/LU |
1973 |
1992 |
1999 |
2003 |
2008 |
2010 |
2016 |
Pred2020 |
Built up |
5448 |
18650 |
24163 |
25782 |
35301 |
37266 |
54807 |
66463 |
Vegetation |
46639 |
31579 |
31272 |
26453 |
20090 |
16031 |
5364 |
2108 |
Water |
2324 |
1790 |
1542 |
1263 |
613 |
617 |
696 |
696 |
Others |
13903 |
16303 |
11346 |
14825 |
15256 |
14565 |
10394 |
2002 |
Area as % |
Year/LU |
1973 |
1992 |
1999 |
2003 |
2008 |
2010 |
2016 |
Pred2020 |
Built up |
8.0 |
27.3 |
35.4 |
37.7 |
49.5 |
54.4 |
76.9 |
93.3 |
Vegetation |
68.3 |
46.2 |
45.8 |
38.7 |
28.2 |
23.4 |
7.5 |
3.0 |
Water |
3.4 |
2.6 |
2.3 |
1.8 |
0.9 |
0.9 |
1.0 |
1.0 |
Others |
20.4 |
23.9 |
16.6 |
21.7 |
21.4 |
21.3 |
14.6 |
2.8 |
Land use analysis in Bangalore city shows 1005% increase in urban (built-up) area between 1973 and 2016 i.e., from 8.0% (in 1973) to 77% (in 2016). Unplanned rapid urbanisation during post 2000’s (concentrated developmental activities due to IT parks and SEZ’s development in the city) has led to drastic and unrealistic land use changes (Ramachandra et al 2012). Urban land use shows that it is reaching saturation with respect to lateral development, whereas the scope of built up area development remains in vertical growth, but this will have telling influences on the city infrastructure (road, drinking water and sanitation facilities). Vegetation in the catchment has decreased by 88% and water bodies declined by 79%. Vegetation cover, other land uses has decreased about 72.85% between 1973 and 2016. Land use prediction using Agent Based Model showed that built up area would increase to 93.3% by 2020, almost in the verge of saturation. Number of lakes in Bangalore has reduced by 790% during 1973 to 2016.