|
Results and Discussion
4.1.Results
4.1.1. Land-Use Dynamics and Modeling
The spatiotemporal land-use analyses presented in Fig. 4 highlight the loss of forest cover due to anthropogenic pressure. The region had 16.21% evergreen forest cover in 1985, which is reduced to 11.3% in 2018. The region has 17.92%, 37.53%, 4.88% under plantations, agriculture, mining and built-up, respectively (Fig. 5). The increase in monoculture plantations such as Acacia, Eucalyptus, Teak, Rubber, developmental projects and agriculture expansions are the major drivers of land-use changes. The region has lost 12% of interior (contiguous) forest cover during 1985 to 2018 with an increase in non-forest cover (11%). The interior forests (25% in 2018) are confined to major protected areas; edge forests are becoming more prominent due to sustained anthropogenic pressure (Fig. 6). The Goa has experienced loss of large tracts of interior forest cover due to the indiscriminate rampant mining activities. The simulated land-use (of 2018) was compared with the actual land-use (of 2018), which shows a consistent result evident from higher accuracies (92.6%) and overall kappa (K(overall): 0.91, K(histo): 0.95, K(location): 0.95). The projected land-use of 2031 highlights likely loss of evergreen forest with increases in agriculture cover (39%) and built-up area (5%). The large-scale changes of agriculture and built-up cover are noticed as per Fig. 7, in the eastern Kerala, Tamil Nadu and Maharashtra states of WG. The evergreen forest will cover only 10% of the WG, which would threaten the sustenance of water and other natural resources, affecting the food security and livelihood of people in the peninsular India. (location)
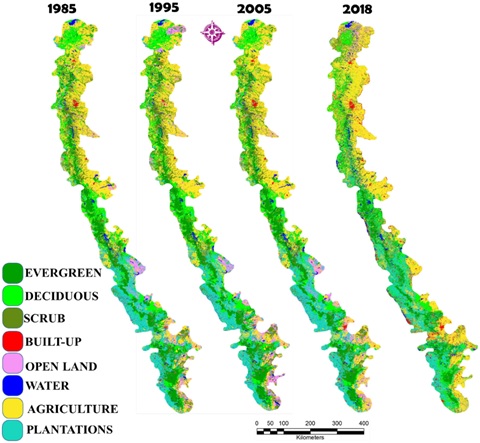 Figure 4. Land-use analyses of WG from 1985 to 2018.
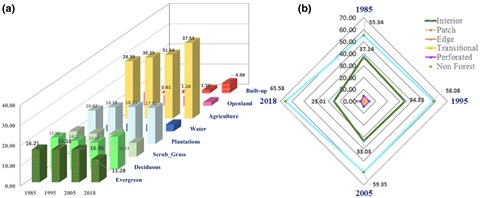 Figure 5. Spatiotemporal land-use and fragmentation details.<
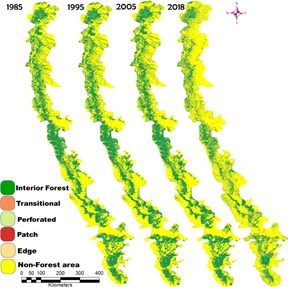 strong>Figure 6. Forest fragmentation from 1985 to 2018.
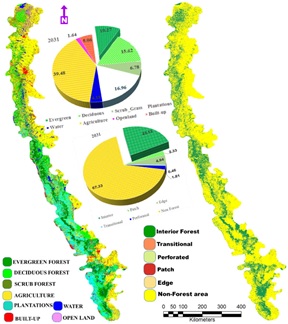 Figure 7. Likely land-use and fragmentation of WG for year2031.
4.1.2. Quantification of Carbon Sequestration
The carbon sequestration potential of WG has been quantified as discussed earlier in the method section, by using field data as well as the information from published literatures. The current study confirms that the forests of WG are incredible reservoirs of biomass and carbon stock, which highlights the decisive role of forests in lowering atmospheric carbon (emitted due to anthropogenic activities) and mitigating global warming. The above-ground biomass in WG is about 1.62 MGg (million gigagrams or tera metric tons or Tt) with the sequestered carbon of 0.81 MGg per year, respectively, which are reflected spatially across WG in Fig. 8a and b, respectively. The southern and central WG regions endowed with the rich native forests have biomass >1200 Gg/ha and carbon 600 Gg/ha. The soils are rich in carbon (0.42 MGg) especially southern and central WG, evident from Fig. 8c. The total carbon captured by WG forests, above-ground biomass and soil, is 1.23 MGg (Fig. 8d). The annual incremental biomass of 62,869.11Gg (Fig. 9a) with the carbon capture of 31,434.55 Gg (Fig. 9b) shows the higher carbon sequestration potential in southern WG. Similar trend is noticed in the incremental carbon captured by soil 15,120 Gg as shown in Fig. 9c, d, and relatively higher carbon content increment per year is noticed in Karnataka and central Kerala parts of WG. The productivity of biomass (17,442.01 Gg) given in Fig. 10a–d reveals higher values for the states of Karnataka, Kerala and Tamil Nadu portions of WG (Fig. 10a–d). The total incremental carbon excluding carbon loss through productivity is accounted to be 37,507.3 Gg. The likely changes in carbon sequestration potential in the WG were estimated considering simulated landuse with
(a) conservation scenario and
(b) businessas-usual scenario.
The business-as-usual scenario (with the current trend of decline of forest cover due to land-use changes) depicts the above-ground biomass of 1.3 MGg with stored carbon of 0.65 MGg and soil carbon of 0.34 MGg. The total carbon captured by WG forests in 2031 shown in Fig. 11a will be about 1.0 MGg from both above-ground biomass and soil. The large tracts of forest cover are likely to retreat due to land-use changes with increases in the agriculture and built-up area, which will erode the carbon sequestration potential of forests by 0.23 MGg (2018–2031) as illustrated in Fig. 11b. The conservation scenario depicts an increase in carbon sequestration potential of WG forests with the protection. The total carbon sequestered would be 1.5 MGg by 2031 as shown in Fig. 11c due to higher protection with minimal disturbances.
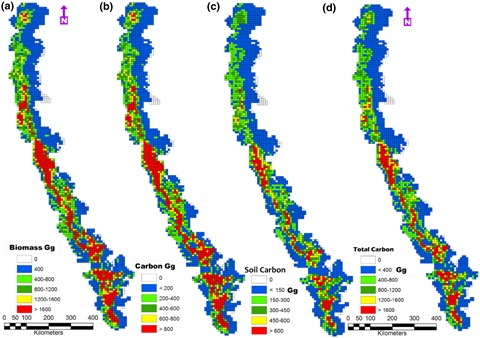 Figure 8. Above-ground biomass (standing biomass), carbon, soil carbon content and total carbon stock of WG.
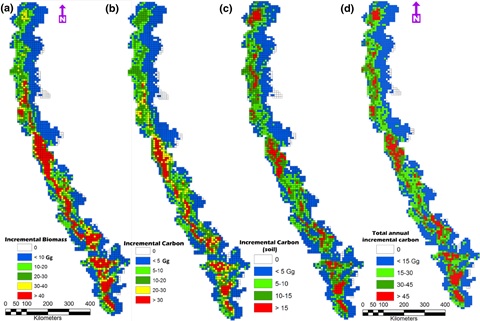 Figure 9. Incremental carbon of WG from above-ground biomass, below-ground biomass.<
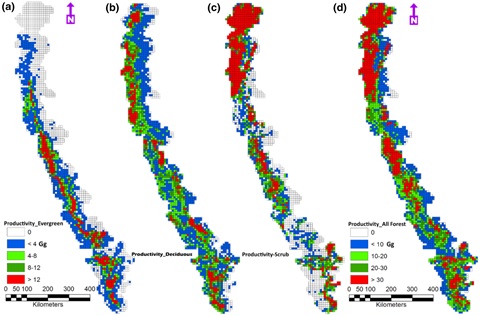 Figure 10. Productivity of forests across WG.
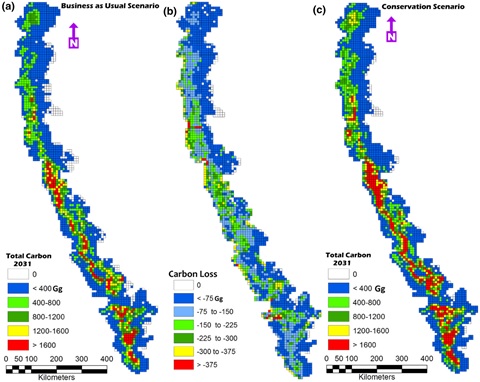 Figure 11. Simulated carbon stock across various scenarios.
CO2emissions in India are about 3.1 MGg (2017), with the per capita CO 2 emissions of 2.56 metric tonnes (WRI 2014; Garg et al. 2017;Le Que´re´ et al. 2018). Carbon footprint is contributed by emissions from the energy sector (68%), agriculture (19.6%), industrial processes (6%), land-use change (3.8%) and forestry (1.9%), respectively. India, emitting 7% of total GHG emissions across the globe (336.6 MGg), is in the 4th place after major carbon emitters—China (27%), USA (15%) and European Union (10%). Carbon emission contributed by major metropolitan cities of India is about 1.3 MGg such as Delhi (38,633.20 Gg), Greater Mumbai (22,783.08 Gg), Chennai (22,090.55 Gg), Bengaluru (19,796.6 Gg), Kolkata (14,812.1 Gg) Hyderabad (13,734.59 Gg) and Ahmedabad (6580.4 Gg) from energy, transportation, industrial sector, agriculture, livestock management and waste sectors per year (Ramachandra et al. 2015). The current study illustrates the pivotal role of sequestering carbon by an ecologically fragile WG. The Western Ghats has the potential to sequester carbon emission of all southern Indian cities and 1.62% of the total CO2emissions from India. The total emissions from WG states accounted to be 352,922.3 Gg (Table 4), and forests of WG have the ability to sequester 11% of the emissions, which highlights vital carbon mitigation role and moderating climate. India has committed to reducing its the emissions by 33–35% by 2030 during the Paris Climate Change Agreement, which is challenging task considering the likely economic growth momentum to sustain 1.25 billion people consumptions (Garg et al. 2017). This necessitates immediate implementation of carbon capture (with afforestation of degraded landscapes with native species, regulations of LULC changes) and de-carbonization (through large-scale implementation of renewable and sustainable energy alternatives). These can be achieved through stringent norms toward
(i) protection of ecologically fragile regions,
(ii) dis-incentives for continued higher emissions based on 'polluter pays'principle,
(iii) adoption of clusterbased decentralized developmental approaches and
(iv) incentives for reduced emission.
The carbon trading has demonstrated the potential in monetary values across the globe of Indian forests in capturing carbon (Atkinson and Gundimeda 2006; Guthrie and Kumareswaran 2009; Damandeep 2017). The monetary values of sequestered carbon vary from $10 to $1000 based on specific assumptions (Ricke et al. 2018). Based on this, the WG forests are worth INR 100 billion ($1.4 billion) at $30 per tonne. Carbon credit payments offers an effective means of increasing carbon sequestration and will proved to be a viable conservation approach via business plan. The push of carbon credit payments, with streamlining through stakeholder's active participations, would dramatically reduce the abuse of forests. This would also encourage farmers to grow trees and converting the land to its next best use.
| State/UT |
Emission (Gg) per year |
Total(Gg) |
Carbon storage in WG (Gg) per year |
% Removal |
| CH4(CO2equivalent) |
CO(CO2equivalent) |
CO2 |
| Goa |
233 |
337 |
3881 |
4451 |
872 |
20 |
| Gujarat |
15,546 |
14,498 |
79,138 |
109,182 |
1947 |
2 |
| Karnataka |
15,662 |
15,239 |
54,337 |
85,237 |
10,401 |
12 |
| Kerala |
3167 |
6108 |
26,047 |
35,321 |
7617 |
22 |
| Maharashtra |
23,129 |
26,497 |
105,260 |
154,886 |
11,020 |
7 |
| Tamil Nadu |
15,761 |
19,190 |
71,107 |
106,058 |
5375 |
5 |
| Dadra and Nagar Haveli |
46 |
63 |
1458 |
1567 |
601 |
38 |
| Total emission (Gg) |
|
|
|
496,703 |
37,833 |
8 |
Table 4. Carbon emission across the states of WG
4.1.3. Climate Trend with Land-Use Relationship
Global databases (NCAR and Princeton University) were validated through comparison with the surface measurements of ground-based monitoring stations in the regional climate datasets (IMD, KSNDMC), which shows 90% similarities. Spatial variability of precipitation, rainy days and temperature are presented in Fig. 12, which illustrates that central and northern WG have annual average temperatures less than 25.5°c, while at the southern WG show temperatures of 25.5°C to over 26.5°C. Rainfall analysis shows that the central WG receives rainfall of over 2500 mm and tends to decline to less than 1500 mm from south WG to the northern WG. Spatial distribution of rainy days illustrates that southern WG has significantly higher rainy days receiving precipitation for more than 180 days, compared to the northern parts.
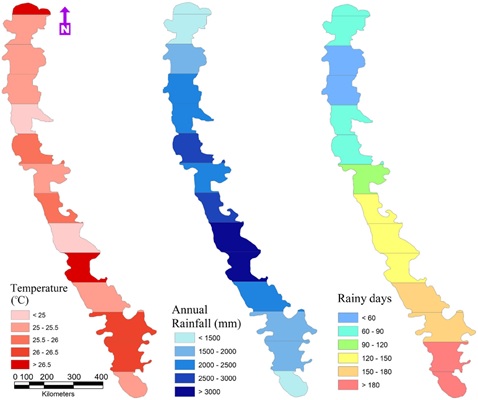 Figure 12. Spatial variations of climatic parameters.
Long-term trend analysis of climatic variable is depicted in Fig. 13. The southern Kerala (latitudes of 8°–9°) shows an increase in temperature from 0.5°cto greater than 1°C during the past 100 years, while the rainfall has declined by 250 mm and the decline of rainy days by 2 to 4 days. Latitude 10–12 shows that the temperatures have increased between 0.25° and 0.5°Cin a century, while rainfall has declined between 100 and 250 mm and decline in rainy days by 2 days. The analysis indicated that the regions in the southern WG of Kerala and part of Karnataka (8–13°) have witnessed large-scale climate changes. The central WG portions (Karnataka) shows a very meager change in temperature, i.e., less than 0.05°C increase, while the rainfall shows increasing trends close to 100 mm and increase in rainy days up to 2 days. The northern portion of the WG latitudes (16–21°) shows an increasing temperature of 0.5°C, 4 days increase in the number of rainy days and the increase in rainfall between 100 mm and just over 250 mm. These analyses demonstrate that land-use has played a major role in moderating microclimatic conditions in WG over a temporal scale. The reduction in rainfall and an increase in climate can affect carbon stock in the region. The fixed major soil carbon can release to the atmosphere due to land-use change and increase in temperature. The instances of vegetation die-off can occur with microclimate alterations, which further contribute to the increase in the carbon content of the atmosphere. Forests are also known as water towers and are responsible for capturing water from the atmosphere through rainfall and also aid in condensation, influencing land surface properties such as evapotranspiration, temperature and humidity (Bonan 2008; Syktus and McAlpine 2016). Reduction in the natural forests has reduced the surface roughness and aerodynamics, due to which the rain bearing clouds move along the winds causing rainfall in the windward direction. This could be observed with increasing rainfall and rainy days to the Northern WG and decreasing rainfall and rainy days in the southern WG.
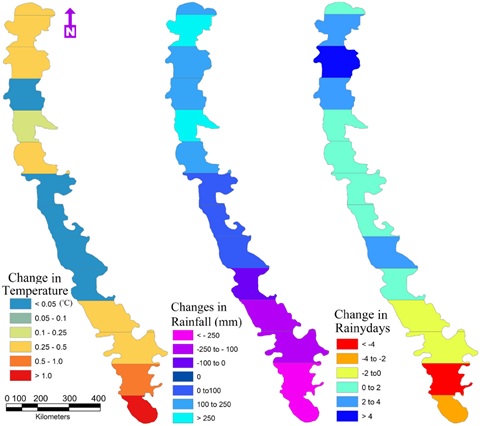 Figure 13. Spatiotemporal trend of climatic parameters.
4.2.Discussion
Forests sequester atmospheric carbon and help in lowering GHG footprint apart from providing diverse goods and services to the humankind. The anthropogenic pressures resulting in large-scale LULC changes are altering the landscape structure which has affected ecological functions, namely hydrological regime, biogeochemical functioning and nutrient cycling. Implications of the implementation of unplanned developmental activities are evident from barren hill tops, decline in native biodiversity, spread of invasive species, alteration in hydrological regime (conversion of perennial streams and rivers to the seasonal one), increase in temperature, higher instance of flooding and droughts. The increase in greenhouse gas (GHG) footprint due to deforestation with LULC changes has interrupted bidirectional interactions of surface vegetation cover, climate (Canziani and Gerardo 2012)and will further modify carbon budget (Schulp et al. 2008). Nogueira et al. (2015) assessed the carbon stock loss from deforestation in Brazil's 'Legal Amazonia'and 'Amazonia biome' regions (documented in 41 published studies, through field investigations in 2317 onehaplots) and reported a gross reduction of 18.3% in Legal Amazonia (13.1 Pg C) and 16.7% in the Amazonia biome (11.2 Pg C). Emissions per unit area from forest clearing would lower the mean biomass of remaining vegetation due to various effects such as edges, disturbances and loss of microclimate. Deforestation will reduce the latent heat flux at a local scale that results in the increased warming, affecting the cloud formation process. The surface warming as a result of deforestation will increase drying of the boundary layer, could lead to reduced clouds, increase the drier period and, in turn, allow more downward solar radiation at the surface and hence warming (Bala et al. 2007).
LULC changes have directly modified the local climate, surface temperatures and rainfall regime in the WG, contributing to regional climate changes with water scarcity, increases in the vulnerability to fire and vegetation dieback. Few global studies demonstrated LULC changes and their interactions in climate and global terrestrial carbon cycle (Levy et al. 2004; Zaehle et al. 2007; Sitch et al. 2015; Zhu et al. 2018). Estimates of original biomass and likely changes in biomass are essential for estimating losses to forest degradation. In this context, the current endeavor estimates biomass and carbon stocks and attempts to present the likely changes through modeling and simulation. The modeling of likely changes with insights into agent's behavior helped in enhancing the accuracy, which will help in projecting d carbon sequestration (Zaehle et al. 2007; Schulp et al. 2008; Nogueira et al. 2018). Insights form the analyses of LULC simulated changes would help in evolving policies for prudent ecosystem management to mitigate carbon footprint by reducing the deforestation process at a regional scale.
|