

Western Ghats Spatial Decision Support System
(Ecologically Sensitive Regions in the Western Ghats)
Web: https://wgbis.ces.iisc.ac.in/sdss/wgsdss/index.php
(designed and developed as part of LiFE – LIFESTYLE FOR ENVIRONMENT)
T V Ramachandra, Bharath Setturu, Vinay S, M D Subash Chandran, Abhishek Baghel,
Bharath
H
Aithal
Abstract
Western Ghats Spatial Decision Support System (WGSDSS) has been designed as part of the ongoing ecological research in the Western Ghats by taking advantage of the recent advances in information and open source web technologies through the integration of spatial with the attribute information (bio, geo, climatic, ecological, environmental, and social variables) at disaggregated levels. This enhances governance transparency while meeting societal needs, which helps in the prudent management of ecologically and hydrologically vital Sahyadri hill ranges. Visualization of ecologically sensitive regions at disaggregated levels (grids/village) through synthesis and integration of information would enable understanding of the current status, which are essential for effective decision-making at decenralised levels for example BMCs (Biodiversity Management Committees) towards sustainable management of natural resources.
Web-based spatial decision support system (WSDSS) is designed by integrating free and open
source software (GeoServer, PostgreSQL, PostGIS, Leaflet) and integration of spatial
information
of Open Geospatial Consortium (OGC) standards to carry out a multiple criteria analysis.
Features such as Web Map Service (WMS), and Web Feature Service (WFS) would help in
accomplishing effective dissemination of the ecological, socio, economic, biodiversity and
environmental information. Highlights of WGSDSS
(https://wgbis.ces.iisc.ac.in/sdss/wgsdss/index.php) are
:
- Helps in visualizing regions based on eco-sensitiveness
- Visualize variables used for computing eco-sensitiveness
- Available at grid level (5'x5' or 9 km x 9 km) and village levels
- Aids in decision making at decentralized levels (BMC, local forest department, etc.)
Ecological sensitivity or fragility refers to the permanent and irreparable loss of extant life forms or significant damage to the natural processes of evolution and speciation with the alterations in the ecological integrity of a region. The comprehensive knowledge of the ecological fragility of a region is quintessential for evolving strategies for conserving the area, which entails identifying factors responsible for ecological sensitiveness, including landscape dynamics, and visualizing future transitions to mitigate the problems of haphazard and uncontrolled development approaches. The region witnessed large-scale land cover changes during the past century due to unplanned developmental activities involving industrialization. Globalisation and relaxing market norms led to rapid urbanisation with large-scale land cover changes. This necessitates implementing mitigation measures involving stakeholders to address the impacts through location-specific conservation measures. Framing conservation and sustainable developmental policies entail delineating ecologically sensitive regions by integrating bio-geo-climatic, ecological, and social factors representing the dynamics of socio-ecological systems, impacts, and drivers.
Analyses of ecologically sensitive regions in the Western Ghats, one among 36 global biodiversity hotspots using temporal remote sensing data, highlight severe concerns for the status of forests and conservation options. The deforestation and mismanagement of these pristine ecosystems evident from deforestation and the current extent of forest ecosystems have been threatening water security with severe challenges to the livelihood of people in peninsular India. Spatiotemporal analyses of LU highlight anthropogenic-induced developmental thrust with the loss of 5% evergreen forest cover with an increase of 4.5% built-up cover, 9% agriculture area. Fragmentation analyses highlight that interior forest constitutes only 25% of the forest landmass, depicting the fragmentation pressure, which impacts local ecology. ESR delineation considers abiotic, biotic, and socio/anthropological factors, reflecting the current status of the fragile landscape and their significance in maintaining ecosystem equilibrium. Grid-wise eco-sensitive analyses portray 32% (755 grids) of the area under ESR-1, denoting very high ecological fragility, 16% (373) grids under ESR-2, which has the potential to be ESR-1, 34% (789), and 18% (412) under ESR-3, and 4 respectively, with moderate and least ecological fragility. ESR analysis depicts 63,148 km2 area under very higher ecological fragility, 27,646 km2 under high ecological fragility, 48,490 km2 as moderate and 20,716 km2 as low ecological fragility. Integrating ESRs in the sustainable development policy framework would aid in regulating unplanned developmental activities, which aid in ensuring ecological security with the continuance of the essential ecosystem services to sustain the livelihood of people.
Keywords : Ecological fragility, spatial decision support system (SDSS), endemic taxa, energy. Ecology, bio-geo-climatic aspects
Introduction
Tropical forests constitute a vital ecosystem with rich biodiversity across the globe, supporting a wide array of biota. Forest ecosystems worldwide are the most threatened ecosystems with unplanned developmental activities leading to land cover changes and over-exploitation of natural resources due to industrialization during the last century and globalization in the recent past (Ramachandra et al., 2020a; Nayak et al., 2020;). Estimates indicate that anthropogenic pressures have affected around 50 million tropical forest fragments accounting for 300 million hectares, also creating 50 million edges across the globe (Brinck et al., 2017).
Land use land cover (LULC) represents the structure of a landscape. The anthropogenic activities that stimulate LULC change in a forest landscape have posed severe conservation challenges due to rapid degradation resulting in deforestation with a sustained impact on the ecosystem. Large-scale LULC changes are evident from the implementation of unplanned developmental projects such as power projects, infrastructure, linear corridor developments, canals, and power transmission lines in the ecologically vital regions have been creating fragmentation of forests evident from the decline in the contiguous native forests (Yokochi et al., 2015; Langlois et al., 2017; Ramachandra et al., 2019a). An increase in the perforated forests and gaps or edges would result in more fragmented forests. The impacts of forest fragmentation will extend into the interior (core/intact) forest areas and alter forest connectivity, composition, imbalance in microclimatic conditions, habitat modification, density, and other dynamics (Ramachandra et al., 2016). Due to anthropogenic activities, the newly formed edges induce alteration in microclimate, and moisture availability up to 40-60 m from the edge to the intact forests (Latimer et al., 2017), affecting biota. The fragmentation process will enhance canopy gaps (Stark et al., 2012), degrades understory vegetation cover (Hunter et al., 2015), which affects micro-climatic conditions, induce imbalances in nutrient cycling, and increase invertebrate mortality rates (Ewers and Banks-Leite, 2013; Andronache et al., 2019). Detrimental effects of fragmentation of pristine forests are the decline of native species, alterations in climatic conditions, higher mortality of tree species, less seed dispersal, loss of regeneration, increase in short-lived pioneers, decreased forest biomass, and loss of carbon sequestration potential (Chaplin-Kramer et al., 2015; Almeida et al., 2019; Ramachandra and Bharath, 2021).
Unregulated exploitation of forest resources and LULC changes have led to the degradation of the unique ecological units, evident from barren hilltops, and fragmented forest patches (Ramachandra and Bharath, 2019a), affecting hydrological services such as the conversion of perennial streams to intermittent ones, and loss of groundwater recharge potential (Vinay et al., 2013), loss of livelihood opportunities (Madhurima and Banerjee, 2013), reduction in productivity (Nayak et al., 2012), alteration in surface and ambient temperature, etc. (Bharath et al., 2013; Ramachandra et al., 2018a). Intense LULC changes altering vegetation composition and soil carbon storage (biogeochemical feedbacks) have disturbed the carbon cycle (Nath et al., 2018; Ramachandra and Bharath, 2019b; Shen et al., 2021), surface energy budget, evapotranspiration, etc. (Stocker et al., 2018), which would further induce desertification as well as long term impact such as climate change (Harrison et al., 2018). LULC dynamics assessment of the forested landscape reveals a historical perspective of natural as well as anthropogenic pressures over a space that lends an opportunity to investigate the spatial patterns, relationships, rate, and impacts on resources for prudent regional planning and good governance (Koschke et al., 2012; Sallustio et al., 2016; Ramachandra et al., 2017; Bharath et al., 2021). It necessitates sustainable developmental policies considering landscape structure with ecosystem components and functions.
Integrated analyses considering the demographic, ecological, climatic, economic, market, and institutional factors help formulate prudent natural resources management strategies. Forest land management policies incorporating stakeholders' perceptions would aid in understanding driving forces, impacts, and remedial measures for improved livelihood strategies. Policies framed for regional planning need to integrate accurate biophysical information, and permissible activities by accounting for ecosystem resilience, conservation initiatives, and actions required for guiding communities and regional managers (Ban et al., 2013). Conservation planning approaches to protect the regions of ecological significance require appropriate technologies, an understanding of social-ecological systems, and opportunity costs of economic relevance. The ecosystem with supportive and assimilative capabilities attains dynamic equilibrium and can withstand external disturbances up to a specific limit, referred to as the sensitivity or carrying capacity (CC). CC studies help establish ‘limits to growth’ by reviewing the relationships among human, economic activities, and resources over a region (Martire et al., 2015; Jin et al., 2018). CC studies focus on supporting and pressure forces on natural resources in the landscape. The pressure forces include human activities (social) and economic activities on the ecological environment (Wu and Hu, 2020). Considering the ecological system is crucial for sustainable development to support human activities with social and economic development, as per tenets of the United Nation’s Sustainable Development Goals (SDGs) (United Nations, 2015). Stringent policies for effective land use management are essential for mitigating deforestation and land degradation while enhancing the ecological assets and services for the anthropogenic benefit (Aldieri et al., 2019; Bharath and Ramachandra, 2021). The identification of landscape elements or regions of distinct characteristics that have low resilience and, if disturbed by external influences, either anthropogenic or natural, and difficult to restore to their natural state (Gadgil et al., 2011) is crucial, and these identified regions at disaggregated levels are known as Ecologically Sensitive Regions/Areas/Zones (ESR/ESA/ESZ) or ecologically fragile regions (EFR). Hence, ESR constitutes regions of diverse landforms, vegetation, geologically significant, and rich biodiversity characterized by their sensitivity and economically significant for providing services (Wilkinson, 2007). Conservation of ESR is vital for the long-term maintenance of biological diversity, soil, water, or other natural resources in the landscape/region. ESR framework prioritizes considering the inherent significance of a region, and trade‐offs involved due to conservation actions, and informs of consequences in the current management activities. Restricting anthropogenic activities in ecologically sensitive/vulnerable areas through stringent conservation measures (Gao et al., 2020) would guarantee regional ecological security. ESR is based on sound science and would provide a systemic management mechanism. ESR supports comprehensive ecological conservation by conserving the most ecologically valuable and fragile ecosystems and guiding nature conservation.
ESR identification accounts for the dynamic interactions among biodiversity, geo-climatic and social processes. The Ministry of Environment, Forests and Climate Change (MoEFCC), the Government of India, is empowered to frame policies to ensure conservation and environmental protection under section 3 of the Environmental Protection Act 1986 (EPA). The Ministry can legally prohibit environmentally hazardous or polluting industries as per section 5 of the EPA. MoEFCC in 2000 constituted the expert committee (Pronab Sen committee, 2000) provides guidelines for identifying regions based on their ecological significance. The Western Ghats Ecology Experts Panel (WGEEP) constituted by MoEFCC (in 2011) prescribed conservation and management measures in the ecologically ‘salient’ regions at the taluk (tehsil- a local administrative unit) level. High-Level Working Group, formed in 2013, demarcated ESA (Ecologically Sensitive Areas) through geospatial analysis but failed to account for the social dynamics and the role of local ecology in sustaining the ecosystem services. However, both reports have not been unimplemented.
Policies for conserving biodiversity in the hottest hotspot regions, such as the Western Ghats (WG), require demarcating important ecological, hydrological, and social regions by integrating a technologically advanced approach, considering ecologically or economically significant and sensitive, coupled with multi-criteria analysis. In this regard, the objectives of the current research are (i) spatial extent of ecosystems, (ii) elucidation of ecosystem conditions through the understanding of LULC dynamics with the extent of fragmentation of forests; (iii) integrating bio-geo-climatic and social variables at disaggregated levels and (iv) demarcation of ecologically fragile regions or ecologically sensitive regions (ESR) at disaggregated levels through effective integration of bio-geo-climatic, hydrological, ecological and, social dynamics. ESR aids as an effective policy instrument in the decision-making (through BMC: Biodiversity Management Committees) at decentralized levels (Panchayath) to sustain water, food, and fodder with sustainable development and support the livelihood of all stakeholders.
Materials and Method
Study Area :
The Western Ghats (Sahyadris), extending from 8° N to 21° N latitudes and 73° E to 77° E
longitudes (Figure 1), is one among 36 global biodiversity hotspots (Myers et al., 2000),
one
among the eight unique ‘hottest hotspots’ of biological diversity, and also one of the
primary
the 200 globally most important ecoregions (Olson et al., 2001). It is a continuous
escarpment
spreading from Gujarat to Kerala states covering an area of 160000 km2
(constitutes only 5%
of
India’s geographical extent) and a length of 1600 km with an exceptionally small break in
the
far south called ‘Palghat gap’ between Nilgiri hills and Annamalai ranges. It is one of the
oldest mountain chains, retaining the original Gondwanaland geology. It has elevation ranges
from 300-2700 m, spread across six states (i.e., Gujarat, Maharashtra, Goa, Karnataka, Tamil
Nadu, Kerala) and a union territory (Dadra and Nagar Haveli) of India, with a mean annual
rainfall of 2500 mm. The forest landscape, due to variability in precipitation and
topographic
diversity, comprises a wide variety of eco-zones ranging from wet evergreen and
semi-evergreen
forests at high altitudes, moist deciduous forests in the medium altitudes, and dry
deciduous
forests, scrub type on the eastern slopes and lowlands (Champion and Seth 1968). The Western
Ghats are endowed with perennial river networks and function as a water tower for peninsular
India, ensuring water and food security and sustaining the livelihood of millions of
dependent
populations.
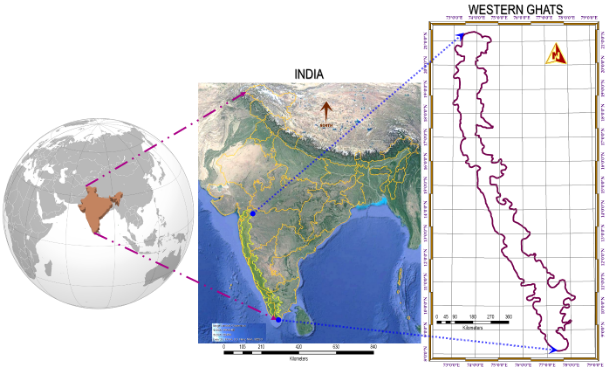
Figure 1 : The study region - Western Ghats, India
The major river systems originating in the ecologically fragile Western Ghats are Godavari, Kaveri, Krishna, Thamiraparani, and Tungabhadra, which flow from west to east, draining into the Bay of Bengal. Periyar, Aghnashini, Bharathappuzha, Kali, Gangavathi, Pamba, Netravati, Sharavathi, Mandovi, and Zuari rivers flow westwards, draining into the Arabian Sea. Numerous streams fed by incessant rain drain off the mountainsides, leading to innumerable waterfalls during the monsoon season. Major waterfalls include Dudhsagar, Unchalli, Sathodi, Magod, Hogenakkal, Jog, Kunchikal, Shivanasamudra, Meenmutty Falls, and Athirappilly Falls. The forests support various lifeforms, providing goods and services and acting as a lifeline for the dependent population. Perennial water flows across the region support the diverse agriculture and horticulture sectors. The presence of patch forests with relics highlights the lineage of primeval forests. Large-scale anthropogenic activities across the Western Ghats have accentuated land degradation leading to deforestation. The presence of close canopies, magnificent trees, large herds of elephant movements, troops of lion-tailed macaques in southern rain forests, and jumping deers across the various forest types highlight the scope for conservation through sustainable management approaches to maintain the ecological integrity of the serene landscape.
Method :
Identification and delineation of ESRs in the Westerns Ghats have been carried out in two
phases
(Figure 2), which entailed (i) assessment of LU changes over a temporal scale and condition
of
forests, and (ii) the delineation of ESR at disaggregated levels by integrating
bio-geo-climatic, ecological, hydrological, and social variables reflecting the region's
distinct characteristics.
(i) Quantification of spatiotemporal changes in LU
Temporal remote sensing (RS) data from 1985 to 2018 has been analyzed with the help of field
data, and collateral data such as vegetation maps of the French institute Puducherry
(Pascal,
1986), topographic maps from the Survey of India
(https://onlinemaps.surveyofindia.gov.in/Home.aspx), biodiversity information from the
biodiversity portal (http://indiabiodiversity.org/), and LU attribute information from the
virtual spatial data portals such as Google Earth (http://earth.google.com), Bhuvan
(http://bhuvan.nrsc.gov.in). RS data of 1985 (100 m resolution resampled to 30 m) is
procured
from International Geosphere-Biosphere Programme (IGBP), and Landsat 8 OLI (Operational Land
Imager – 30 m) for 2020 was pre-processed for geometric (geo-referencing) and radiometric
correction. Field surveys across forest types have been carried out to collect training data
for
LU analysis and attribute data pertaining to species composition. RS data has been
classified
through the supervised classifier based on the Gaussian maximum likelihood algorithm (Otukei
and
Blaschke, 2010; Srivastava et al., 2012; Bharath et al., 2014; Ramachandra et al., 2019a).
LU
classification using remote sensing data involved (i) creation of False Colour Composite
(FCC)
to identify heterogeneous features; (ii) selection of training sites by integrating
secondary
data with field data (60%), covering at least 15% of the scene area and training polygons
uniformly distributed across the study region; (iii) LU analysis through supervised
classification technique to differentiate eight distinct LU categories using GRASS GIS
(Geographical Analysis Support System); (iv) accuracy assessment to validate the
classification
based on rest (40%) of field samples (Lillesand et al., 2014). LU analysis has aided in
evaluating the condition of forests through fragmentation matrices, as per Equations 1, and
2
(Riitters et al., 2002; Kuèas et al., 2011; Ramachandra et al., 2016).
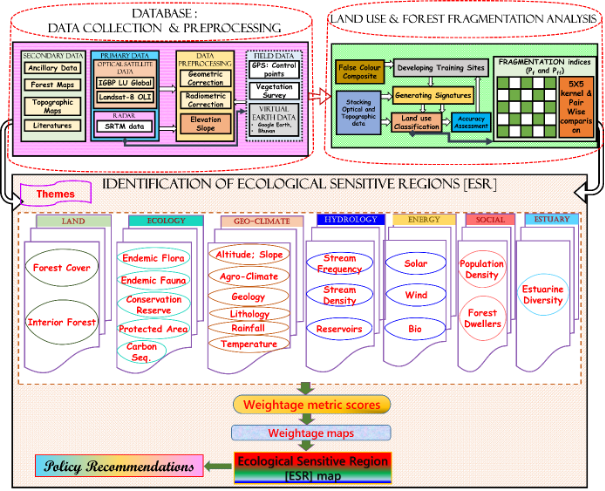
Figure 2 : Protocol for delineation of ESR at disaggregated levels
Indices Pf and Pff were computed through a moving kernel/window of 5×5 pixels over the study area map. The window was shifted one pixel at a time to sample the entire map, providing a synoptic evaluation of forest fragmentation by assessing each pixel’s “forest neighborhood” across various directions. The analysis has categorized forests into five distinct fragmentation groups, as given in Table 1. Lakes, streams, or river courses were excluded, which aid as a natural corridor of non-fragmenting features. At the same time, anthropogenic landscape elements (such as paved surfaces-buildings, roads; agricultural fields; horticulture; and barren land) were combined as non-forest cover types.
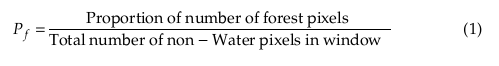

Table 1: The narration of fragmentation components.
| Fragmentation Element | Calculation | Interpretation |
|---|---|---|
| Interior | Pf = 1 | All pixels surrounding the centre pixel are forest. |
| Patch | Pf < 0.4 | A small forested area surrounded by non-forested areas. |
| Perforated | Pf > 0.6 and Pf - Pff > 0 | Forest pixels forming the boundary between an interior forest and
relatively small clearings (perforations) within the forested landscape |
| Edge | Pf > 0.6 and Pf - Pff < 0 | The boundary between interior forest and large non-forested land cover features. |
| Transitional | 0.4 > Pf > 0.6 | Areas between edge type and non-forest types. |
(ii) Identification of Ecological Sensitive Regions (ESR)
The process of categorizing ESR at disaggregated levels comprised the following steps: (i)
considering the significant descriptive variables covering various themes which elucidate
ecological conditions (Liu et al., 2015); (ii) evaluating and generating spatial maps based
on the environmental sensitiveness of each land unit (extent and condition); (iii)
developing an aggregated weight by linking individual factor weights, which assist in
dividing/prioritizing the region based on aggregated weight into broad classes of
sensitivity such as “exceptionally sensitive, high sensitive, moderately sensitive,
marginally sensitive, and not sensitive” (Leman et al., 2016; Ramachandra et al., 2018b);
(iv) exploring the prepared ESR map, offering detailed recommendations for aiding in
sustainable developmental prospects and enriching the existing forest cover (Gadgil et al.
2011; Ramachandra et al., 2019a). The ESR mapping has been carried out by considering the
significant descriptive variables covering various themes. The study area is divided into
5’× 5’ equal-area grids (2329) corresponding to a grid (5’×5’), covering approximately 9×9
km2 of the 1:50000 scale of the Survey of India topographic maps. The data of
various themes
were collected through field surveys, review of literature, online information portals, and
unpublished datasets. A comprehensive database of landscape features from land to
socio-economic systems has been created. The preliminary analysis has resulted in a series
of weight maps pertaining to various themes. The weightage metric score has been computed to
capture the priorities associated with each theme (based on the extent and condition), which
assists in combining knowledge from a wide array of disciplines (Beinat, 1997; Termorshuizen
and Opdam, 2009). The weights are assigned as per Equation 3,
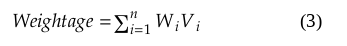
Where n is the number of data sets, Vi is the value associated with criterion i, and Wi is the weight associated with that criterion. Each theme is described by a group of mapped factors, which were normalized between 10 and 2. Grids were assigned a value of 10 for high-priority conservation, whereas 2 is converse to the above. The values 8, 6, and 4 correspond to high, moderate, and low levels of conservation based on the input factor values (Table 2). Weights computed for each variable are aggregated for each grid. Grids are grouped into four categories as ESR 1, ESR 2, ESR 3, and ESR 4 based on the aggregated scores ESR 1: aggregated scores > µ+2σ, ESR 2 (for grids within µ+2σ and µ+σ), ESR 3 (for grids with µ+σ and µ) and ESR 4 (grids with values < µ). In particular, the weights are based on an individual proxy and depend extensively on GIS techniques, which is the most effective method.
| S no. | Theme | Variable | Weights | ||||
|
2 |
4 |
6 |
8 |
10 |
|||
|
1 |
Landscape status |
Forest Cover |
<15% |
15-30% |
30-45% |
45-60% |
>60% |
|
Interior Forest Cover |
<15% |
15-30% |
30-45% |
45-60% |
>60% |
||
|
2 |
Ecology |
Flora |
Non-endemic |
- |
Endemic/ Threatened flora |
||
|
Fauna |
Non-endemic |
- |
Endemic/ Threatened |
||||
|
Protected Area (PA) |
Grids present outside PA boundary are assigned as 0 |
Grids covered within PA boundary |
|||||
|
Nilgiri Biosphere Reserve |
0 was assigned to the grids present outside the reserve |
Grids covered within the Reserve |
|||||
|
Carbon Sequestration (Gg) |
<400 |
400-800 |
800-1200 |
1200-1600 |
>1600 |
||
|
3 |
Geo- climatic |
Agro-Climatic Zone |
- |
- |
Deccan Plateau, Hot Moist Semi-Arid |
West Coast Plain, Hot Humid |
Western Ghats, Moist Sub Humid |
|
Altitude |
<150 |
150-300 |
300-450m |
450-600m |
>600m |
||
|
Slope |
<5% |
5-10% |
10-15% |
15-20% |
>20% |
||
|
Average Temperature |
< 200C |
20-24 |
24-25 |
25-26 |
>26 |
||
|
Rainfall |
<800 mm |
800-1600 |
1600-2400 |
2400-3200 |
>3200 mm |
||
|
Soil |
Coastal Sandy or Sandy |
Shallow Black |
Fragmental or Rocky outcrops/ Medium Black/ Laterite Soil |
Deep Black/ Clayey Loamy or Skeletal |
Loamy or Clayey/ Terai |
||
|
Lithology |
Phyllites/ Lignite/ Sandstone/ Limestone |
Braccia/ Charnokites/ Kaladgi |
Peninsular Gneiss/ Schists |
Laterite/ Dharwars/ Kondalites/ Granite |
Alluvium/ Basalt/ Schist and Quartz/ Deccan Trap |
||
|
4 |
Hydrology |
Stream Density |
<1 |
1-1.5 |
1.5-2 |
2-2.5 |
>2.5 |
|
Stream Frequency |
<1.25 |
1.25-2.5 |
2.5-3.75 |
3.75-5 |
>5 |
||
|
Reservoirs |
- |
- |
- |
Exists |
- |
||
|
5 |
Energy |
Solar |
<4.5 |
4.5-4.75 |
4.75-5 |
5-5.25 |
>5.25 KWh/m2 |
|
Wind |
<2 |
2-2.5 |
2.5-3 |
3-3.5 |
>3.5 meters/second |
||
|
Bio |
<500 |
500-1000 |
1000-2000 |
2000-3000 |
>3000 MWeq |
||
|
6 |
Estuaries |
Diversity |
- |
- |
- |
Moderate |
Rich Diversity |
|
7 |
Social |
Population Density |
>300 |
225-300 |
150-225 |
75-150 |
<75 (persons per ha) |
|
Forest Dwellers |
- |
- |
Tribal population in non-forest cover grids |
Tribal population in the least forest cover grids |
Presence of tribal population in thick forest grids |
||
Results
Understanding LU dynamics:
The reliable spatial data available at a temporal scale from spaceborne sensors have helped
to understand forest cover dynamics and underlying anthropogenic pressures. The temporal
remote sensing data collected here offered to assess forest cover and deforestation trends
and provided valuable insights to evaluate the efficacy of current management actions. LU
analysis highlights the loss of evergreen forest cover of 5% with an increase of built-up
cover by 4.5% and agriculture area (9%) due to anthropogenic pressures (Figure 3). The
evergreen forest cover has reduced from 16 (1985) to 11 (2018) %. The decline in native
forests is due to unplanned developmental activities involving the construction of a series
of hydroelectric projects, indiscriminate mining, and unscientific afforestation of
monoculture plantations (Acacia, Rubber, Eucalyptus, Teak), etc. Urbanization is accentuated
across major cities such as Pune, Coimbatore, Mangalore, Kolhapur, Karwar, etc. Mining
activities across the Ghats disrupt the hydrologic regime and ecological footprints beyond
the physical boundaries of mines by disrupting continuous forest patches. Floods and
landslides were noticed in the past two decades due to abrupt LULC changes across the Ghats,
especially in Kerala and Karnataka states (Ramachandra et al., 2021). The soil’s
water-holding capacity has been affected by LULC changes, resulting in flash floods across
the states.
The fragmentation analysis highlights the status of forests in the Western Ghats. Over the
past three decades, interior forest cover has reduced from 37.14 to 25.01%. The loss of
12.2% contiguous intact forest cover with an increase of 11.3% non-forest cover from 1985 to
2018 represents an escalation in fragmentation by affecting local ecology. Spatiotemporal
analyses of forest fragmentation trends highlight the spatial patterns of forest loss and,
as a result, lead to habitat loss, impacting many forest-dependent biotas. With the
degradation (domination of edge and patch) forest types, species adopted for interior/core
habitats are more likely to disappear, with edge and open field species prevalence. The
interior forests are mainly situated in protected areas across the region. The decline of
the contiguous interior forests affects endemic taxa and habitats, resulting in higher
instances of human-wildlife conflict.
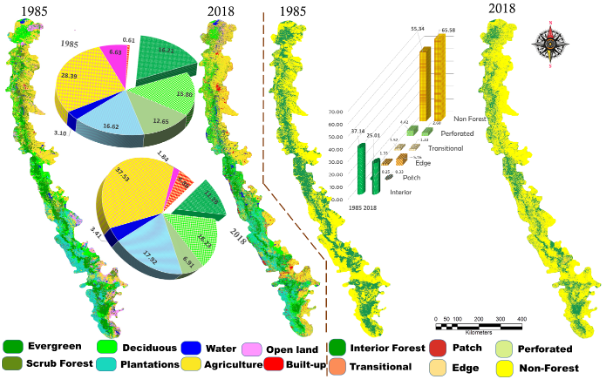
Figure 3: (a) LU dynamics of the Western Ghats, (b) fragmentation dynamics
Prioritization of ESR and recommendations for conservation:
ESR is prioritized at disaggregated levels by integrating bio-geo-climatic, land cover,
condition of ecosystems (fragmentation), ecological, hydrological, and social variables with
the assignment of weights based on the extent and condition of an ecosystem. The following
sections provide detailed information on weight assignment to each variable.
Landscape status:
The extent and condition (fragmentation) of forests depict the landscape status.
Spatiotemporal analyses of LU indicate a significant loss in the forest cover across the
states of Maharashtra, eastern parts of Tamil Nadu, western parts of Kerala, and Goa.
Current forest cover is confined to well-managed reserve forests, and protected areas (PAs).
The weights are assigned as per the geographical extent of forests. Figure 4a highlights
that grids corresponding to the Western Ghats region in Karnataka and Kerala have > 60%
forest cover. The weights are assigned for the grids as per the extent of the forest cover
(Figure 4b). Similarly, grids corresponding to protected areas and well-managed reserve
forests have >60% extent of contiguous or intact forests (Figure 4c), and Figure 4d
indicates the weights assigned to grids based on the condition of forests (the extent of
intact or interior forests).
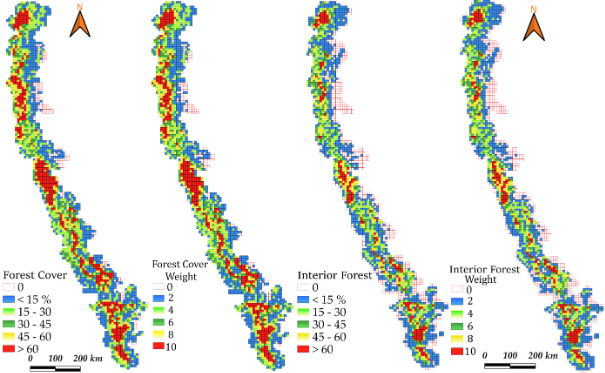
Figure 4. (a) Forest cover, (b) weights, and the (c) extent of intact/interior forests with (d) weights
Ecology:
Ecological status has been assessed by considering species endemism (flora, fauna), threat
status of species, the spatial extent of protected areas, carbon sequestration potential
(based on the terrestrial biomass and soil carbon), etc. Biodiversity in the ecologically
fragile Western Ghats is accounted for through field investigations coupled with the data
mining of published literature and- research papers published in peer-reviewed international
journals, biodiversity portals (of the respective State), administration reports, and forest
department management plans. The Western Ghats biodiversity database has 29047 records
covering flora species across diverse forest types, compiled based on field investigation
and reviewing 450 literature. The fauna database has 13878 records covering multiple
categories (taxa) collected through the literature review (400 literature). The data
analyses reveal that the Western Ghats are endowed with rich biodiversity, evident from the
occurrence of 5000+ species of flowering plants (38% endemics), 330 butterflies (11%
endemics), 197 reptiles (62% endemics), 529 birds (4% endemics), 161 mammals (12% endemics),
335 fishes (41% endemics) and 248 amphibians (75% endemics). Hence, conserving ecologically
sensitive regions is essential for sustaining diverse food and medicine. Endemism and IUCN
(International Union for Conservation of Nature) conservation status is considered for
weight with respect to flora and fauna variables. Endemic flora includes Hopea erosa,
Vateria indica, Poeciloneuron pauciflorum, Memecylon sisparense, Actinodaphne campanulata,
Actinodaphne lanata, Artocarpus hirsutus, Cinnamomum agasthyamalayanum, Cinnamomum
malabatrum, Diospyros atrata, Litsea bourdillonii, Litsea hookeri, Symplocos anamallayana,
Psychotria globicephala. Holigarna grahamii, etc., which are mostly confined to the southern
Western Ghats. Weights were assigned to grids based on the frequency distribution of endemic
species considering mean (µ) and standard deviation (σ) as 10 for grids with
endemic/threatened species >µ+2σ, 8 to grids with endemic/threatened species in the range
µ+2σ and µ+σ, 6 for grids of endemic/ threatened species µ+σ and µ, 4 for grids with
endemic/ threatened species < µ, and 2 for grids with the prevalence of only non-endemic
species. The central and southern Western Ghats account for 227+ endemic trees belonging
to 37 families. The dominant families of endemic flora include
Rubiaceae, Lauraceae,Anacardiaceae, Meliaceae,
etc. Critically endangered and vulnerable fauna includes
thomassi, Horalabiosa arunachalami, Indirana gundia, Rhacophorus
pseudomalabaricus, Fejervarya murthii, Philautus kaikatti, Ardeotis nigriceps, Cnemaspis
sisparensis, Gyps indicus, Martes gwatkinsii, Macaca Silenus, Millardia kondana, Viverra
civettina
, etc., and Figure 5a-d depicts the weights assigned based on endemic
species
distribution and IUCN status.
National Parks, Wildlife Sanctuaries, Conservation Reserves, etc., are intended to conserve the sensitive flora/fauna under the protected area (PA) network through a regulatory framework (Ramachandra et al., 2018a). Globally, PA networks have been established as a part of systematic conservation planning, which ensures the conservation of a sample or all biodiversity (ex., species or habitats) and geodiversity over a landscape (Jalilian et al., 2021). PAs have been notified under the provisions of the Wild Life (Protection) Act, 1972, and management is governed considering the anthropogenic pressure on wildlife and other threatened taxa by a set of environmental legislation such as the Indian Forest Act, 1927, Forest (Conservation) Act, 1980, Environment (Protection) Act, 1986 and Biological Diversity Act, 2002, the Scheduled Tribes and Other Traditional Forest Dwellers (Recognition of Forest Rights) Act, 2006, etc. PA network constitutes a protected corridor for wildlife, connecting two or more habitat patches previously connected but isolated due to forest fragmentation and anthropogenic activities. The Western Ghats region has about 7953 km2 area under PAs, constituting 5% of its geographical area, out of which 39 are major PAs. They are safeguarding numerous species and shielding them from extinction. The higher weight (10) is assigned to grids covering Pas across states (Figure 5a-b). Nilgiri Biosphere Reserve (NBR) with a spatial extent of 5000 km2 spread across the Western Ghats regions of three states (Kerala, Karnataka, Tamil Nadu). NBR consists of the Western Ghat's highest mountain peaks and plateaus, with an elevation ranging from 1700-2600 m and 500-7000 mm rainfall. The mountain tops in these regions supporting a wide variety of biota are covered with grasslands of diverse species. Clumps of evergreen species with stunted trees, popularly known as “sholas,” are present in the valleys. NBR region alone has 3,300 angiosperm species, of which 132 are endemic, and 19 are listed in the IUCN Red List of threatened species. NBR has the distinction of an International Biosphere Reserve situated in the Nilgiri hill range, established as a World Heritage Site by UNESCO in 2012. The major PAs in this region include Aralam, Silent Vally, Mudumalai, Mukurthi, Nagarhole, Bandipur, Wayanad, Karimpuzha, and Sathyamangalam. Grids corresponding to NBR were assigned higher weights (Figure 6c).
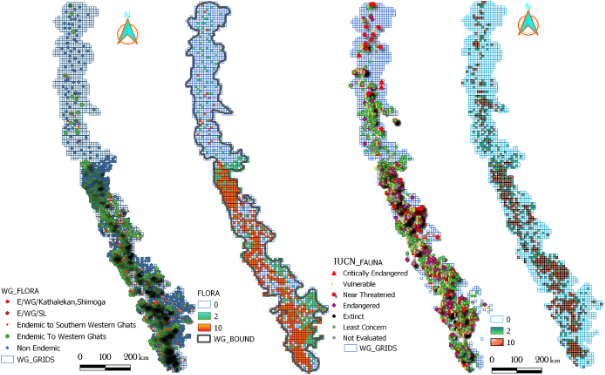
Figure 5: (a) flora distribution with (b) weights amd (c) fauna with (d) weights
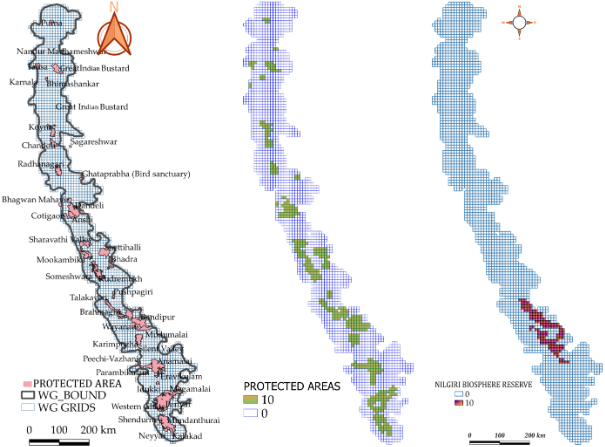
Figure 6: (a) PAs, with weight and (c) NBR and their corresponding weights
Carbon sequestration is another key ecosystem function variable and reveals ecological condition, which is quantified by considering above-ground and below-ground biomass across various forest ecosystems. Biomass was assessed based on (i) vegetation survey: through transect cum quadrat sampling techniques with the field-based measurements of GBH (girth at 130 cm) collected across the forests of the Western Ghats, (ii) published literature: based on the standard experiments covering above-ground biomass, below-ground biomass estimations. The field estimations were carried out across the diverse forest types covering around 300 transects in Uttara Kannada, Shimoga, Chikmagalur, Kodagu, Dakshina Kannada, and Udupi. Empirical equations used for biomass estimation across forest cover types are based on field experiments integrated with literature (Ramachandra and Bharath, 2019b). Carbon sequestration is accounted for 50% of the biomass. Grids corresponding to the Sahyadri region of Kerala, and Karnataka, depict higher carbon storage (Figure 7a). Grids of the eastern part of Maharashtra show lower carbon sequestration due to sparse tree cover. The weights were assigned based on the carbon sequestration potential (Figure 7b).
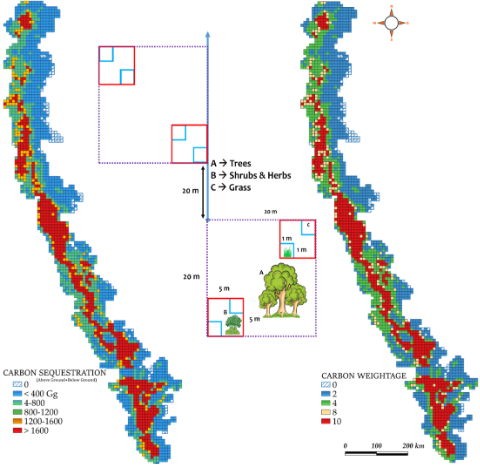
Figure 7: (a) Carbon sequestration, and (b) carbon weights
Geo-Climate :
Topography and climatic factors such as elevation, slope, lithology, geology, temperature,
and rainfall play a crucial role in maintaining the moisture of a forest landscape and
influencing species diversity. The Western Ghats have eight distinct soil groups of highly
productive types that support diverse vegetation and agriculture activities (Figure 8a).
Weights were assigned to grids based on the water-holding capacity of the soil (Figure 8b),
as soil moisture has a significant role in sustaining species, maintaining richness and
distributions, which influences the uptake of water by plants and productivity (Deng et al.,
2016). Soils that hold higher moisture would support diverse vegetation and sustain
vegetation in the absence of rainfall. Grids covered by Terai soil, and Deep Black soil,
were assigned higher weights, and Red Sandy soil, and Coastal soil, were given the least
weight. The lithology of the region explains the underlying rock, which is also a critical
factor in determining the distribution of species habitats (Figure 8c). Lithology provides a
distinct association among the areas and geological outcrops, which helps to connect an
area's geology and physical geography along with its biological diversity weight (Ewers and
Didham, 2008). The northern half of the Western Ghats comprises the Deccan Trap
(Cretaceous-Paleocene lava flows), the central part by Dharwar schist belts, and the
southern part Precambrian charnokites, granites, and gneisses. To the east of the Western
Ghats is the Deccan plateau, made of Deccan trap in the north, and Precambrian rocks in the
south and southern half are designated as the Mysore Plateau. The weights assigned based on
the distinct classification are depicted in Figure 8d.
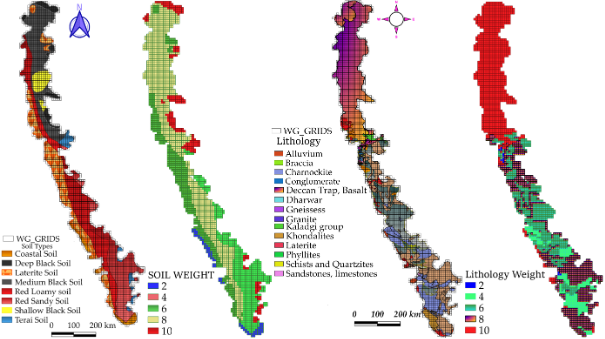
Figure 8: (a) Soil with (b) weight and (c) Lithology with (d) weight
The continuous mountain escarpment of Western Ghats with undulating topography has a range of elevation gradients, which forms critical for climate and biodiversity. Overall, elevation in this region ranges from 0 to 2693 m. The highest peak is Anamudi (2695m), located to the south of the Palghat gap, followed by Doddabetta (2636m) in the Nilgiris, to the north of the gap. The elevation map is generated using Shuttle Radar Topography Mission (SRTM) global one arc second Data. The regions with steep slopes and high altitudes are vulnerable, and large-scale land cover changes induce higher mudslides and landslides, likely to be eroded more easily through a trigger of high-intensity rainfall. Incidentally, these least resilient regions constitute a vital habitat to diverse biota (flora and fauna) and are ecologically fragile or environmentally sensitive. Considering their sensitiveness, higher weight is assigned to areas of more significant elevations (Figure 9a,b). The slope map is generated from the SRTM data set and used for prioritization. The rate of change (delta) of the surface in the horizontal (dz/dx) and vertical (dz/dy) directions from the center cell determines the slope. Slope values are (measured in degrees) extracted using the slope algorithm (Burrough et al., 2015) as given in equation 4,
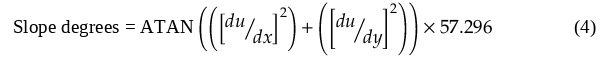
where du/dx is the rate of change in the x-direction; du/dy is the change in the y-direction; final values are expressed as percentages. Grids corresponding to the Western Ghats depict diverse slopes as easterly slopes are gentle, but the westerly slopes are steep, forming long escarpments, particularly in Maharashtra and Northern Karnataka. The analysis has considered the normalized slopes within each grid and assigned weight from 0 (least slope) to 10 (high slope) (Figure 9c,d).
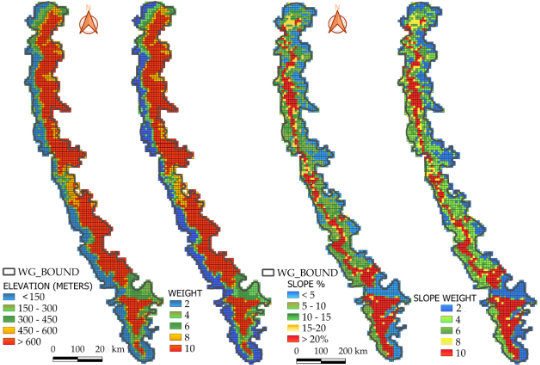
Figure 9: (a) Elevation, with (b) weight, (c) Slope, with (d) weight
Regional climatic conditions are expressed by rainfall and temperature variables, which can play a decisive role in determining community structure, functions, and species distributions (Peters et al., 2012). Rainfall is considered a critical and limiting factor regarding forested landscapes in terms of community composition and structure (Bell et al., 2014). The average rainfall and temperature are assessed using Global databases (NCAR and Princeton University) and validated through comparison with the surface measurements of ground-based monitoring stations of the regional climate datasets (IMD, KSNDMC), which show 90% similarities. Spatial variations of rainfall and temperature with the corresponding weights are presented in Figures 10a and 10b, respectively. Temperature shows many variations across the grids, and rainfall analysis shows that the central Western Ghats receives an average rainfall of over 2500 mm and tends to decline to less than 1500 mm towards northern portions. Montane rain forests cover the southern regions, tropical and subtropical moist broadleaf forests at the western slopes, and rainfall ranges from 3500 mm to 7000 mm per year. Regions/grids covered by high forest cover depict relatively lower temperatures than non-forested regions, and weight was assigned to grids based on the temperature profile (Figure 10c,d).
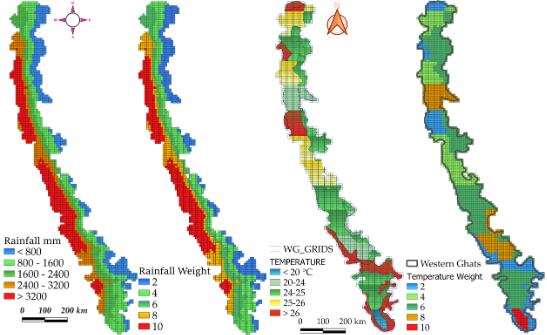
Figure 10: Spatial variation in (a) rainfall with (b) weight, (c) temperature with (d) weights
Hydrology:
The major peninsular rivers like the Godavari, Krishna, and Cauvery originate in the Western
Ghats and flow across the country along with their numerous tributaries and finally
discharge into the Bay of Bengal. The west-flowing rivers are equally productive and support
the rich biota (flora, fauna), agriculture (croplands and horticulture) activities, and
finally, discharge into the Arabian Sea. The numerous streams in the mountainous parts of
the Western Ghats contribute a large quantum of water to the main rivers. The stream
frequency, i.e., the number of stream segments per unit drainage area (usually per square
kilometer), is assessed to understand the density of the streams across the grids, which
also indicates the water availability and condition of the basin. Dense networks have high
stream frequencies and vice versa. Based on the estimated stream frequency values, the
region was grouped as those with low (< 9.5 streams/sq. km), moderate (9.5–19.5
streams/sq.
km), high (19.5–29.5 streams/sq. km), and very high stream frequency (> 39.5 streams/sq.
km). Stream frequency is directly related to the degree of division (Prabhakaran et al.,
2018) and runoff (Pankaj and Kumar, 2009). The low value of stream frequency indicates
less permeable subsoil and a gentler gradient of the catchment area (Rai et al., 2018).
Higher stream frequency with rich native vegetation increases permeability and
infiltration capacity. The grids having thick interior forest cover depicted good stream
frequency and were assigned a weight of 10, especially Kerala, and Karnataka portions,
and for the rest of the regions, weights were assigned based on the frequency gradient
(Figure 11a,b). For centuries, dams and reservoirs have been constructed as a management
option for water resources. It is necessary to account for the negative and positive
impacts of the dams for sustainable planning and resource management. The construction
of reservoirs affects the spawning, and migration of aquatic species, with alterations
in the temperature of water, salt and oxygen distribution, discharge of toxic matters
(pesticides, toxic metals, etc.), and their concentration in a food chain affecting wild
biota. Dams contribute to the national economy through irrigation, drinking water
supply, flood control, electricity generation, fishing, tourism, etc. (Tahmiscioğlu et
al., 2007). There are environmental impacts due to the implementation of dams but
accounted for in the current analyses considering the social benefits and sensitizing
the decision-makers to mitigate degradation in the reservoir catchment areas. The weight
has been assigned based on the reservoir’s storage and catchment area characteristics
(Figure 11c,d).
A comparative assessment of people’s livelihood has been made with soil water properties
and water availability in the respective catchment across four river basins in the
central Western Ghats (Ramachandra et al., 2020). The result shows that streams are
perennial when the catchment is covered with > 60% vegetation of native species, which
have higher soil moisture and groundwater than catchments (of seasonal streams) during a
dry spell in a year. The higher soil moisture due to water availability during all
seasons facilitates farming of commercial crops with higher economic returns to the
farmers, unlike the farmers who face water crisis during the lean season. The study
emphasizes the need for conservation endeavour to maintain native vegetation in the
catchment, highlighting its potential to support people’s livelihood with water
conservation at local and regional levels. Plantations, croplands and horticultural
crops have been considered for the valuation in the select catchments of perennial and
seasonal streams. Plantation crops (viz. areca nut, coconut, banana, beetle leaf, and
pepper) are the major income-generating products in the catchment of perennial streams.
A total amount of Rs. 3,11,701 ha-1 yr.-1 (year 2009-10) gross average income was
generated from the plantation crops against an average expenditure of Rs. 37,043 ha-1
yr.-1, (mainly for plantation maintenance), yielding a net profit of Rs.2,74,658 ha-1
yr.-1. On the contrary, for the catchment of seasonal streams (where both plantation and
rice fields were considered for income calculation), the average gross income generated
was Rs. 1,50,679 ha-1 yr.-1 against the expenditure of Rs. 6474.10 ha-1 yr.-1 for
plantation maintenance and field preparation (Ramachandra et al., 2020).
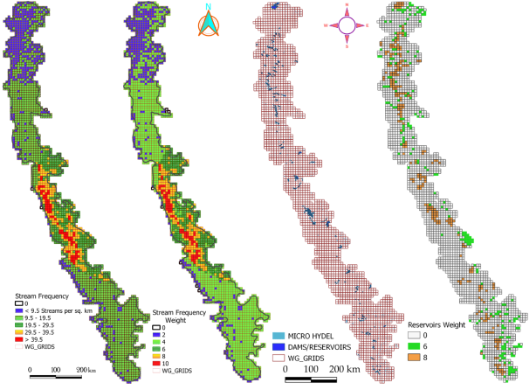
Figure 11: (a) Stream frequency with (b) weight, (c) reservoir with (d) weight
Energy:
The Western Ghats region's energy prospects have been analyzed for renewable energy
potentials such as solar, wind, and bioenergy. Global data signifying solar and photovoltaic
PV power potential has been collected using consistent high-resolution data layers from the
ESMAP portal (ESMAP, 2020). The long-term energy availability of solar resource potential
has been estimated from a region's global horizontal irradiation (GHI). GHI integrates
direct and diffuse irradiation components received by a horizontal surface in kilowatt-hours
per square meter (kWh/m2). GHI data of annual average was considered a simplified
approximation that allows comparing the natural conditions for implementing any PV
technology without considering a particular technical design and mode of operation. The
entire Western Ghats region has good solar potential (>5 kWh/m2), except for some
of the
grids of Kerala high altitude regions (Kottayam, Idukki, Ernakulam). Weights were assigned
based on the grid level GHI potential across the region (Figure 12a,b). Wind energy is a
cost-effective and clean fuel source and another form of solar energy. The wind energy
potential was analyzed based on high-quality and high-resolution average wind speed data
measured at m/s-meters per second (available at 10 m, 50 m, 100 m, 200 m) from the global
wind atlas. The data shows the region's eastern part has higher potential (>3.5 m/s), and
the grids at the central and southern parts depict moderate potential. Weights were assigned
based on the wind energy potential (Figure 12 c,d). Bioenergy incorporates many potential
feedstocks, conversion processes, and energy applications, easily integrated with existing
infrastructure. It associates strongly with the agriculture, forestry, and waste management
sectors, and its prospects are linked to the growth of a broader bio-economy. Bioenergy can
be supplied and used sustainably, contributing to climate change mitigation. Bioenergy
potential across the grids was assessed to reduce or remove the impact of GHG-intensive
fuels on the environment. The northern Western Ghats region grids depict more significant
potential than the southern Western Ghats, and weights were assigned based on the potential
(Figure 12e,f).
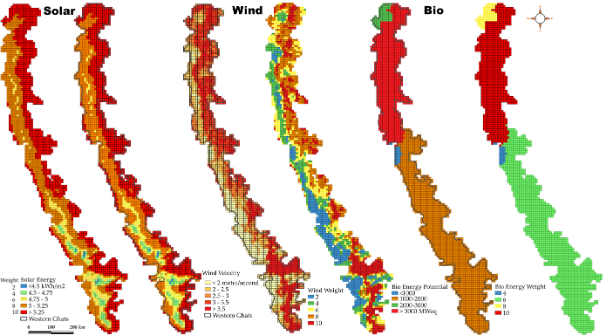
Figure 12: Renewable energy prospects of the Western Ghats and weight
Social aspects:
Uncontrolled population growth in forested landscapes induces the exploitation of forest
natural resources for numerous purposes, which will have irreversible changes on forest
structure, causing an imbalance in the carrying capacity of forest resources (Misra et al.,
2014). The rapid population growth will force forest degradation, increase resource
consumption inequality, and intensify waste production, emissions, and pollution (Mote et
al., 2020). The population density at the grid level for the Western Ghats region has been
analyzed, and weights are assigned, as shown in Figures 13a,b. The Western Ghats regions in
Maharashtra and Kerala state depict higher population pressure than the central Western
Ghats (Karnataka).
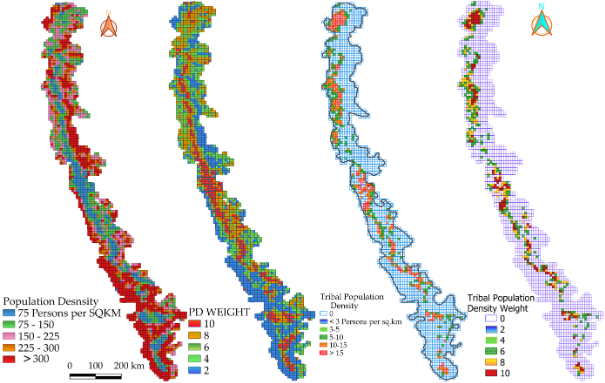
Figure 13: Spatial illustration of (a) population with (b) weight, (c) tribal population densities with (d) weight
Tribal settlements indicate primitive traits with distinctive cultures, and geographical isolation, which play a critical role in forest protection. Tribal groups like the Soligas, Kunubis, Gowlis, Kumbris, Kodavas, Bhil, Warli, Gond, Kokna, Korku, Madia, Koli Dhor, Kulvadi Marathi, Marati, Gond-Madia, Katkari, Oraon, Siddis, Kattunayakans, Gowdalu, Hasalaru, Velips, Dhangars, Badagas, Todas, Kotas, Irullas, Kurumbas, Jenu Kuruba, Kuruchiyans, Kadar, Melakudiya, Muthuvan, Malaya, Mannan, Malasar, Malai Pandaram, Kani, Paniyas, Adiyans, Edanadan Chettis, Allar, Malayan, Mudukar, Yerava, Kotwalia, Koragar, Maradi, Kattunaikkar, Mullukkurumar, Adiyar, Kanduvadiyar, Thachanadar, Kanaladi, Irular, Cholanaikkar, Aranadan, Kadar, Malamalasar etc., are native to the Western Ghats forests (Rajan et al., 2005; Morlote et al., 2011; Roy et al., 2015; Bandi, 2020). Weights are assigned to grids based on the density of tribal populations (Figure 13c,d).
Estuary:
Estuaries are highly dynamic and productive ecosystems in the transition between freshwater
with the tidal influence generating salinity gradients. These ecosystems are endowed with a
variety of habitats, and the open coast has diverse ecological communities of plants and
animals. Estuarine ecosystems provide a range of valuable ecosystem services for humankind,
such as consumptive direct use values (ex., raw materials, food, fodder), non-consumptive
direct use values (ex., tourism, recreation, education, and research), and indirect use
values (ex., shoreline protection, erosion control, water catchment and purification,
maintenance of beneficial species, and carbon sequestration) with cultural, commercial and
recreational significance (Barbier et al., 2011; Boerema and Meire, 2017; Mesta et al.,
2013; Thrush et al., 2013). The ecological importance and services of the estuaries formed
by west-flowing rivers were assessed through a literature review (Qasim and Gupta, 1981;
Nair et al., 1983; Nakhawa et al., 2017; Ramachandra et al., 2019b; Karthik et al., 2020)
and weight has been assigned as depicted in Figure 14a,b.
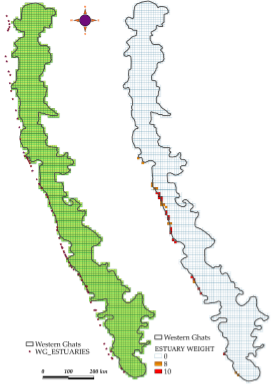
Figure 14. Estuaries and weight based on the ecological importance and services
Ecological significance and need for conservation:
Ecological sensitivity at disaggregated levels is assessed grid-wise by aggregating weights
of various themes. Grids are grouped into four distinct groups based on the frequency
distribution of aggregated weights: ESR 1 (aggregated scores > µ+2σ), ESR 2 (for grids
within µ+2σ and µ+σ), ESR 3 (for grids with µ+σ and µ), and ESR 4 (grids with values <
µ).The analysis highlights that 755 grids covering an area of 32.4% are under ESR-1, 373
grids covering 16% are in ESR-2, and 789 grids (34% spatial extent) in ESR-3 412 grids
covering17.7% area are in ESR-4 (Figure 15a). Grids corresponding to ESR-1 and 2
represent ecologically fragile regions with the highest degrees of vulnerability and are
endowed with rich natural resources and higher biodiversity that sustains people’s
livelihood. ESR-3 depicts moderate sensitivity, whereas ESR-4 demarcates the grids of
the least ecological significance with the least resource availability. State-wise
analyses highlight that Southern states such as Kerala, and Karnataka, located in the
latitudinal gradient of 8 -14° of the Western Ghats with the higher composition of
endemic and threatened taxa, cover a wider spatial extent in ESR-1, and 2 regions. The
major part of Maharashtra and Tamil Nadu state landscapes, are in ESR-3, and 4. Figure
15 depicts ESRs at the village level. State-wise, village-level ESR analyses indicate
that there are (i) 345 ecologically vulnerable villages (of 1037 villages) in Gujarat
state, (ii) 2311, and 2900 villages under ESR-1, and 2 in Maharashtra State, (iii) 771,
and 1111 villages (of 4911 villages) under ESR-1 and ESR-2 in Karnataka, (iv) 163, and
49 villages (of 841 villages in the Western Ghats) under ESR-1, 2 in Kerala, 261, and
(v) 144 villages (of 1407 villages) under ESR-1, and 2 in Tamil Nadu (Figure 16 and
Annexure-I: 1.1, 1.2, and 1.3).
Grids covering ESR-1 and 2 signify highly vulnerable and fragile regions with a high degree
of ecological sensitivity and are endowed with rich ecology (evident from the distribution
of endemic and threatened species of biodiversity), hydrological regime (occurrence of
perennial streams supporting agriculture and horticulture with higher productivity) and an
array of ecosystem services including the provision of diverse food and medicine sustains
people’s livelihood. ESR-3 depicts moderate sensitivity, ESR-4 with the least sensitivity,
and cluster-based developmental projects based on the natural resources available in the
region are to be implemented to benefit local people. ESR-1 and 2 are ecologically
susceptible regions with higher ecological fragility; hence, the region's ecological
integrity needs to be preserved without anthropogenic interventions. These regions have
demonstrated their utility by (i) supporting the livelihood of people through the sustenance
of water (due to the presence of perennial streams), (ii) the presence of diverse
pollinators resulting in efficient pollination leading to higher crop productivity, (iii)
lower instances of mudslides, and landslides (as roots of diverse vegetation provide binding
of soil) and hence ESR1 and ESR 2 are to be considered as restricted (no-go) areas for any
large scale developmental activities. Only environmentally friendly initiatives that benefit
local people be taken up, which are listed in Table 4. Annexure-2 provides a brief overview
of earlier reports on Western Ghat's ecological sensitivity.
|
State Name |
Area (Km2) |
ESR-1 |
ESR-2 |
ESR-3 |
ESR-4 |
||||
|
Km2 |
% |
Km2 |
% |
Km2 |
% |
Km2 |
% |
||
|
Gujarat |
6045 |
2160 |
36 |
1552 |
26 |
1126 |
19 |
1208 |
20 |
|
Goa |
2409 |
1267 |
53 |
686 |
28 |
410 |
17 |
47 |
2 |
|
Karnataka |
42021 |
23277 |
55 |
7123 |
17 |
8779 |
21 |
2842 |
7 |
|
Kerala |
26240 |
13401 |
51 |
1483 |
6 |
5453 |
21 |
5904 |
23 |
|
Maharashtra |
60323 |
12958 |
21 |
14668 |
24 |
28710 |
48 |
3987 |
7 |
|
Tamil Nadu |
22961 |
10085 |
44 |
2135 |
9 |
4013 |
17 |
6728 |
29 |
|
Total |
160000 |
63148 |
39 |
27646 |
17 |
48490 |
30 |
20716 |
13 |
The ESR framework proposed here forms a foundation for conservation and facilitates addressing the various developmental issues through an established scientific basis. It acts as a spatial decision support systems (SDSS) tool for framing conservation approaches through an enhanced knowledge base on landscape ecology and advanced technological support from GIS, remote sensing, etc. Understanding ecological sensitiveness at disaggregated levels aids in evolving sustainable developmental plans with minimal unplanned developmental activities, which helps to conserve ecologically susceptible regions.
| SNO | ACTIVITIES | Ecological Sensitive Regions | |||
| ESR-1 | ESR-2 | ESR-3 | ESR-4 | ||
| 1 | ENERGY | ||||
| 1. Solar (Rooftop) | ✓ | ✓ | ✓ | ✓ | |
| 2. Wind power | × | ✓ | ✓ | ✓ | |
| 3. Bioenergy | × | ✓ | ✓ | ✓ | |
| 4. Coal-based (Thermal power) | × | × | × | × | |
| 5. Gas or liquid fuel-based | × | × | × | ✓ | |
| 6. Hydropower (Major) | × | × | × | × | |
| 7. Hydropower (Micro) | × | × | × | ✓ | |
| 8. Nuclear power | × | × | × | × | |
| 2 | FORESTS | ||||
| 1. Land-use changes (Forest to non-forest usages) | × | × | × | × | |
| 2. Monoculture plantations | × | × | × | × | |
| 3. Extraction of medicinal plants (with strict regulations) | × | × | ✓ | ✓ | |
| 4. Forest improvement through VFCs | ✓ | ✓ | ✓ | ✓ | |
| 5. NTFP collection | ✓ (Strict regulation) | ✓ | ✓ | ✓ | |
| 3 | AGRICULTURE | ||||
| 1. Agroforestry | ✓ | ✓ | ✓ | ✓ | |
| 2. Organic farming | ✓ | ✓ | ✓ | ✓ | |
| 3. Land-use change / Encroachments | × | × | × | × | |
| 4. Genetically modified crops | × | × | × | × | |
| 5. Animal Husbandry | ✓ | ✓ | ✓ | ✓ | |
| 4 | HORTICULTURE | ||||
| 1. Organic farming | ✓ | ✓ | ✓ | ✓ | |
| 2. Nitrogen and Phosphorus (N and P) fertilizers | × | × | × | ✓ Dosage as prescribed by Agriculture department | |
| 3. Endosulfan | × | × | × | × | |
| 4. Pesticide | × | × | × | ✓ | |
| 5. Watermelon and Muskmelon farming | × | ✓ | ✓ | ✓ | |
| 6. Ginger cultivation | × | ✓ | ✓ | ✓ | |
| 5 | INDUSTRIES (Large scale) | ||||
| 1. Agro-processing industries | ✓ | ✓ | ✓ | ✓ | |
| 2. Information Technology industries (IT) | × | × | ✓ | ✓ | |
| 3. Red category (Polluting) industries | × | × | × | × | |
| 4. Garment industries | × | × | ✓ | ✓ | |
| 5. New establishment of Industries | × | × | × | ✓ (Allowed only after critical review by local stakeholders and experts) | |
| 6. Nonpolluting (Green) Industries | × | × | ✓ | ✓ | |
| 6 | INDUSTRIES (Small scale) | ||||
| 1. Garment industries | × | ✓ | ✓ | ✓ | |
| 2. Domestic (Home-based) industries [Ex: Papad] | ✓ | ✓ | ✓ | ✓ | |
| 3. Mango processing | ✓ | ✓ | ✓ | ✓ | |
| 4. Areca nut processing and Coir industries | × | ✓ | ✓ | ✓ | |
| 5. Milk products and processing | ✓ | ✓ | ✓ | ✓ | |
| 6. Dry fruits and Spices | ✓ | ✓ | ✓ | ✓ | |
| 7. Fruit processing [Ex: Kokum Juice (Garcinia indica)] | ✓ | ✓ | ✓ | ✓ | |
| 8. Fish products processing | ✓ | ✓ | ✓ | ✓ | |
| 9. Bee keeping and bee nurseries | ✓ | ✓ | ✓ | ✓ | |
| 10. Pongamia plantations for biofuel (in private lands) | × | ✓ | ✓ | ✓ | |
| 11. Bio pesticides manufacturing | × | ✓ | ✓ | ✓ | |
| 12. Poultry farms and powdered eggs | × | ✓ | ✓ | ✓ | |
| 13. Vegetable dyes; fruits and vegetables preservation | ✓ | ✓ | ✓ | ✓ | |
| 14. Medicinal plants cultivation and processing | ✓ | ✓ | ✓ | ✓ | |
| 15. Aromatic plants and essential oil distillation; orchids and cut flowers harvesting industries | × | ✓ | ✓ | ✓ | |
| 7 | TOURISM INDUSTRY | ||||
| 1. Ecotourism | × | ✓ | ✓ | ✓ | |
| 2. Organic village and homestay | ✓ | ✓ | ✓ | ✓ | |
| 3. VFC managed tourism | ✓ | ✓ | ✓ | ✓ | |
| 4. VFC managed homestay tourism in higher forest cover regions and protected areas | × | ✓ | ✓ | ✓ | |
| 5. Arts and handicrafts museum and trade center | ✓ | ✓ | ✓ | ✓ | |
| 8 | MINING AND MINERAL EXTRACTION | ||||
| 1. Iron ore | × | × | × | × | |
| 2. Manganese | × | × | × | × | |
| 3. Bauxite | × | × | × | × | |
| 4. Limestone | × | × | × | ✓ | |
| 5. Quartz | × | × | × | ✓ | |
| 6. Sand extraction (on sustainable basis by Ban on exporting) | × | × | ✓ | ✓ | |
| 9 | WASTE DISPOSAL | ||||
| 1. Hazardous waste processing units | × | × | × | × | |
| 2. Solid waste disposal | × | × | × | ✓ (For composting and manure preparation) | |
| 3. Liquid waste discharge | × | × | × | ✓ (Treatment plants (STP) for processing) | |
| 4. Recycling and waste processing and units | × | × | × | ✓(compliant with PCB) | |
| 10 | TRANSPORTATION | ||||
| 1. Roads and expressways | × | × | × | ✓(Allowed only after strict EIA) | |
| 2. Rail and freight corridors | Subject to EIA with the strict regulation and social audit | ||||
| 3. Up-gradation of existing infrastructure | × | × | ✓(Subject to EIAs, strict regulation and social audit) | ✓ | |
| REMARKS | |||||
|
|||||
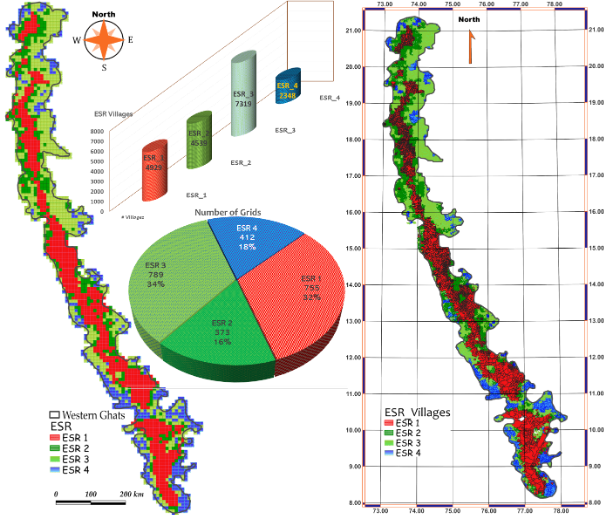
Figure 15: (a) Grid wise and (b) village wise ESRs of the Western Ghats
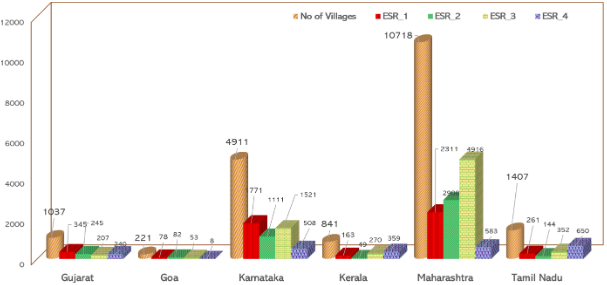
Figure 16: Statewise ESR distribution of villages that are part of the Western Ghats
Discussion
(i) Impact of LULC changes and forest fragmentation on ecology, biodiversity, and human
wellbeing
Large-scale land cover changes due to unplanned developmental activities have been inducing
changes in the landscape structure with the fragmentation of forests. Loss of biodiversity
due to fragmentation leads to the loss of the ecosystem’s ability to provide goods and
services. The fragmentation of forest ecosystems' impacts on ecology is well acknowledged
worldwide. The influence of fragmented edges is estimated to be up to 300 m on the interior
forest cover and systematically causes an imbalance in the canopy and height of the trees
and aggravates mortality. Edges will create temperature gradients that typically influence
up to 5-100 m inside the forest, resulting in alterations in microclimate conditions, loss
of humidity, soil moisture, impact regeneration, and seed dispersal (Hennenberg et al.,
2008;). Studies (D'Angelo et al., 2004) have reported that tree mortality would increase
with more edges and canopy gaps due to the higher prevalence of winds. Edges stimulate the
regeneration of pioneer or exotic species, and intense velocity winds pushed from edges will
uproot the native trees (Laurance et al., 2006). Habitat fragmentation has been a major
threat to biodiversity loss in the tropics, impacting the migration corridors and food
availability for invertebrates and other biotas. The forest cover loss in migratory
corridors (wildlife corridors) has intensified human-animal conflict, exposed parts of the
forest environment to external climatic conditions, and reduced the forest's ability to
support a dependent population. Species distribution across the latitudinal gradient
highlights higher occurrence of endemic tree and fauna species at 10-14 degree latitudes
corresponding to the Kerala and Karnataka portions of the Western Ghats regions (Figures 17
and 18). The spatial distribution of species across the latitudinal range signifies the
necessity of conserving habitats of endemic species to avoid further degradation. The
fragmentation in the Western Ghats will adversely impact this unique gene pool. The loss of
continuity of forest animals tends to reside in small fragments, restrict movement to
relatively narrow bands around the forest edges, and prefer inbreeding (Ewers and Didham,
2008). The consequences of fragmentation on biodiversity include a lower growth rate of
species due to resource shortage or dietary diversity, disruption of genetic exchanges
amongst wildlife populations, and a significantly high mortality rate. The Western Ghats is
the hottest hotspot of biodiversity and has been experiencing land degradation and
deforestation due to higher loss of forest cover since independence with unplanned
developmental activities and fragmented governance. Many carnivore taxa are now confined in
small fragments leading to escalation in human-animal conflicts apart from the inbreeding
pressure and extirpation of the viable gene (Umapathy et al., 2011; Ramachandra and Bharath,
2019a). Especially, endemic taxa such as Lion-tailed Macaques are experiencing higher
predation due to loss of contiguity in the canopy with the fragmentation of forests.
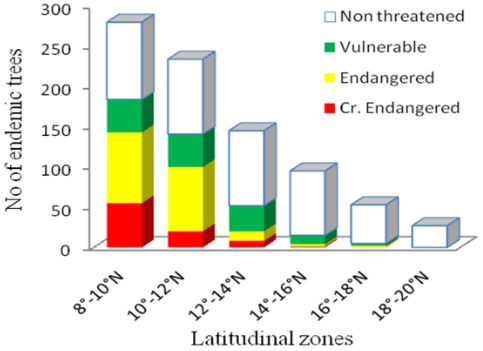
Figure 17. Latitudinal variation in the number of endemic species of flora
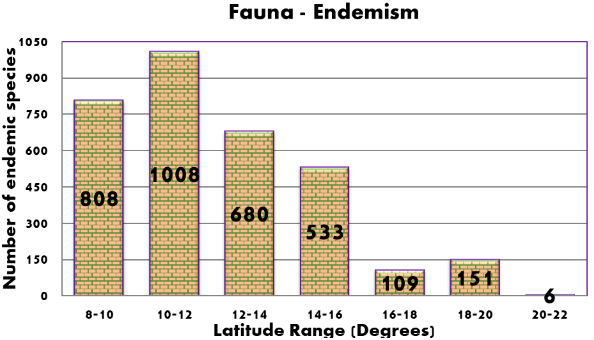
Figure 18. Latitudinal variation in the number of endemic species of fauna
(ii) LULC change-induced human-animal conflicts
The drivers of land-use changes during the past five decades include the implementation of
large-scale developmental (hydro-electric, infrastructure, mining, etc.) projects, the
expansion of agriculture, exotic monoculture plantations, commercial (tea and coffee)
plantations, etc., which have resulted in habitat loss and fragmentation of animal corridors
(Gadgil, 2011) aggravating human-animal conflicts (Kumar et al., 2010; Padalia et al.,
2017). The significant decrease in habitat has increased animal-human conflicts, especially
with Asian elephants, tigers, leopards, etc. (Sukumar, 2006). The high conflicts are due to
the implementation of monoculture plantations in forests under the social forestry programme
by the forest department in the mid-eighties, which deprived dependent biota of food,
fodder, and water. Hence, dependent animals migrate to other locations for food and water
and raid crops with recurring conflicts. Human violent responses, including retaliatory
killings of wildlife, result in further escalation of conflict, posing severe challenges to
humans and the affected species (Barua et al., 2013). Recurring conflicts are a response to
behavioral and physiological changes in animals. It pushes particular individuals/taxa to
cope with changing environments or altered habitat conditions, affecting their survival and
fitness in the long term (Tuomainen and Candolin, 2011).
The crop depredation and higher instances of human-wildlife conflicts are mainly by 19 topmost ranked species across the Western Ghats region, including wild pig (57%), elephant (37%), and chital (8%) (Krithi et al., 2013). Based on the location and crop type, compensation for crop depredation varies from INR 9934 to INR 38,692 per hectare. Similarly, payment for livestock losses varies across the region ranging from INR 2190 to INR 12,352. Human-elephant conflicts are higher across the Kerala and Karnataka parts, accounting 58.8% of the total conflict cases in the Western Ghats (Rohini et al., 2016). Escalation in wildlife conflicts during the past two decades is mainly due to the loss of native forest cover, the increase in exotic species of monoculture plantations, forest fragmentation, and unplanned developmental activities.
Monoculture plantations replacing native forests of diverse species have deprived them of food sources for wildlife across the region, forcing them to move toward human habitation, leading to crop depredation and the prevalence of zoonotic diseases (such as monkey fever, etc.). Monoculture plantations alter ecosystem balance, (i) evident from higher instances of mudslides or landslides, (ii) conversion of perennial streams to intermittent or seasonal streams, (iii) the decline in carbon (biomass and soil) sequestration (loss of 50% as compared with native cover) and (iv) the lower net primary production (NPP), and aboveground standing biomass (Ramachandra et al., 2020b; van Straaten et al., 2015). The prolonged and complex administrative procedures for the compensation also implicitly resulted in retaliation killing wildlife. The compensation for conflicts is taxing considerable amounts of the public exchequer, and it mirrors the cost of the mismanagement of forests. In this regard, mitigating recurring human-animal conflicts requires addressing fragmentation and conserving native forests in the Western Ghats region. It is recommended to (i) enrich the dispersal corridors between the fragments patches using fruit trees to facilitate dietary diversity, (ii) maintain connectivity among canopy across linear corridors, (iii) arrest the deforestation by strict vigilance, protect fragments from further degradation, and developing forest species nurseries by involving local stakeholders (iv) enrich the degraded patches with afforestation of native species periodically for long term conservation and (v) transparency in forest governance with mechanisms for accountability of forest officials for fragmentation and land degradation of forest landscape.
(iii) Impact of LULC change on Hydrologic regime and climatic patterns
Natural forest maintains a hydrologic regime evident from the enhanced rate of infiltration,
groundwater recharge, and soil water-holding capacities. The annual surface transpiration is
reduced due to increased understory transpiration and enhanced water storage in the
subsurface. The eco-hydrological footprint of a river basin describes the hydrologic regime
for sustaining vital ecological functions considering the appropriation of water by biotic
components (including humans). The eco-hydrological footprint emphasizes the role of forests
on infiltration and evapotranspiration capabilities based on the spatial arrangement of
LULC. The absence (minimally present) of intact mature forests in the socially active
regions has led to a decline in river flow (seasonal or intermittent). Forest landscapes
with native species of vegetation aid as hydrological reserves catering to the ecological
and societal water demand of Peninsular India. Due to the sustained anthropogenic pressure
on the fragile ecosystems in the Western Ghats affects the physical integrity, biota,
hydrological regimes, bio-geo-chemical relationships, etc., resulting in water and food
security affecting people's livelihood. With the relatively higher forest cover, the Ghats
region of the Western Ghats is endowed with perennial streams and rivers. In contrast, the
eastern portions, the transition zone of Ghats, and plain lands dominated by monoculture
plantations are intermittent and seasonal streams with 6 to 8 months (Ramachandra et al.,
2020b). The absence of intact or contiguous native forests and the prevalence of patch and
edge forests (with fragmentation) in the socially active regions (increased unplanned
developmental activities with urbanization, industries, etc.) have altered the hydrologic
regime evident from the decline of rainfall and sustenance of water (perennial to seasonal
or intermittent). The streams are perennial when their catchment is dominated by vegetation
(> 60%) of native species, mainly due to infiltration or percolation, as the soil is porous
with native species. Diverse microorganisms interact with plant roots and soil, which helps
transfer nutrients from the soil to plants, and the soil is porous or permeable. Analyses of
soil samples from the catchment of perennial and intermittent streams reveal that soil in
the perennial stream's catchment has the highest moisture content (61.47 to 61.57%), and
higher nutrients (C, N, and K), lower bulk density (0.50 to 0.57 g/cc). In a catchment of
intermittent and seasonal streams, the soil had a higher bulk density (0.87 – 1.53 g/cc) and
relatively lower nutrients (Ramachandra et al., 2020b).
Due to this, water infiltrates and fills the underlying zones, namely saturated and vadose
zones, in the catchments of perennial streams. The region receives rain for about four
months, and the surface run-off during monsoon is due to the precipitation (after saturation
of underlying regions). After the monsoon recedes, the water stored in the vadose regions
and saturate zones flow laterally towards the stream for about 6-8 months (as pipe flow in
the post-monsoon period of 4 months and base flow during summer). Water infiltration allows
water storage in the saturated and vadose zones, which is crucial for water sustenance in
the streams during lean seasons. This emphasizes that vegetation helps in retarding the
water flow in the catchment by allowing infiltration. Contiguous forests of native species
moderate the local climate (through transpiration) and act as a sponge by retaining the
water, which is slowly released to the streams during the lean seasons, thereby sustaining
the water availability in the catchment to meet biotic needs throughout the year. Streams in
the catchment dominated by a single species (monoculture plantations) had adequate flow for
6-8 months. This is mainly due to lowered infiltration due to the higher bulk density of
soil, and also, the litter of monoculture plants requires a longer time for degradation.
Water availability for four months is observed in the streams of the degraded catchment with
less than 30% vegetation cover. Field investigations confirm higher infiltration (almost
twice) than transpiration in sub-catchments with intact forests of native species. There has
been an increase in surface water flow (in monsoon) and reduced flow (or no flow) during
non-monsoon in the sub-catchments associated with degraded and altered landscapes, changes
in the physical properties of soil, and local temperature. The LULC alterations due to
intense societal pressures with increasing water demands have led to a negative
eco-hydrological footprint with water scarcity ranging between 4 to 8 months (Ramachandra et
al., 2020b).
A comparative assessment of people’s livelihood shows that catchments with > 60% vegetation
with native species have a higher diversity of pollinators, soil moisture, and groundwater
than the catchment (of seasonal stream) during the year's dry spell. The higher soil
moisture due to water availability during all seasons facilitates the farming of commercial
crops with higher economic returns to the farmers, unlike the farmers who face water crises
during the non-monsoon seasons. Also, the abundant presence of diverse pollinators has
resulted in efficient pollination with a higher yield of crops. The study emphasizes the
need to conserve ecologically sensitive regions by maintaining native diverse vegetation,
highlighting its potential to support people’s livelihood with water conservation at local
and regional levels. Agriculture and horticultural crops have been considered for the
valuation in the select catchments of perennial and seasonal streams. Plantation crops (viz.
areca nut, coconut, banana, beetle leaf, and pepper) are the major income-generating
products in the catchment of perennial streams. A gross average income of Rs. 3,11,701 ha-1
yr.-1 (the year 2009-10) was generated from the plantation crops against an average
expenditure of Rs. 37,043 ha-1 yr.-1 (mainly for plantation maintenance), yielding a net
profit of Rs.2,74,658 ha-1 yr.-1. On the contrary, for the catchment of seasonal streams
(where both plantation and rice fields were considered for income calculation), the average
gross income generated was Rs. 1,50,679 ha-1 yr.-1 against the expenditure of Rs. 6474.10
ha-1 yr.-1 for plantation maintenance and field preparation (Ramachandra et al., 2020b). The
current study emphasizes the need for understanding carrying capacity and ecological
sensitivity across the river basins, which would help the water resource managers and
planners to understand water footprints and their relation with native/endemic biodiversity,
which helps in evolving the appropriate regional planning, with prudent management of
ecosystems and ensure the sustenance of ecosystem services toward sustainable
development.
The native forest cover infiltrates a large quantum of water and produces large-scale
atmospheric flux due to evapotranspiration, which plays a significant role in rainfall
patterns. Forest cover governs the rainfall quantum by generating atmospheric pressure
differences from canopy roughness and condensation (Spracklen et al., 2012). Hence,
deforestation alters a wet continent to arid conditions by interrupting these natural
processes, threatening food security (Lobell et al., 2008; Sheil and Murdiyarso, 2009).
Human-induced land degradation and deforestation reduce the latent heat flux at the
micro-level, stimulating warming and affecting the cloud formation process across the
regions. The surface warming due to the removal of native forests enhances the drying of the
boundary layer, leading to reduced clouds, enhancing the drier phase, permitting additional
downward solar radiation at the surface, and consequently causing higher instances of
warming (Bala et al., 2007). Surface warming is evident from the prevailing climate with the
current LULC changes in the Western Ghats (Ramachandra and Bharath 2019b). Assessment of
rainfall dynamics reveals a declining trend in rainfall over the southern Western Ghats
while an increasing trend in the northern Western Ghats. Kerala, Tamil Nadu states show a
decrease in rainfall ranging between 40 mm to 650 mm in the century with a decline of rainy
days of 5 to 10 days.
In contrast, the north (Maharashtra, Gujarat) showed increasing trends of rainfall ranging
from 120 to 430 mm and rainy days by 3 to 6 days (Ramachandra and Bharath 2019b). Analyses
of temperature dynamics depict a rising temperature trend across the Western Ghats.
Deforestation has increased surface temperatures and lowered the rainfall regime in the
region, causing a decline in the number of rainy days contributing to regional climate
changes with water scarcity, increasing the vulnerability to fire and vegetation dieback
(Ramachandra and Bharath 2019b). Alterations in the spatial pattern of rainfall, reduction
of rainy days, and an increase in temperature (dryness) would impact agriculture in
peninsular India, threatening food security.
(iv) Approaches for conservation and sustained livelihood options
The LULC dynamics information provides insights into land-use change and helps to understand
the impacts of habitat fragmentation, which aid in framing effective conservation and
management policies. The policies of maintaining forest contiguity would help sustain
natural resources and address the recurring problem of human-animal conflicts (due to
fragmentation of habitat). Mean annual increment (MAI) and the yearly growth rate help
assess the health and productivity of forests, indicating the condition of an ecosystem.
India's forest ecosystems have an MAI value of 0.7 m3/ha compared to the world forest
average of 2.1 m3/ha, with lower growth rates with land degradation and deforestation, due
to anthropogenic pressures and ineffective management practices. The Joint Forest Management
(JFM) initiative of MoEFCC, initiated in 1990, covering 28 states and union territories
across India, has promoted village forest protection committees (VFC) for decentralized
governance by involving local villagers. VFCs and Panchayat Raj institutions have promoted
afforestation, non-timber forest products (NTFP) collection, and marketing activities. VFCs
constituted in 170000 forest fringe villages would aid in managing 28% of India’s total
forest cover, about 22 Mha of the area under JFM (Aggarwal et al., 2009). The performance of
JFM is mixed due to lack of financial sustainability, absence of forest department support
in specific cases, lack of legal support, and absence of a decision support system. The
forest department is recommended to promote VFCs to ensure sustainable management of ESR
through native species afforestation of degraded landscapes, sustainable harvesting of NTFP,
and other activities to augment ecosystem services. Involving women and other self-help
groups in creating nurseries of native species and marketing would empower all sections of
society.
Natural forests have been aiding as lungs, and kidneys of a landscape, sustaining water as a
water tower of land, sequestering carbon efficiently, which would help achieve a net-zero
carbon economy (Harris et al., 2021). They are incredible reservoirs of biomass and carbon
stock, also aiding in reducing global warming and associated ill effects of changing
climate. The Western Ghat forests are the repository of global carbon evident from 1.62 MGg
(Million Giga Grams or Tera metric tons or Tt) of standing biomass (above-ground biomass),
which stores 0.81 MGg carbon. The southern and central regions of the Western Ghats are
endowed with diverse native forests having biomass > 1200 Gg/Ha and carbon of 600 Gg/Ha. The
soil in the Western Ghats is rich in carbon (0.42 MGg), primarily in southern and central
regions. The annual incremental biomass of 62869 Gg with a carbon sequestration potential of
31434.55 Gg per year highlights the vital role played by fragile ecosystems in maintaining
balance in the carbon cycle, and higher sequestration is in Karnataka and Kerala part of the
Western Ghats. Global Carbon trading has been proved as a potential monetary measure to
highlight the significance of forest ecosystems, which aids in sensitizing and convincing
the administration of the benefits of ecosystem conservation (Damandeep, 2017). The economic
values of sequestered carbon vary from $10 to $1000 based on various assumptions. Improving
the sequestration through afforestation of degraded forest patches will aid in achieving the
net-zero emission target (Ricke et al., 2018). Forest ecosystems of Western Ghats are worth
INR 100 billion ($1.4 billion) at $30 per tonne. The environmental ministry and other
regulatory agencies need to implement carbon credit payments to compensate for the
ecological degradation with developmental activities. Streamlining ecosystem approaches in
management through stakeholders’ active participation would minimize the degradation of
fragile ecosystems.
The conflict resolution mechanisms and active participation of stakeholders would protect
ESRs in the Western Ghats. The prudent management would positively impact vegetation,
improve the community's income and better relationship with regulatory institutions. ESR is
demarcated at disaggregated levels by integrating heterogeneous ecological, biological,
geo-climatic, and social factors. ESRs management focusing on sustainable development
requires effective resource management and opportunities to enhance the livelihood, which
aid in sound ecological conservation. The conservation plans (White et al., 2012) would
become guiding tools for sustainable development with prudent management of resources and
decision-making. The ESR framework, developed at disaggregated levels considering
significant bio-physical, geo-climatic, ecological, and social aspects, would aid as a
spatial decision support system for implementing conservation plans by the biodiversity
management committee (BMC) at Panchayath. Integration of the ESR framework in the
decision-making at decentralized levels and implementation of suggested recommendations
would ensure the sustenance of water and food for local people, which would be the dividend
for conserving ecologically fragile hotspots of biodiversity – the Western Ghats.
Western Ghats Spatial Decision Support System
(Ecologically Sensitive Regions in the Western Ghats),
Web: https://wgbis.ces.iisc.ac.in/sdss/wgsdss/index.php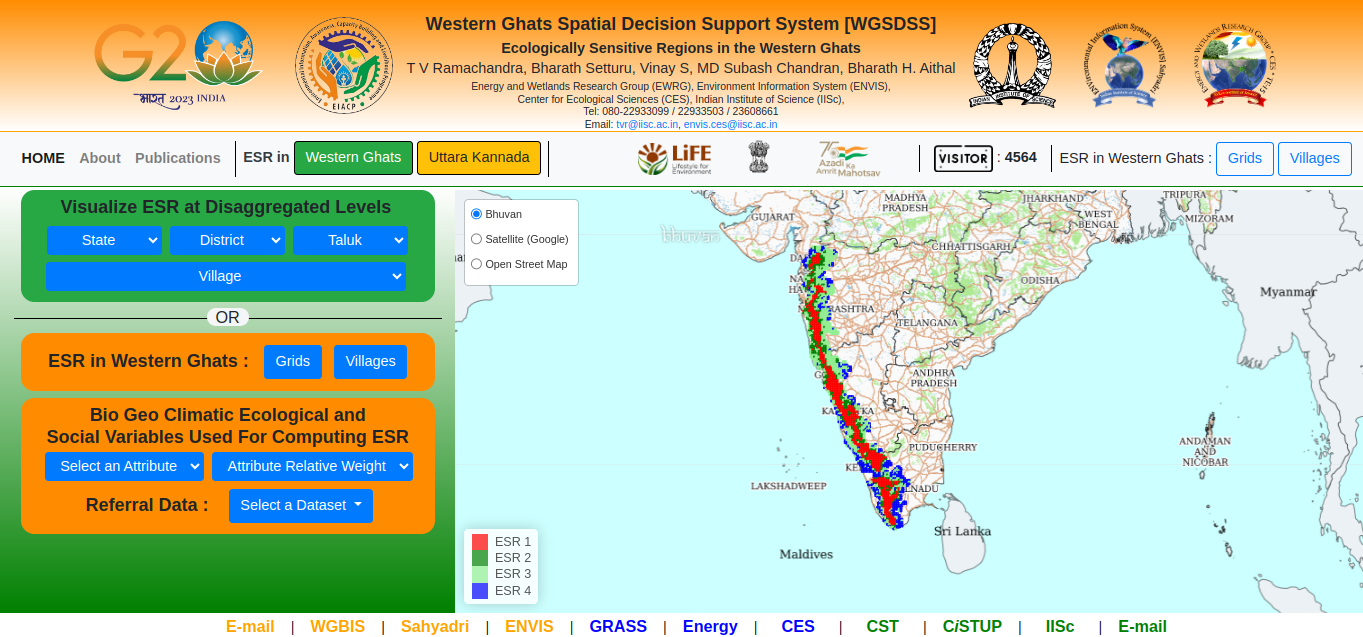
Western Ghats Spatial Decision Support System (WGSDSS) has been designed as part of the
ongoing ecological research in the Western Ghats by taking advantage of the recent advances
in information and open source web technologies through the integration of spatial with the
attribute information (bio, geo, climatic, ecological, environmental, and social variables)
at disaggregated levels. This enhances governance transparency while meeting societal needs,
which helps in the prudent management of ecologically and hydrologically vital Sahyadri hill
ranges. Visualization of ecologically sensitive regions at disaggregated levels
(grids/village) through synthesis and integration of information would enable understanding
of the current status, which are essential for effective decision-making at decenralised
levels (for example BMCs (Biodiversity Management Committees) towards sustainable management
of natural resources.
Web-based spatial decision support system (WSDSS) is designed by integrating free and open
source software (GeoServer, PostgreSQL, PostGIS, Leaflet) and integration of spatial
information of Open Geospatial Consortium (OGC) standards to carry out a multiple criteria
analysis. Features such as Web Map Service (WMS), and Web Feature Service (WFS) would help
to effectively disseminate the ecological, socio, economic, biodiversity and environmental
information. WGSDSS.
- Helps in visualizing regions based on eco-sensitiveness
- Visualize variables used for computing eco-sensitiveness
- Available at grid level (5’x5’ or 9 km x 9 km) and village levels
- Aids in decision-making at decentralized levels (BMC, local forest department, etc.)
Conclusion
The comprehensive knowledge of the ecological fragility of a region assessed at
disaggregated levels through the integration of bio-geo-climatic, ecological, and social
variables representing dynamics of socio-ecological systems, impacts, and drivers has aided
in evolving location-specific strategies for conservation. LU analyses using temporal remote
sensing data highlight the loss of evergreen forest cover of 5% with an increase of 4.5%
built-up cover and 9% agriculture area due to anthropogenic pressures. Due to unplanned
developmental activities, the evergreen forest cover has reduced from 16% to 11% from 1985
to 2018. Agents of large-scale land cover changes are power (hydroelectric and nuclear)
projects, infrastructure projects, indiscriminate mining, unscientific afforestation (of
Acacia, Rubber, Eucalyptus, Teak), and urban sprawl in the major cities such as Pune,
Coimbatore, Mangalore, Kolhapur, Karwar, etc. Mining activities across the Ghats disrupt
ecological footprints beyond the physical boundaries of mines by disrupting continuous
forest patches.
The fragmentation analysis highlights the status of forests in the Western Ghats. Over the
past three decades, interior forest cover has reduced from 37.14 to 25.01%. The loss of
12.2% in interior forest (contiguous intact) cover with an increase of 11.3% in non-forest
cover from 1985 to 2018 represents an escalation in fragmentation by affecting local
ecology. The interior forests are mainly situated in protected areas across the region. The
damage in the contiguous interior cover affects endemic taxa and habitats, resulting in
higher instances of human-wildlife conflict. Endemic taxa such as Lion-tailed Macaques are
experiencing higher predation due to loss of continuity in the canopy with the fragmentation
of forests.
Mitigating frequent human-animal conflicts requires addressing the fragmentation and
conservation of native forests in the Western Ghats region. It is recommended to (i) enrich
the dispersal corridors between the fragments patches using fruit trees to facilitate
dietary diversity, (ii) maintain connectivity among canopy across linear corridors, (iii)
arrest the deforestation by strict vigilance, protect fragments from further degradation,
and developing forest species nurseries by involving local stakeholders (iv) enrich the
degraded patches periodically with afforestation of native vegetation for long term
conservation and (v) transparency in forest governance with mechanisms for accountability of
forest officials for fragmentation and land degradation of forest landscape.
The policies of maintaining forest contiguity would help in sustaining natural resources and
address the recurring problem of human-animal conflicts due to the fragmentation of
habitat.
Prioritization of ecologically sensitive (susceptible/vulnerable/fragile) regions
(ESR/EVR/EFR) at disaggregated levels has been done by integrating bio-geo-climatic, land
cover, condition of ecosystems (fragmentation), ecological, hydrological, and social
variables with the assignment of weights based on the extent and condition of
ecosystems.
Field investigations reveal that catchments with > 60% vegetation with native species have
higher soil moisture and groundwater than the catchment (of seasonal stream) during a dry
spell of the year. The higher soil moisture due to water availability during all seasons
facilitates the farming of commercial crops with higher economic returns to the farmers,
unlike the farmers who face water shortages during the lean season. The study emphasizes the
need for conservation to maintain native vegetation in the catchment, highlighting its
potential to support people’s livelihood with water conservation at local and regional
levels.
Afforestation with the exotic species (monocultures) has deprived dependent biota of food,
fodder, and water. Hence, dependent animals tend to migrate to other locations in search of
food and water and raid crops, with recurring instances of conflicts since the
eighties.
Uncontrolled LULC changes in fragile ecological regions such as the Western Ghats could
exacerbate rainfall, regional climatic conditions, and drought-related tree mortality,
reducing carbon stocks, increasing fire risk, and lowering biodiversity.
The Western Ghats landscape at disaggregated levels (villages) is grouped into four distinct
groups: ESR 1, ESR 2, ESR 3, and ESR 4 based on the level of the ecological sensitivity of
the region at disaggregated levels considering various themes (bio-geo-climatic, ecological,
and social variables themes).
ESR-1 and ESR-2, with a high degree of ecological sensitivity, are extremely vulnerable and
fragile regions. These regions are endowed with rich ecology (evident from the distribution
of endemic and threatened species of biodiversity), hydrological regime (occurrence of
perennial streams supporting agriculture and horticulture with higher productivity), and
natural resources, which sustains people’s livelihood with an array of ecosystem services,
including the provision of diverse food, and medicine. ESR-3 depicts moderate sensitivity,
ESR-4 with the least sensitivity, and cluster-based developmental projects based on the
natural resources available in the region can be implemented to benefit local
people.
Grids corresponding to ESR-1 and 2 represent fragile ecological regions with the highest
vulnerability to disturbances and are natural resources-rich regions with higher
biodiversity and sustain people’s livelihood. ESR-3 depicts moderate sensitivity, whereas
ESR-4 demarcates the grids of the least ecological significance with the least resource
availability. There are 755 grids in the Western Ghats under ESR-1, covering an area of
32.4%, ESR-2 as 373 grids covering 16%, 789 grids as ESR-3 with 34%, and 412 grids as ESR-4
comprising 17.7% area.
The ESR analysis highlights 39% of the geographical area of the Western Ghats is demarcated
as ESR-1, 17% as ESR-2, 30 % as ESR-3, and 13 % as ESR-4.
Southern states such as Kerala, and Karnataka, located in the latitudinal gradient of 8 -14°
of the Western Ghats with a higher composition of endemic and threatened taxa, cover a wider
spatial extent in ESR-1, and 2 regions, whereas the major part of Maharashtra and Tamil Nadu
state landscapes, are in ESR-3, and 4.
State-wise, village-level ESR analyses indicate that there are ecologically vulnerable
villages in there are 345 villages (of 1037 villages) in Gujarat state, 2311 and 2900
villages under ESR-1, and 2, in Maharashtra State 771, and 1111 villages (of 4911 villages)
under ESR-1 and ESR-2 in Karnataka, 163, and 49 villages (of 841 villages in the Western
Ghats) under ESR-1, 2 in Kerala, 261, and 144 villages (of 1407 villages) under ESR-1, and 2
in Tamil Nadu.
ESR-1 and 2 are the ecologically susceptible region with higher ecological fragility; hence,
the region's ecological integrity needs to be preserved without anthropogenic interventions.
These regions have demonstrated their utility in supporting the livelihood of people through
(i) the sustenance of water (due to the presence of perennial streams), (ii) the presence of
diverse pollinators resulting in efficient pollination leading to higher crop productivity,
(iii) lower instances of mudslides and landslides (as roots of diverse vegetation provide
binding of soil). Hence these regions are considered restricted (no-go) areas for
large-scale developmental activities. Enriching the existing forests across the ESRs with
stakeholders' help would help mitigate global warming and climate change.
The ESR framework acts as a spatial decision support systems (SDSS) tool at decentralized
levels for framing conservation approaches.
The recommendations suggested here aid as a guiding tool for the management of forests and
conservation. Delineation of ESR regions at disaggregated levels with the location-specific
management options would help to make decisions toward the prudent management of natural
resources. ESR framework aids in systematically assessing, monitoring changes, and
formulating appropriate forest protection policies.
Acknowledgment
We are grateful to
(i) EIACP (ENVIS) Division, the Ministry of Environment, Forests and
Climate Change, the Government of India (Grant: SP/DE00-22-001),
(ii) the Indian Institute of Science (IISc/ R1011) for the financial and infrastructure
support.
We acknowledge the support of the Forest Department (Karnataka Forest Department), the Government of Karnataka for giving the necessary permissions to undertake ecological research in the Western Ghats. We thank Vishnu Mukri and Srikanth Naik for their assistance during field data collection. We would like to thank B.M. Prasanna for helping in the village-wise analysis.
References
- Aggarwal, A., Paul, V. and Das, S., 2009. Forest resources: Degradation, livelihoods, and climate change. Looking back to change track, 219, pp.91-108.
- Almeida, D.R., Stark, S.C., Schietti, J., Camargo, J.L., Amazonas, N.T., Gorgens, E.B., Rosa, D.M., Smith, M.N., Valbuena, R., Saleska, S. and Andrade, A., 2019. Persistent effects of fragmentation on tropical rainforest canopy structure after 20 yr of isolation. Ecological Applications, 29(6), p.e01952.
- Aldieri, L., Carlucci, F., Vinci, C.P. and Yigitcanlar, T., 2019. Environmental innovation, knowledge spillovers and policy implications: A systematic review of the economic effects literature. Journal of Cleaner Production, 239, p.118051.
- Andronache, I., Marin, M., Fischer, R., Ahammer, H., Radulovic, M., Ciobotaru, A.M., Jelinek, H.F., Di Ieva, A., Pintilii, R.D., Drăghici, C.C. and Herman, G.V., 2019. Dynamics of forest fragmentation and connectivity using particle and fractal analysis. Scientific reports, 9(1), pp.1-9.
- Bala, G., Caldeira, K., Wickett, M., Phillips, T.J., Lobell, D.B., Delire, C. and Mirin, A., 2007. Combined climate and carbon-cycle effects of large-scale deforestation. Proceedings of the National Academy of Sciences, 104(16), pp.6550-6555.
- Ban, N.C., Mills, M., Tam, J., Hicks, C.C., Klain, S., Stoeckl, N., Bottrill, M.C., Levine, J., Pressey, R.L., Satterfield, T. and Chan, K.M., 2013. A social-ecological approach to conservation planning: embedding social considerations. Frontiers in Ecology and the Environment, 11(4), pp.194-202.
- Bandi, M., 2020. Tribal Rights and Heritage Conservation in the Western Ghats of Karnataka. Economic & Political Weekly, 55(41), p.47.
- Barbier, E.B., Hacker, S.D., Kennedy, C., Koch, E.W., Stier, A.C. and Silliman, B.R., 2011. The value of estuarine and coastal ecosystem services. Ecological monographs, 81(2), pp.169-193.
- Barua, M., Bhagwat, S.A. and Jadhav, S., 2013. The hidden dimensions of human-wildlife conflict: health impacts, opportunity and transaction costs. Biological Conservation, 157, pp.309-316.
- Bell, C.W., Tissue, D.T., Loik, M.E., Wallenstein, M.D., Acosta‐Martinez, V., Erickson, R.A. and Zak, J.C., 2014. Soil microbial and nutrient responses to 7 years of seasonally altered precipitation in a Chihuahuan Desert grassland. Global Change Biology, 20(5), pp.1657-1673.
- Bharath, S. Rajan, K.S. and Ramachandra, T.V., 2013. Land Surface Temperature Responses to Land Use Land Cover Dynamics. Geoinfor Geostat: An Overview 1: 4(10), p.2.
- Bharath, S., Rajan, K.S. and Ramachandra, T.V., 2014. Status and future transition of rapid urbanizing landscape in central Western Ghats-CA based approach. ISPRS Annals of the Photogrammetry, Remote Sensing and Spatial Information Sciences, 2(8), p.69.
- Bharath, S. and Ramachandra, T.V., 2021. Modeling Landscape Dynamics of Policy Interventions in Karnataka State, India. Journal of Geovisualization and Spatial Analysis, 5(2), pp.1-23.
- Bharath, S., Rajan, K.S. and Ramachandra, T.V., 2021. Modeling Forest Landscape Dynamics, NOVA Science Publishers 1, 249
- Boerema, A. and Meire, P., 2017. Management for estuarine ecosystem services: A review. Ecological Engineering, 98, pp.172-182.
- Burrough, P.A., McDonnell, R., McDonnell, R.A. and Lloyd, C.D., 2015. Principles of geographical information systems. Oxford university press.
- Champion, H.G. and Seth, S.K., 1968. A revised survey of the forest types of India. Manager of publications.
- Chaplin-Kramer, R., Ramler, I., Sharp, R., Haddad, N.M., Gerber, J.S., West, P.C., Mandle, L., Engstrom, P., Baccini, A., Sim, S. and Mueller, C., 2015. Degradation in carbon stocks near tropical forest edges. Nature communications, 6(1), pp.1-6.
- Damandeep, S., 2017. Putting a price on carbon: A handbook for Indian companies. New Delhi, TERI Press.
- D'Angelo, S.A., Andrade, A.C., Laurance, S.G., Laurance, W.F. and Mesquita, R.C., 2004. Inferred causes of tree mortality in fragmented and intact Amazonian forests. Journal of Tropical Ecology, pp.243-246.
- Deng, L., Wang, K., Li, J., Zhao, G. and Shangguan, Z., 2016. Effect of soil moisture and atmospheric humidity on both plant productivity and diversity of native grasslands across the Loess Plateau, China. Ecological Engineering, 94, pp.525-531.
- ESMAP, 2020. Energy Sector Management Assistance Program Annual Report (2020) (English). Washington, D.C.: World Bank Group. http://documents.worldbank.org/curated/en/712171609756525808/Energy-Sector-Management-Assistance-Program-ESMAP-Annual-Report-2020
- Ewers, R.M. and Didham, R.K., 2008. Pervasive impact of large-scale edge effects on a beetle community. Proceedings of the National Academy of Sciences, 105(14), pp.5426-5429.
- Ewers, R.M. and Banks-Leite, C., 2013. Fragmentation impairs the microclimate buffering effect of tropical forests. PLOS one, 8(3), p.e58093.
- Gadgil, M., Daniels, R.R., Ganeshaiah, K.N., Prasad, S.N., Murthy, M.S.R., Jha, C.S., Ramesh, B.R. and Subramanian, K.A., 2011. Mapping ecologically sensitive, significant and salient areas of Western Ghats: proposed protocols and methodology. Current Science, 100(2), pp.175-182.
- Gao, J., Wang, Y., Zou, C., Xu, D., Lin, N., Wang, L. and Zhang, K., 2020. China’s ecological conservation redline: A solution for future nature conservation. Ambio, pp.1-11.
- Harris, N.L., Gibbs, D.A., Baccini, A., Birdsey, R.A., De Bruin, S., Farina, M., Fatoyinbo, L., Hansen, M.C., Herold, M., Houghton, R.A. and Potapov, P.V., 2021. Global maps of twenty-first century forest carbon fluxes. Nature Climate Change, 11(3), pp.234-240.
- Harrison, S.P., Stocker, B.D., Goldewijk, K.K., Kaplan, J.O. and Braconnot, P., 2018. Do we need to include anthropogenic land-use and land-cover changes in paleoclimate simulations?. Past Land Use and Land Cover, 26 (1), p.4.
- Hennenberg, K.J., Goetze, D., Szarzynski, J., Orthmann, B., Reineking, B., Steinke, I. and Porembski, S., 2008. Detection of seasonal variability in microclimatic borders and ecotones between forest and savanna. Basic and Applied Ecology, 9(3), pp.275-285.
- Hunter, M.O., Keller, M., Morton, D., Cook, B., Lefsky, M., Ducey, M., Saleska, S., de Oliveira Jr, R.C. and Schietti, J., 2015. Structural dynamics of tropical moist forest gaps. PLoS One, 10(7), p.e0132144.
- Jalilian, M.A., Salmanmahiny, A., Danehkar, A. and Shayesteh, K., 2021. Developing a Method for Calculating Conservation Targets in Systematic Conservation Planning at the National Level. Journal for Nature Conservation, p.126091.
- Karthik, R., Robin, R.S., Anandavelu, I., Purvaja, R., Singh, G., Mugilarasan, M., Jayalakshmi, T., Samuel, V.D. and Ramesh, R., 2020. Diatom bloom in the Amba River, west coast of India: A nutrient-enriched tropical river-fed estuary. Regional Studies in Marine Science, 35, p.101244.
- Krithi, K.K., Naughton-Treves, L., DeFries, R. and Gopalaswamy, A.M., 2013. Living with wildlife and mitigating conflicts around three Indian protected areas. Environmental management, 52(6), pp.1320-1332.
- Koschke, L., Fürst, C., Frank, S. and Makeschin, F., 2012. A multi-criteria approach for an integrated land-cover-based assessment of ecosystem services provision to support landscape planning. Ecological indicators, 21, pp.54-66.
- Kuèas, A.N., Trakimas, G., Balèiauskas, L.I. and Vaitkus, G., 2011. Multi-scale analysis of forest fragmentation in Lithuania. Baltic Forest, 17(1), pp.128-135.
- Kumar, M.A., Mudappa, D. and Raman, T.S., 2010. Asian elephant Elephas maximus habitat use and ranging in fragmented rainforest and plantations in the Anamalai Hills, India. Tropical Conservation Science, 3(2), pp.143-158.
- Langlois, L.A., Drohan, P.J. and Brittingham, M.C., 2017. Linear infrastructure drives habitat conversion and forest fragmentation associated with Marcellus shale gas development in a forested landscape. Journal of environmental management, 197, pp.167-176.
- Latimer, C.E.; Zuckerberg, B. Forest fragmentation alters winter microclimates and microrefugia in human-modified landscapes. Ecography 2017, 40, 158–170.
- Laurance, W.F., Nascimento, H.E., Laurance, S.G., Andrade, A., Ribeiro, J.E., Giraldo, J.P., Lovejoy, T.E., Condit, R., Chave, J., Harms, K.E. and D'Angelo, S., 2006. Rapid decay of tree-community composition in Amazonian forest fragments. Proceedings of the National Academy of Sciences, 103(50), pp.19010-19014.
- Leman, N., Ramli, M.F. and Khirotdin, R.P.K., 2016. GIS-based integrated evaluation of environmentally sensitive areas (ESAs) for land use planning in Langkawi, Malaysia. Ecological indicators, 61, pp.293-308.
- Lillesand, T., Kiefer, R.W. and Chipman, J., 2014. Remote sensing and image interpretation. John Wiley & Sons, New York.
- Lobell, D.B., Burke, M.B., Tebaldi, C., Mastrandrea, M.D., Falcon, W.P. and Naylor, R.L., 2008. Prioritizing climate change adaptation needs for food security in 2030. Science, 319(5863), pp.607-610.
- Madhurima, C. and Banerjee, A., 2013. Forest degradation and livelihood of local communities in India: A human rights approach. Journal of Horticulture and Forestry, 5(8), pp.122-129.
- Misra, A.K., Lata, K. and Shukla, J.B., 2014. Effects of population and population pressure on forest resources and their conservation: a modeling study. Environment, development and sustainability, 16(2), pp.361-374.
- Morlote, D.M., Gayden, T., Arvind, P., Babu, A. and Herrera, R.J., 2011. The Soliga, an isolated tribe from Southern India: genetic diversity and phylogenetic affinities. Journal of human genetics, 56(4), pp.258-269.
- Morris, D.A. and Johnson, A.I., 1967. Summary of hydrologic and physical properties of rock and soil materials, as analyzed by the hydrologic laboratory of the US Geological Survey, 1948-60 (No. 1839-D). US Government Printing Office.
- Mote, S., Rivas, J. and Kalnay, E., 2020. A novel approach to carrying capacity: from a priori prescription to a posteriori derivation based on underlying mechanisms and dynamics. Annual Review of Earth and Planetary Sciences, 48, pp.657-683.
- Myers, N., Mittermeier, R.A., Mittermeier, C.G., Da Fonseca, G.A. and Kent, J., 2000. Biodiversity hotspots for conservation priorities. Nature, 403(6772), pp.853-858.
- Nair, N.B., Kumar, K.K., Rajasekharan Nair, J., Abdul Azis, P.K., Dharmaraj, K. and Arunachalam, M., 1983. Ecology of Indian estuaries-XI. A preliminary survey of the fishery resources of the Ashtamudi estuarine system. Fishery Technology, 20(2), pp.75-83.
- Nakhawa, A.D., Vichare Priyanka, S., Markad, S., Khandagale, P.A., Shirdhankar, M. and Brahmane, M.P., 2017. Mangrove mapping of different estuaries along Ratnagiri block using remote sensing, Ecology Environment & Conservation, 23(2), pp.819-824.
- Nath, A.J., Brahma, B., Sileshi, G.W. and Das, A.K., 2018. Impact of land use changes on the storage of soil organic carbon in active and recalcitrant pools in a humid tropical region of India. Science of the total environment, 624, pp.908-917.
- Nayak, B.P., Kohli, P. and Sharma, J.V., 2012. Livelihood of local communities and forest degradation in India: issues for REDD+. Ministry of Environment and Forests Government of India New Delhi India. Web: http://envfor. nic. in/assets/redd-bk3. pdf. Accessed, 18 October 2020.
- Nayak, R., Karanth, K.K., Dutta, T., Defries, R., Karanth, K.U. and Vaidyanathan, S., 2020. Bits and pieces: Forest fragmentation by linear intrusions in India. Land Use Policy, p.104619.
- Olson, D.M., Dinerstein, E., Wikramanayake, E.D., Burgess, N.D., Powell, G.V., Underwood, E.C., D'amico, J.A., Itoua, I., Strand, H.E., Morrison, J.C. and Loucks, C.J., 2001. Terrestrial Ecoregions of the World: A New Map of Life on Earth A new global map of terrestrial ecoregions provides an innovative tool for conserving biodiversity. BioScience, 51(11), pp.933-938.
- Otukei, J.R. and Blaschke, T., 2010. Land cover change assessment using decision trees, support vector machines and maximum likelihood classification algorithms. International Journal of Applied Earth Observation and Geoinformation, 12, pp.S27-S31.
- Padalia, H., Ghosh, S., Reddy, C.S., Nandy, S., Singh, S. and Kumar, A.S., 2019. Assessment of historical forest cover loss and fragmentation in Asian elephant ranges in India. Environmental Monitoring and Assessment, 191(3), p.802.
- Pankaj, A. and Kumar, P., 2009. GIS-based morphometric analysis of five major sub-watersheds of Song River, Dehradun District, Uttarakhand with special reference to landslide incidences. Journal of the Indian Society of Remote Sensing, 37(1), pp.157-166.
- Prabhakaran, A. and Raj, N.J., 2018. Drainage morphometric analysis for assessing form and processes of the watersheds of Pachamalai hills and its adjoinings, Central Tamil Nadu, India. Applied water science, 8(1), pp.1-19.
- Peters, D.P., Yao, J., Sala, O.E. and Anderson, J.P., 2012. Directional climate change and potential reversal of desertification in arid and semiarid ecosystems. Global Change Biology, 18(1), pp.151-163.
- Qasim, S.Z. and Gupta, R.S., 1981. Environmental characteristics of the Mandovi-Zuari estuarine system in Goa. Estuarine, Coastal and Shelf Science, 13(5), pp.557-578.
- Rai, P.K., Chandel, R.S., Mishra, V.N. and Singh, P., 2018. Hydrological inferences through morphometric analysis of lower Kosi river basin of India for water resource management based on remote sensing data. Applied water science, 8(1), pp.1-16.
- Rajan, S., Jayendran, M. and Sethuraman, M., 2005. Folk herbal practices among Toda tribe of the Nilgiri Hills in Tamil Nadu, India. Journal of natural remedies, 5(1), pp.52-58.
- Ramachandra, T.V., Tara, N.M. and Bharath, S., 2017. Web Based Spatial Decision Support System for Sustenance of Western Ghats Biodiversity, Ecology and Hydrology. Creativity and Cognition in Art and Design, Edited by Aneesha Sharma and Jamuna Rajeswaran, pp. 58-70.
- Ramachandra, T.V., Bharath, S. and Gupta, N., 2018. Modelling landscape dynamics with LST in protected areas of Western Ghats, Karnataka. Journal of environmental management, 206, pp.1253-1262.
- Ramachandra, T.V., Bharath, S., Chandran, M.S. and Joshi, N.V., 2018. Salient Ecological Sensitive Regions of Central Western Ghats, India. Earth Systems and Environment, 2(1), pp.15-34.
- Ramachandra, T.V. and Bharath, S., 2019. Sustainable Management of Bannerghatta National Park, India, with the Insights in Land Cover Dynamics. FIIB Business Review, 8(2), pp.118-131.
- Ramachandra, T.V. and Bharath, S., 2019. Carbon sequestration potential of the forest ecosystems in the Western Ghats, a global biodiversity hotspot. Natural Resources Research, pp.1-19.
- Ramachandra, T.V., Bharath, S. and Vinay, S., 2019. Visualisation of impacts due to the proposed developmental projects in the ecologically fragile regions-Kodagu district, Karnataka. Progress in Disaster Science, 3, p.100038.
- Ramachandra, T.V., Raj, R.K. and Aithal, B.H., 2019. Valuation of Aghanashini estuarine ecosystem goods and services. Journal of Biodiversity, 10(1/2), pp.45-58.
- Ramachandra, T.V., Bharath, S. and Bharath, A.H., 2020. Insights of Forest Dynamics for the Regional Ecological Fragility Assessment. Journal of the Indian Society of Remote Sensing, 48(8), pp.1169-1189.
- Ramachandra, T.V., Vinay, S., Bharath, S., Chandran, M.S. and Aithal, B.H., 2020. Insights into riverscape dynamics with the hydrological, ecological and social dimensions for water sustenance. Curr Sci, 118(9), pp.1379-1393.
- Ramachandra, T.V., Bharath, S. and Vinay S., 2021. Landslides in Western Ghats & Coastal area-Causes, Triggers, and Solutions, Department of Forest, Environment & Ecology, Government of Karnataka, pp. 25-45.
- Ramachandra T.V., Bharath S., 2021. Carbon Footprint of Karnataka: Accounting of Sources and Sinks. In: Muthu S.S. (eds) Carbon Footprint Case Studies. Environmental Footprints and Eco-design of Products and Processes. Springer, Singapore. https://doi.org/10.1007/978-981-15-9577-6_3, ISBN: 978-981-15-9576-9.
- Ricke, K., Drouet, L., Caldeira, K. and Tavoni, M., 2018. Country-level social cost of carbon. Nature Climate Change, 8(10), pp.895-900.
- Riitters, K.H., Wickham, J.D., O'neill, R.V., Jones, K.B., Smith, E.R., Coulston, J.W., Wade, T.G. and Smith, J.H., 2002. Fragmentation of continental United States forests. Ecosystems, 5(8), pp.0815-0822.
- Rohini, C.K., Aravindan, T., Vinayan, P.A., Ashokkumar, M. and Das, K.A., 2016. An assessment of human-elephant conflict and associated ecological and demographic factors in Nilambur, Western Ghats of Kerala, southern India. Journal of threatened taxa, 8(7), pp.8970-8976.
- Roy, S., Hegde, H.V., Bhattacharya, D., Upadhya, V. and Kholkute, S.D., 2015. Tribes in Karnataka: Status of health research. The Indian journal of medical research, 141(5), p.673.
- Sallustio, L., Munafò, M., Riitano, N., Lasserre, B., Fattorini, L. and Marchetti, M., 2016. Integration of land use and land cover inventories for landscape management and planning in Italy. Environmental monitoring and assessment, 188(1), p.48.
- Sheil, D. and Murdiyarso, D., 2009. How forests attract rain: an examination of a new hypothesis. Bioscience, 59(4), pp.341-347.
- Shen, C., Shi, N., Fu, S., Ye, W., Ma, L. and Guan, D., 2021. Decline in Aboveground Biomass Due to Fragmentation in Subtropical Forests of China. Forests, 12(5), p.617.
- Spracklen, D.V., Arnold, S.R. and Taylor, C.M., 2012. Observations of increased tropical rainfall preceded by air passage over forests. Nature, 489(7415), pp.282-285.
- Srivastava, P.K., Han, D., Rico-Ramirez, M.A., Bray, M. and Islam, T., 2012. Selection of classification techniques for land use/land cover change investigation. Advances in Space Research, 50(9), pp.1250-1265.
- Stark, S.C., Leitold, V., Wu, J.L., Hunter, M.O., de Castilho, C.V., Costa, F.R., McMahon, S.M., Parker, G.G., Shimabukuro, M.T., Lefsky, M.A. and Keller, M., 2012. Amazon forest carbon dynamics predicted by profiles of canopy leaf area and light environment. Ecology letters, 15(12), pp.1406-1414.
- Stocker, B.D., Yu, Z. and Joos, F., 2018. Contrasting CO2 emissions from different Holocene land-use reconstructions: Does the carbon budget add up?. Past Global Changes Magazine, 26(1), pp.6-7.
- Sukumar, R., 2006. A brief review of the status, distribution and biology of wild Asian elephants Elephas maximus. International Zoo Yearbook, 40(1), pp.1-8.
- Tahmiscioğlu, M.S., Anul, N., Ekmekçi, F. and Durmuş, N., 2007, March. Positive and negative impacts of dams on the environment. In International Congress on River Basin Management (pp. 759-769).
- Thrush, S.F., Townsend, M., Hewitt, J.E., Davies, K., Lohrer, A.M., Lundquist, C., Cartner, K. and Dymond, J., 2013. The many uses and values of estuarine ecosystems. Ecosystem services in New Zealand–conditions and trends. Manaaki Whenua Press, Lincoln, New Zealand, pp.226-237.
- Tuomainen, U. and Candolin, U., 2011. Behavioural responses to human‐induced environmental change. Biological Reviews, 86(3), pp.640-657.
- Umapathy, Govindhaswamy, Shaik Hussain, and Sisinthy Shivaji. "Impact of habitat fragmentation on the demography of lion-tailed macaque (Macaca silenus) populations in the rainforests of Anamalai Hills, Western Ghats, India." International Journal of Primatology 32, no. 4 (2011): 889-900.
- van Straaten, O., Corre, M.D., Wolf, K., Tchienkoua, M., Cuellar, E., Matthews, R.B. and Veldkamp, E., 2015. Conversion of lowland tropical forests to tree cash crop plantations loses up to one-half of stored soil organic carbon. Proceedings of the National Academy of Sciences, 112(32), pp.9956-9960.
- Vinay, S., Bharath, S., Bharath, H.A. and Ramachandra, T.V., 2013, November. Hydrologic model with landscape dynamics for drought monitoring. In proceeding of: Joint International Workshop of ISPRS WG VIII/1 and WG IV/4 on Geospatial Data for Disaster and Risk Reduction, Hyderabad, November (pp. 21-22).
- White, C., Halpern, B.S. and Kappel, C.V., 2012. Ecosystem service tradeoff analysis reveals the value of marine spatial planning for multiple ocean uses. Proceedings of the National Academy of Sciences, 109(12), pp.4696-4701.
- Wilkinson, D.M., 2007. Fundamental processes in ecology: an earth systems approach. OUP-Oxford University Press.
- Yokochi, K., Chambers, B.K. and Bencini, R., 2015. An artificial waterway and road restrict movements and alter home ranges of endangered arboreal marsupial. Journal of Mammalogy, 96(6), pp.1284-1294.
Annexure
Annexure 1.1 Eco-sensitive villages in Kerala and Tamil Nadu
Identifying ESR considering bio-geo-climatic, ecological and social parameters at disaggregated levels and management by involving all stakeholders including the federal government helps in maintaining the ecological integrity through protection of fragile ecosystems and restoration of degraded ecosystems, which aids in the improvement in the quality of ecosystems and mitigating environmental challenges.
Section 3 of the Environment (Protection) Act 1986 (EPA), Government of India empowers the Union Ministry of Environment, Forests and Climate Change (MoEFCC) to declare any region as ecologically sensitive considering its unique ecology, geology and climatic factors.
Section 5(1) of the Environment (Protection) Rules, 1986 (EPR), prohibits or restricts the location of industries and carrying on certain operations or processes on the basis of considerations like the biological diversity of an area (clause v) maximum allowable limits of concentration of pollutants for an area (clause ii) environmentally compatible land use (clause vi) proximity to protected areas (clause viii) and implementation by the central government.
Delineation of ESR at disaggregated levels (villages) in the Western Ghats would empower decentralised governance mechanism by empowering BMC (Biodiversity management Committees) at Panchayat level with the decision support system (DSS), which help in evolving appropriate natural resources management strategies and ensure sustainable development.
ESRs of Kerala state
Kerala state with rich rainfall in the parts of Western Ghats has lush evergreen forests and moist deciduous forest cover types due to. Figure A1_a show the villages of Kerala across the districts and respective taluks. Kerala state has 841 villages (26,240 km2) covered under the Western Ghats, of which 163 villages are demarcated as ESR-1 (with a spatial extent of 13,401), 49 as ESR-2 (1,483 km2), 270 as ESR-3 (5,453 km2) , and 359 as ESR-4 (5,904 km2). Series of calamities such as floods, landslides, and water shortage, even after the floods in the Kerala state, have necessitated the conservation of ecologically fragile regions on priority. Villages of ESR-1, and 2 comprise rich endemic biodiversity and require strict protection with stringent conservation measures. These areas are already under the network of protected areas, reserve forests, and conservation reserves. ESR-4 is open for sustainable development.
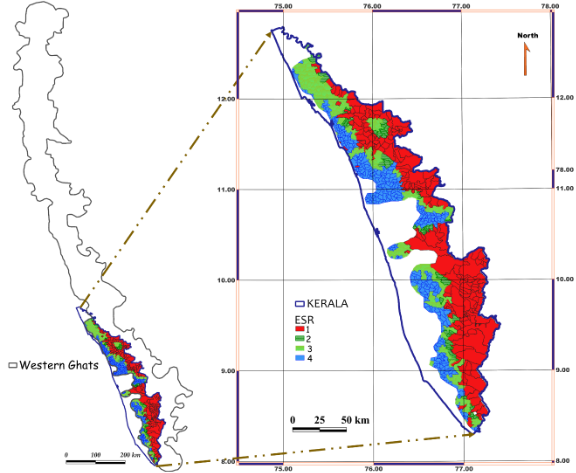
Figure A1_a. The ESRs of Kerala state
ESRs of Tamil Nadu state
Tamil Nadu state due to the variation in rainfall gradient has distinct forest cover types ranging from evergreen to moist deciduous and dry thorn forests. Figure A1_b portray villages of Tamil Nadu baed on ESR across the districts and respective taluks. Tamil Nadu state has 1407 villages covered under the Western Ghats, of which 261 villages are demarcated as ESR-1, 144 as ESR-2, 352 as ESR-3, and 650 as ESR-4 with the following geographical area coverage in km2 as 26240, 13401, 1483, 5453, 5904, respectively. The eastern planes, which are part of the Western Ghats depicting large-scale land use changes from the past two decades, signify the cyclic effects of deforestation. The human-animal conflicts are increasing due to the loss of corridors and increased fragmentation. The major portion of the state is under ESR3 and ESR-4 categories, enriching the existing forests with native forest cover will reduce the imbalances caused on the ecosystem.
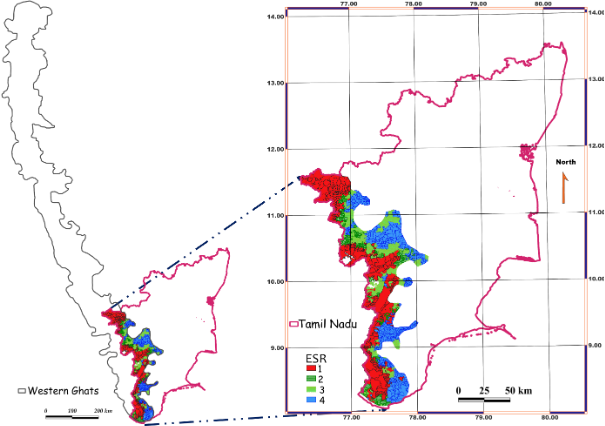
Figure A1_b. ESRs of Tamil Nadu state
Annexure 1.2 (Eco-sensitive Villages of Karnataka and Goa)
ESRs of Karnataka state
Karnataka state is gifted with diverse forest types due to distinct climatic conditions, topography, rainfall, and soils. The state has diverse forest cover types such as evergreen, moist deciduous, dry deciduous, and scrub/thorn forest types in the Western Ghats region. These diverse forest types act as ecological niches for varied flora and fauna. The state supports 10% of the total tiger population and 25% of the country`s elephant population. Karnataka state has 4911 villages as a part of the Western Ghats region, of which 1771 are depicted as ESR-1, 1111 under ESR-2, 1521 under ESR-3 and 508 under ESR-4, respectively (Figue A1_c). The villages covered under ESR-1 and 2 denote the rich biodiversity hotspots, an assemblage of endemic flora and fauna, which required greater protection and effective conservation measures.
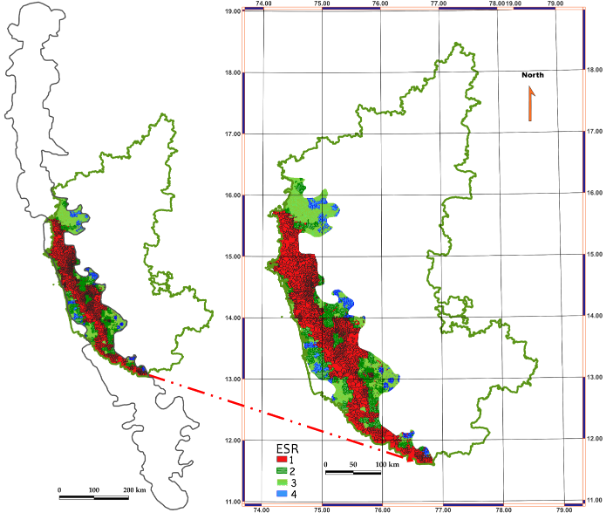
Figure A1_c. ESRs of Karnataka state at village level
ESRs of Goa state
Goa state is blessed with rich evergreen to moist deciduous forest cover types and rich mineral resources. The village wise distribution under various ESRs depicts 60% of the state is part of the Western Ghats. ESR-1 category shows 78 villages, ESR-2 as 82 villages, 53 as ESR-3, and 8 as ESR-4 of the total 221 villages of the state (Figure A1_d).
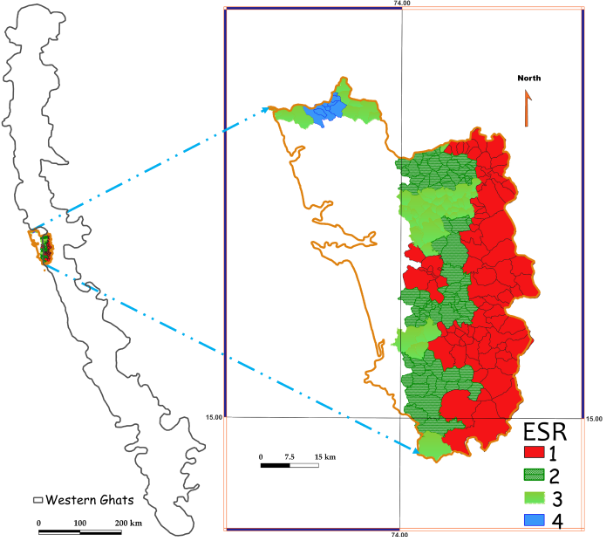
Figure A1_d. ESRs of Goa state
Annexure 1.3 Ecosensitive villages in Maharashtra and Gujarat
ESRs of Maharashtra state
Maharashtra has vibrant forest cover types such as semi-evergreen forests, moist deciduous forests, dry deciduous forests, and thorn forests. The rural population of the state depends on the forests considerably for livelihood and basic needs. The state has 10718 villages as part of the Western Ghats, of which 2311 under ESR-1, 2908 under ESR-2, 4916, and 583 under ESR-3, and 4 respectively (Figure A1_e). The major portion of the state is covered under ESR-3, and 4 and the region covered under ESR-1, and 2 depicts the rich biodiversity hotspots, which are also part of the protected area network. The Western Ghat forests with the origin of numerous rivers such as Godavari, Krishna, Tapti, etc., have been acting as a lifeline for farming and other industrial activities.
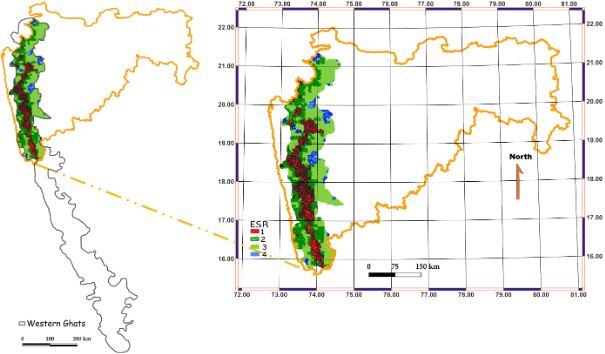
Figure A1_e. ESR villages of Maharashtra state
ESRs of Gujarat state
Gujarat state has moist to dry deciduous forest cover and occupies 6045 km2 area of the Western Ghats. ESR-1, 2 region is depicted under 345, 245 villages respectively and 207, 240 villages are covered under ESR-3, 4 of the entire 1037 villages (Figure A1_f).
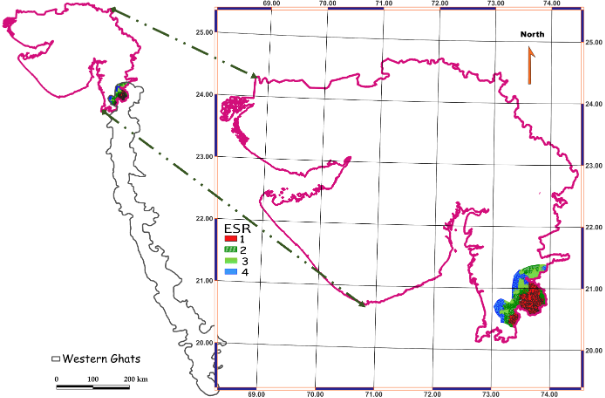
Figure A1_f. ESRs of Gujarat state at village level
Annexure-2
The Western Ghats ecologically sensitive regions – earlier efforts
The union government constituted the Western Ghats Ecology Expert Panel (WGEEP) and issued directions under Section 5 of the Environment Protection Act to preserve nature and the environment of the Western Ghats. WGEEP submitted a report on August 31, 2011, indicating a 1.29 lakh km2 area as Ecologically Sensitive Zones (ESZ) after conducting a series of meetings in one and a half years with various government officials. WGEEP designated the entire region as ESZ, and has classified the 142 taluks into ESZ 1, 2, and 3 (Figure A2_g). MoEFCC then constituted the High-Level Working Group (HLWG), to examine the WGEEP report in a holistic and multidisciplinary fashion, considering the comments received from State governments concerned, Central ministries, and stakeholders. The HLWG recommended and declared 4,156 villages in six States (99 in Goa, 64 in Gujarat, 1576 in Karnataka, 123 in Kerala, 2159 in Maharashtra, and 135 in Tamil Nadu) as Ecologically Sensitive Areas (ESA) (Figure A2_h). The report has not considered the wildlife habitats, endemism, movement paths, and buffer regions for protected areas in demarcating ESAs. The Western Ghats' state governments have unanimously rejected the recommendations and disagreed with the implementation. WGEEP-HLWG reports failed to receive the people’s acceptance due to numerous reasons, much of the apprehensions were raised from ignorance, and deliberate misreading/misinterpreting of the recommendations.

Figure A2_g. ESA as per WGEEP report
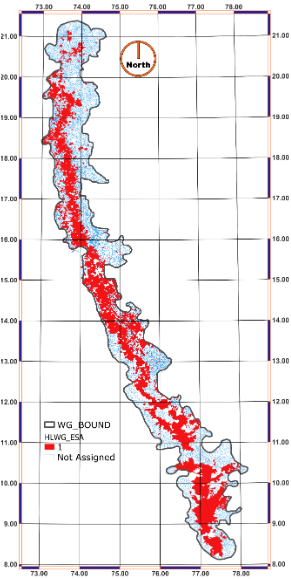
Figure A2_h. ESA as per HLWG report