Bangalore Urban information System (BUiS)
https://wgbis.ces.iisc.ac.in/sdss/BUiS/
Visualize urban growth in Bangalore city and
Bangalore urban district
(designed and
developed as part of LiFE - LIFESTYLE FOR
ENVIRONMENT)
T V Ramachandra, Bharath H Aithal, Vinay S,
Bharath Setturu, Tulika Mondal,
Abhishek Baghel and Bhuwan C Arya
IISc EIACP [RP] Environmental Information Awareness
Capacity Building and Livelihood Programme
&
Energy & Wetlands Research Group, CES TE 15,
Third Floor, E Wing, New Biology Building (Near D
Gate),
Indian Institute of Science, Bangalore
560012,
E Mail:
tvr@iisc.ac.in,
envis.ces@iisc.ac.in
| Tel: 91-080-22933099/22933503/23608661
Bangalore Urban information System (BUiS) is
designed by taking advantage of the recent advances
in information and open source web technologies
through the integration of spatial and the attribute
information (urbanisation trend, lakes, trees,
environmental, administrative, demographic,
socio-economic, etc.)
Web-based spatial decision support system (WSDSS) is
designed by integrating free and open source
software (GeoServer, PostgreSQL, PostGIS, Leaflet)
and integration of spatial information of Open
Geospatial Consortium (OGC) standards to carry out a
multiple criteria analysis. Features such as Web Map
Service (WMS), and Web Feature Service (WFS) would
help to effectively disseminate ecological,
socio-economic, and environmental information.
Urbanisation refers to the growth of towns and
cities due to a large proportion of the population
living in urban areas and their suburbs at the
expense of the rural regions. People migrate to
urban areas hoping for a better living, considering
relatively better infrastructural facilities
(education, recreation, health centres, banking,
transport, and communication) and higher per capita
income. Unplanned urbanisation leads to large-scale
land use changes affecting the sustenance of local
natural resources. Rapid unplanned urbanisation in
most cities in India has led to serious problems in
urban areas due to higher pollution (air, water,
land, noise), inequitable distribution of natural
resources, traffic congestion, the spread of slums,
unemployment, increased reliance on fossil fuels,
and uncontrolled outgrowth or sprawl in the
periphery.
Urbanisation is one of the demographic issues being
investigated in the 21st century. Understanding
spatial patterns of changes and prior visualization
of likely growth is crucial for sustainable
management of natural resources and evolving
strategies to mitigate climate changes. This would
help city planners mitigate the problems associated
with the increased urban area and population and
ultimately build sustainable cities.
Bangalore is experiencing unprecedented rapid
urbanisation and sprawl in recent times due to
unrealistic concentrated developmental activities
with impetus on industrialisation for the economic
development of the region. This
has led to large-scale land cover changes with serious
environmental degradation, posing serious challenges to the decision makers in
the city planning and management process involving a
plethora of serious challenges such as climate
change, enhanced emissions of greenhouse gases
(GHG), lack of appropriate infrastructure, traffic
congestion, and lack of basic amenities
(electricity, water, and sanitation) in many
localities, etc.
Urbanisation and loss of natural resources
(wetlands and green spaces):
Urbanisation during 1973 to 2023 (1055%
concretization or increase of paved surface) has a
telling influence on the natural resources, such as
a decline in green spaces (88% decline in
vegetation), wetlands (79% decline), higher air
pollutants and a sharp decline in the groundwater
table. Figure 1 depicts the unrealistic urban growth
during the last two decades. Quantifying the
number of trees in the region using remote sensing
data with field census reveals that only 1.5 million
trees support Bangalore's population of 9.5 million,
indicating one tree for every seven persons in the
city. This is insufficient even to sequester
respiratory carbon (540-900 g per person per day).
The city landscape was dotted with greeneries to an
extent of 466 sq. km (68.2%), and built-up
areas were about 54 sq. km (7.97%). There has
been a steep increase in built-up areas (640 sq.km
86.6%) and loss of green cover due to rapid
urbanisation. Figure 1 depicts the unrealistic
urban growth during the last five decades, and
category-wise land use transitions are listed in
Table 1.
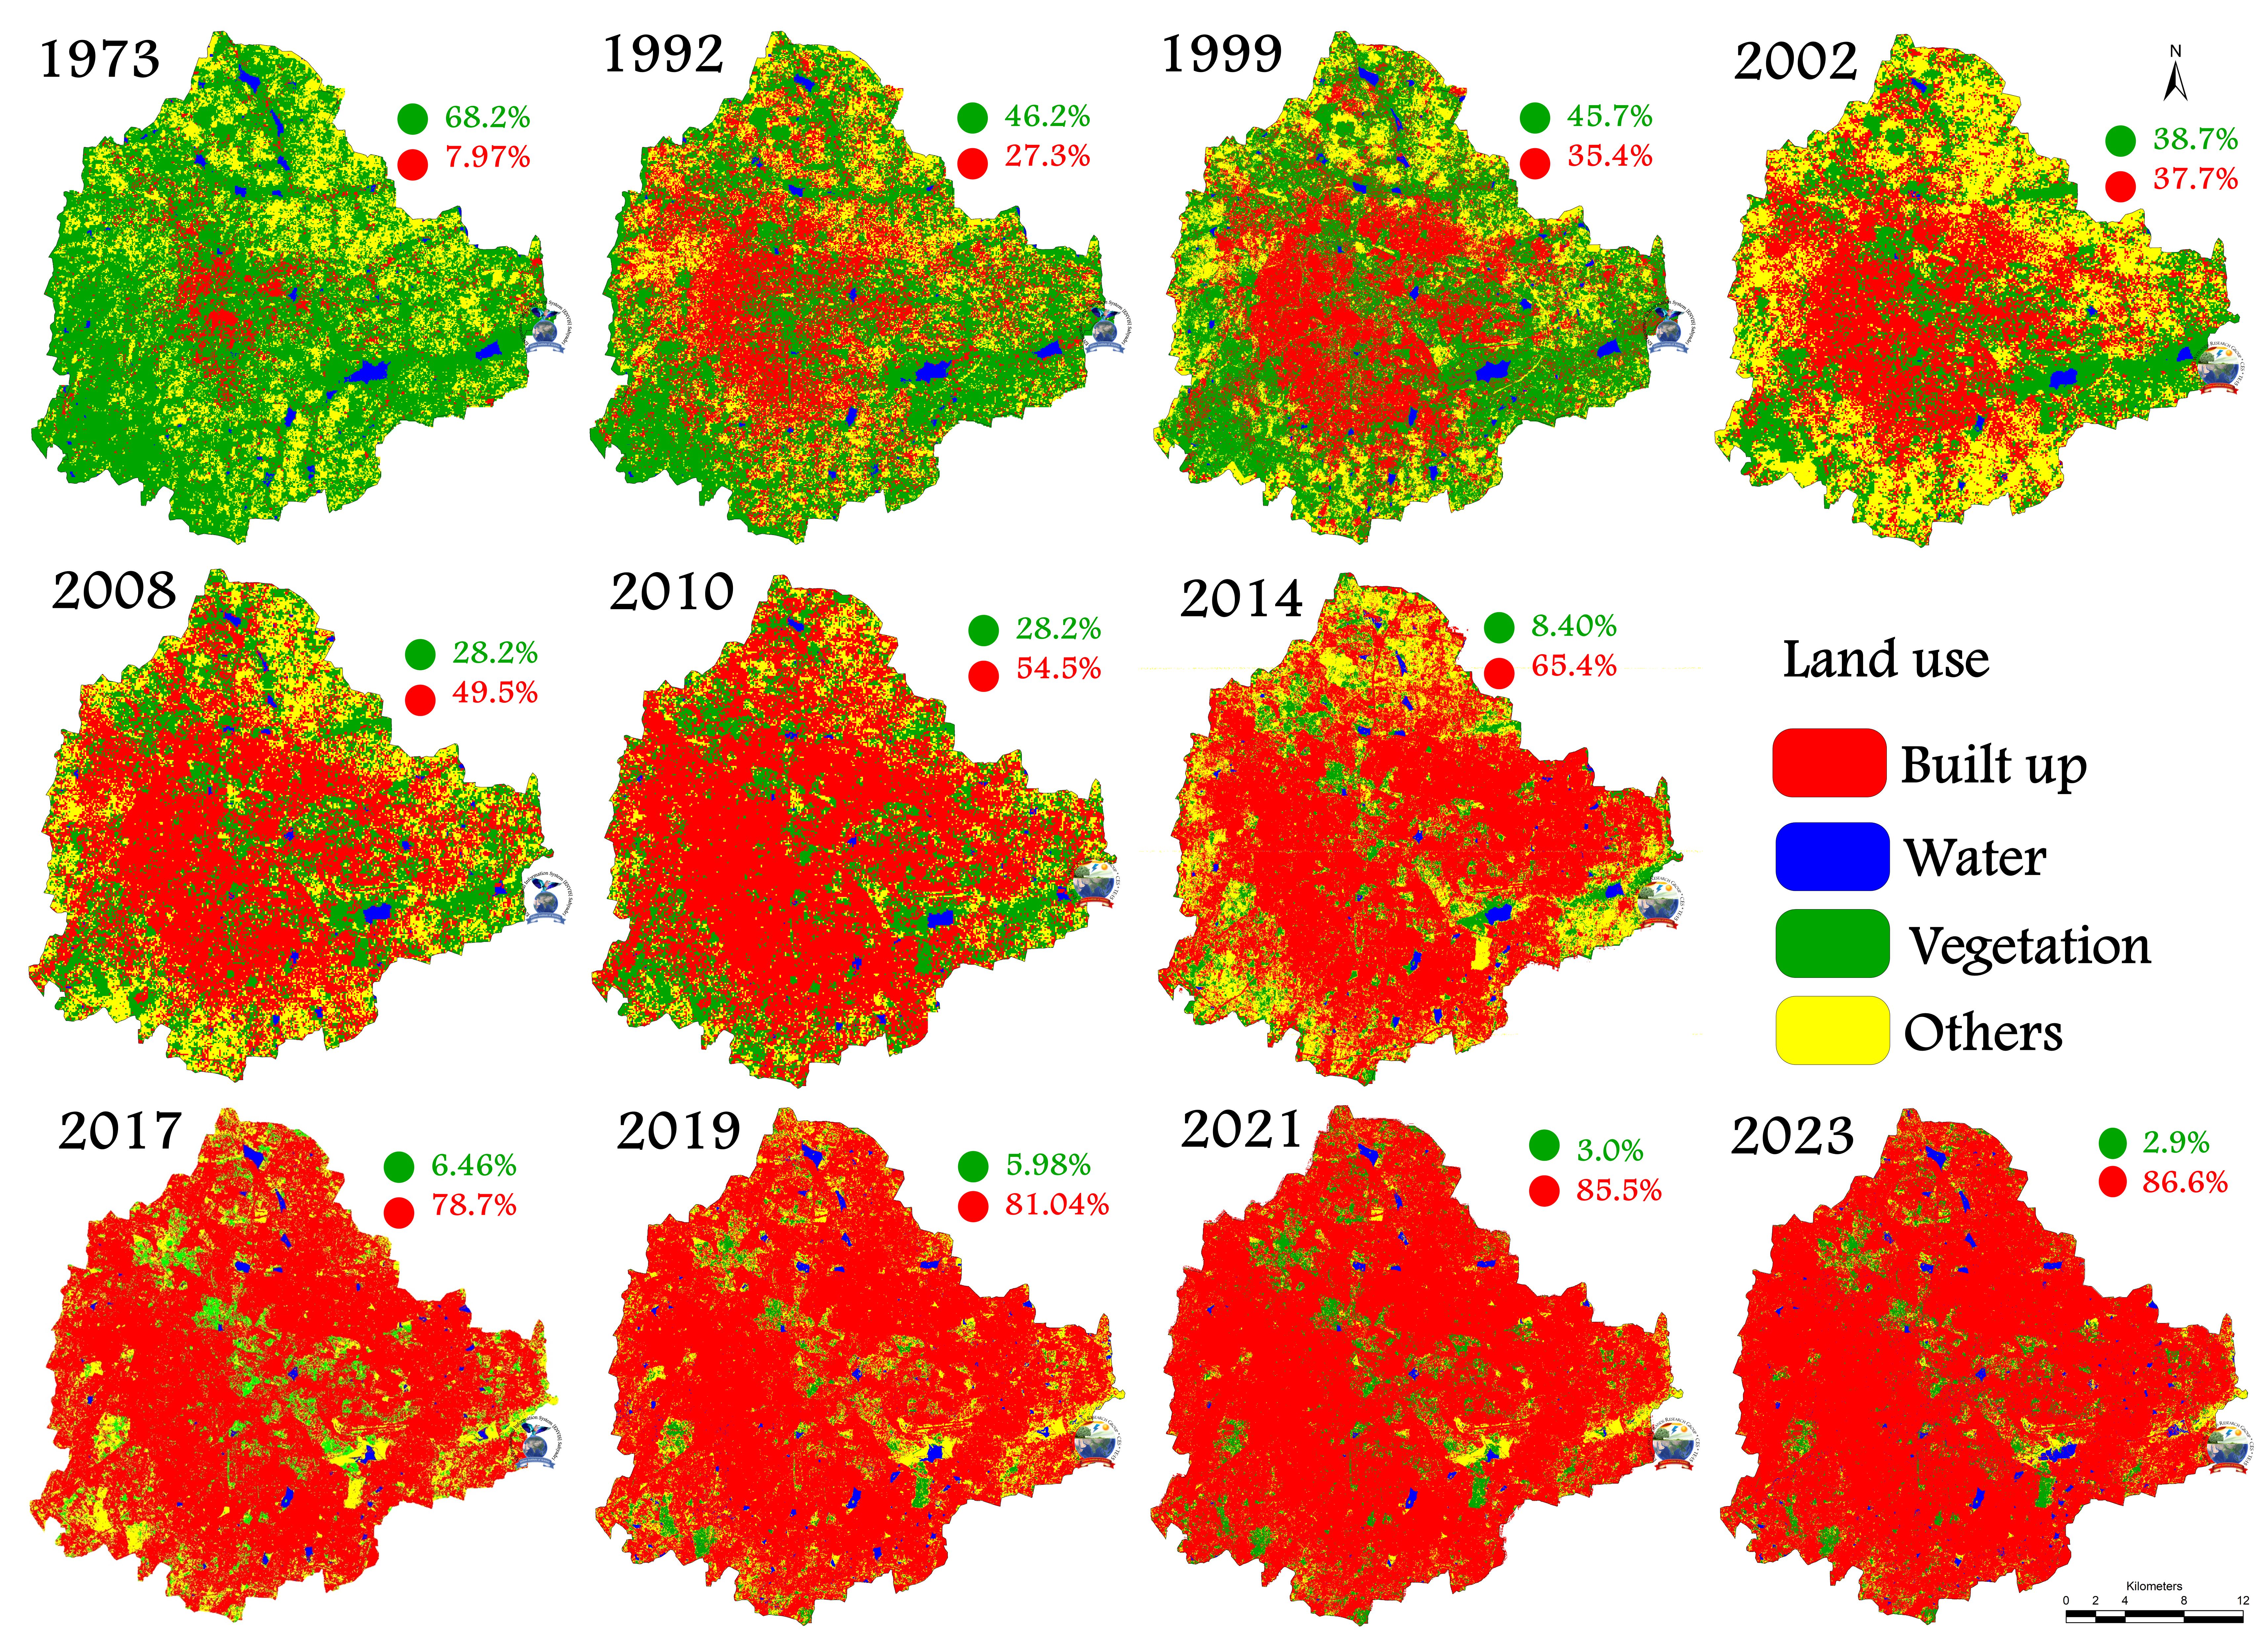
Figure 1: Land use changes in
Bangalore landscape during the past 50 years
|
Year/LU
|
Units
|
1973
|
1992
|
1999
|
2002
|
2003
|
2008
|
2010
|
2016
|
2017
|
2020
|
|
Built up
|
Ha
|
5448
|
18650
|
24163
|
26890
|
25782
|
35301
|
37266
|
54807
|
56046
|
66463
|
|
%
|
8
|
27.3
|
35.4
|
37.74
|
37.7
|
49.5
|
54.4
|
76.9
|
78.65
|
83.3
|
|
Vegetation
|
Ha
|
46639
|
31579
|
31272
|
27590
|
26453
|
20090
|
16031
|
5364
|
4603
|
2108
|
|
%
|
68.3
|
46.2
|
45.8
|
38.72
|
38.7
|
28.2
|
23.4
|
7.5
|
6.46
|
3
|
|
Water
|
Ha
|
2324
|
1790
|
1542
|
1317
|
1263
|
613
|
617
|
696
|
734
|
696
|
|
%
|
3.4
|
2.6
|
2.3
|
1.85
|
1.8
|
0.9
|
0.9
|
1
|
1.03
|
1
|
|
Others
|
Ha
|
13903
|
16303
|
11346
|
15462
|
14825
|
15256
|
14565
|
10394
|
9877
|
2002
|
|
%
|
20.4
|
23.9
|
16.6
|
21.70
|
21.7
|
21.4
|
21.3
|
14.6
|
13.86
|
12.7
|
Table 1: Land use transitions from
1973 to 2020
Major implications of unplanned rapid
urbanisation are:
-
loss of natural resources (wetlands and green
spaces);
- loss of interconnectivity among lakes;
- increased greenhouse gas footprint;
-
heat islands and increase of vector-borne
diseases;
- frequent flooding;
- decline in groundwater table;
- loss of water recharge capability;
- oxygen deficiency and acute water scarcity;
- mismanagement of solid and liquid wastes;
-
traffic bottlenecks and higher emissions from
the transportation sector
Environmentally sound urban centres with essential
basic amenities and advanced infrastructures (such
as sensors, electronic devices, and networks) would
stimulate sustainable economic growth and
improvements in citizen services. The deployment of
information and communication technology
infrastructures for effective governance supports
social and urban growth through an improved economy
and active participation of citizens. Indian cities
while exhibiting technological innovations and
connectedness, should also focus on increased living
comfort through adequate infrastructure, green
spaces, and essential basic amenities for every
citizen.
Unplanned cities not only contribute to global
climate change by emitting the majority of
anthropogenic greenhouse gases but also are
particularly vulnerable to the effects of climate
change and extreme weather. This emphaises the need
to improve urban sustainability through innovations
while addressing technical, ecological, economic,
behavioral, and political challenges to create
low-carbon, resilient, and livable cities.
Understanding spatial patterns of changes in the
land and prior visualization of growth are
imperative for planning sustainable management of
natural resources and mitigation of changes in
climate. This would help city planners when planning
how to mitigate the problems associated with the
increased urban area and population, and,
ultimately, build sustainable cities. In this
regard, the spatial decision support system –
BuiS aids in decision making with the visualisation
at disaggregated levels of (i) urban dynamics
(1973-2023), (ii) lakes – spatial distribution
with attribute information, (iii) trees – ward
wise distribution, (iv) administrative, (v)
demography – population trends, (vi)
environmental -sewage generated (ward wise),
rainfall (monthly average), digital elevation model,
(vii) Bangalore urban district (landscape
dynamics from 1973 to 2023, administrative
(boundary, taluk), environmental (ecologically
sensitive regions) for prudent management of natural
resources.


.png)