
|

|

|

LAKE RESTORATION TOWARD CREATING TOURISM INFRASTRUCTURE - Saibal K. De1 and Cherylann Lobo2

|
|
|
|
 ABSTRACT
MANSAGAR LAKE: THE CURRENT STATUS
PHYSICAL CHARACTERISTICS
LAKE PRECINCT AND CATCHMENT AREA OF THE MANSAGAR LAKE
CLIMATIC DATA AND RAINFALL
IRRIGATION IN DOWNSTREAM OF THE DAM
MIGRATORY BIRD HABITAT
PRESENT ECOLOGICAL STATUS
TOPOGRAPHICAL SURVEY OF EDGE CONDITIONS OF THE LAKE AND WATER VOLUME TO SURFACE SPREAD RELATIONSHIP
ASSESSMENT OF INFLOWS INTO THE LAKE
PRIMARY SURVEYS
TESTING OF WATER QUALITY OF MANSAGAR LAKE: GROUNDWATER QUALITY
LAKE WATER QUALITY
CONCLUSION FROM WATER QUALITY TESTS
HYDROGEOLOGY
SOIL STRATA INVESTIGATION & CHARACTERISTICS
THE LAKEBED CHARACTERISTICS
STEPS TOWARDS RESTORATION OF MANSAGAR LAKE
ASSESSMENT OF LAKE SUSTAINABILITY
HYDROLOGICAL MODELING
PROPOSALS FOR LAKE SUSTAINABILITY:DESILTATION
CATCHMENT AFFORESTATION
DIVERSION OF NALA (CHANNEL) AND ALTERNATIVE TREATMENT PLANT
ARTIFICIAL WETLANDS
TREATMENT OF SMALL WASTEWATER INFLOWS FROM WESTERN EDGE OF THE LAKE
MEETING DOWNSTREAM IRRIGATION REQUIREMENTS
AUGMENTATION OF AVIAN POPULATION
RESTORATIVE MEASURES FOR ECOLOGICAL BALANCE:-MEASURES OUTSIDE THE LAKE
ARTIFICIAL WETLANDS
HARVESTING OF VEGETATION
MEASURES INSIDE THE LAKE:-DE-WEEDING
INCREASING FRESH WATER INTAKE AS A MEASURE FOR DILUTION
BIOLOGICAL MANIPULATION
MONITORING OF WATER
WATER QUANTITY MONITORING
WATER QUALITY MONITORING
BIOLOGICAL MONITORING
TOURISM INFRASTRUCTURE IN AND AROUND THE LAKE
SOME OF THE MAJOR PROJECT AREA DEVELOPMENT COSTS ARE
CONCLUSION
TABLE1
TABLE2
TABLE3
TABLE4
TABLE5
TABLE6
TABLE7
TABLE8
TABLE9
ADDRESS
ABSTRACT
MANSAGAR LAKE: THE CURRENT STATUS
PHYSICAL CHARACTERISTICS
LAKE PRECINCT AND CATCHMENT AREA OF THE MANSAGAR LAKE
CLIMATIC DATA AND RAINFALL
IRRIGATION IN DOWNSTREAM OF THE DAM
MIGRATORY BIRD HABITAT
PRESENT ECOLOGICAL STATUS
TOPOGRAPHICAL SURVEY OF EDGE CONDITIONS OF THE LAKE AND WATER VOLUME TO SURFACE SPREAD RELATIONSHIP
ASSESSMENT OF INFLOWS INTO THE LAKE
PRIMARY SURVEYS
TESTING OF WATER QUALITY OF MANSAGAR LAKE: GROUNDWATER QUALITY
LAKE WATER QUALITY
CONCLUSION FROM WATER QUALITY TESTS
HYDROGEOLOGY
SOIL STRATA INVESTIGATION & CHARACTERISTICS
THE LAKEBED CHARACTERISTICS
STEPS TOWARDS RESTORATION OF MANSAGAR LAKE
ASSESSMENT OF LAKE SUSTAINABILITY
HYDROLOGICAL MODELING
PROPOSALS FOR LAKE SUSTAINABILITY:DESILTATION
CATCHMENT AFFORESTATION
DIVERSION OF NALA (CHANNEL) AND ALTERNATIVE TREATMENT PLANT
ARTIFICIAL WETLANDS
TREATMENT OF SMALL WASTEWATER INFLOWS FROM WESTERN EDGE OF THE LAKE
MEETING DOWNSTREAM IRRIGATION REQUIREMENTS
AUGMENTATION OF AVIAN POPULATION
RESTORATIVE MEASURES FOR ECOLOGICAL BALANCE:-MEASURES OUTSIDE THE LAKE
ARTIFICIAL WETLANDS
HARVESTING OF VEGETATION
MEASURES INSIDE THE LAKE:-DE-WEEDING
INCREASING FRESH WATER INTAKE AS A MEASURE FOR DILUTION
BIOLOGICAL MANIPULATION
MONITORING OF WATER
WATER QUANTITY MONITORING
WATER QUALITY MONITORING
BIOLOGICAL MONITORING
TOURISM INFRASTRUCTURE IN AND AROUND THE LAKE
SOME OF THE MAJOR PROJECT AREA DEVELOPMENT COSTS ARE
CONCLUSION
TABLE1
TABLE2
TABLE3
TABLE4
TABLE5
TABLE6
TABLE7
TABLE8
TABLE9
ADDRESS
| ABSTRACT: |


|
A clean fresh smelling lake is a source of pure pleasure, while on the other hand, a polluted, algae infested water body is a major eyesore. ECOLOGICAL BALANCE is the key word. In a balanced water body, organisms come into being, live, reproduce and die at a rate that is, for the most part, in proportion to the need. Each living organism is nourished by and is dependent on other living organisms contained in the same ecosystem. If the balance is disturbed in some way, the entire ecosystem is affected. It is a pity that many of the water bodies in India today have been affected and often act as a waste dump for the urban/ semi-urban population. With total disregard to environment, some of these wetlands fall prey to often-ignorant communities in search of an easy solution to waste disposal.
This is best illustrated in the Mansagar lake in Jaipur. The lake is a large manmade water body situated between the historic town of Amber and the walled city of Jaipur and forms a significant feature on the northern fringe of the city. The lake is an important component of the city's landscape due to its visual, environmental and attraction potential. The lake also influences micro-climatic modifications in the city. In a 'desert state' like Rajasthan, such wetlands provide the 'break in monotony' to the local population, in addition to fulfilling other needs like improvement of surrounding ground water, greenery, etc.
The lake today is experiencing "eutrophication" and truly resembles Jaipur's urban backyard. This paper is an attempt to address the rehabilitation and ecological restoration of the lake proposed to be employed in an effort to not only, improve the water quality but also sustain the lake at an appropriate level for realising its tourism and recreational potential.
|
MANSAGAR LAKE: THE CURRENT STATUS PHYSICAL CHARACTERISTICS |
|
The artificial lake was formed as a result of instituting a dam across river Darbhawati between Khilangarh hills and the hilly outcrop on the opposite hill (north) across the line of flow of runoff from the Nahargarh hills during the 18th century. It is today, the only significant water body in the city of Jaipur. Prior to this, a much smaller natural shallow lagoon existed, on the edge of which, the Jal Mahal structure was located. Jal Mahal, an architectural monument, is situated in the midst of Mansagar lake, built during the early eighteenth century (1735) [info from book "Rajput Palaces of Rajasthan"]. The spread of the lake was much smaller then. The present spread of the lake has also increased in recent times mainly due to the silt deposition as a result of erosion, decreasing the depth of the lake.
| LAKE PRECINCT AND CATCHMENT AREA OF THE MANSAGAR LAKE |
|
At present, the edge conditions of the Mansagar lake consists of reserve forest and dam on the east side, a road leading to Amber on the west side, and a colony Hazrat Ali Nagar on the south, and Kanak Vrindavan valley with temple complex and the reserve forest on the north side.
The environmental and ecological sustainability of the lake is connected to its 23.5 sq. km catchment, out of which, 40% is urban catchment, and the rest comprises the denuded Aravalli hills, which contributes to the silting of the lake.
| CLIMATIC DATA AND RAINFALL |
|
The Indian Meteorological Department (IMD) data for the last 20 years provides the following information. December to February is the cold season after which the hot season commences with a dry climate and continues up to the third week of June when the southwest monsoon sets in. The southwest monsoon season is comparatively short in this region and lasts only up to mid-September. Temperature for the period from March to June is continuously on the rise, May and the first half of June being the hottest parts of the year. The mean daily maximum and minimum temperature in June is 40.6o C and 25.8o C respectively.
The average annual rainfall in the district is 657.4 mm, based on rainfall data for the last 30 years available at IMD, Jaipur. The rainfall during June to September constitutes nearly 90% of the annual rainfall. The variation of the annual rainfall from year-to-year is very large.
| IRRIGATION IN DOWNSTREAM OF THE DAM |
|
At downstream of the dam, more than a thousand acres are irrigated by outflow of mixed Lake Water and raw sewage. The water demand for this is 2.41 MCM during the five months from November to March and it is the obligation of the Government of Rajasthan to provide the above water.
| MIGRATORY BIRD HABITAT |
|
Mansagar lake is the habitat to a variety of migratory and resident birds. Water provides sustainable living to countless species of the aquatic ecosystem like fish, birds, insects, microorganisms and aquatic vegetation. The lake attracts more than 150 species of migratory and resident birds (Tourism Wildlife Society of India), especially from September to March-April, which feed upon the aquatic fauna and flora. These birds give Jal Mahal and the lake a fascinating natural character.
Some of the migratory birds include Large Flamingo, Great Crested Grebe, Pintail, Pochards, Kestrel, Coot, Redshank, Marsh Sandpiper, Ruff, Herring Gull, Red Breasted Flycatcher, Grey Wagtail, etc. However, owing to deficiency of fish population as well as a lack of habitat, the residential or migratory bird population is not high. The adjacent reserved forest area is scantily vegetated and thus does not offer much by way of food or habitat.
| PRESENT ECOLOGICAL STATUS |
|
The lake suffers from serious problems of siltation and settled deposits, contamination from inflow of wastewater, decrease in surface area due to artificial land formation as a result of eutrophication and loss of water due to the outflow for downstream irrigation during summer.
| TOPOGRAPHICAL SURVEY OF EDGE CONDITIONS OF THE LAKE AND WATER VOLUME TO SURFACE SPREAD RELATIONSHIP |
|
The lake is approximately 130 ha in its full spread. The lake is at its maximum spread just after the monsoons and shrinks gradually to its least spread just before the monsoon. It may be noted that the full tank level is at 99.0 m contour (with reference level of Amber-Delhi Road as 100.0) (See Table 1).
| ASSESSMENT OF INFLOWS INTO THE LAKE |
|
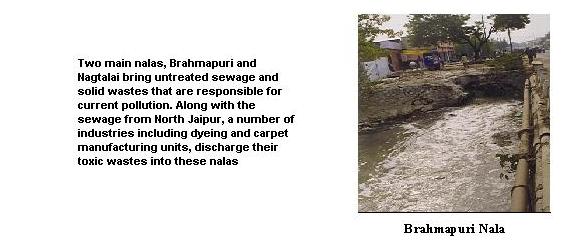
The lake being on the natural course of drainage of north Jaipur, receives a steadily increasing flow of partly treated and untreated wastewater. During heavy showers, the wastewater and runoff water get mixed and enter the lake through these nalas. The volume of flow from the various sources (currently) is recorded as follows:
The Brahmapuri nala carries the discharge from the city side and from the northern Sewage Treatment Plant (STP-27 million litre /day, extended aeration). The effluent of this plant has become vital to the sustenance of the lake, which would otherwise dry up in summer. However, the plant is only partly functional due to disrepair, thus, the post-treatment parameters of the effluent are not even of secondary quality. Further, a large part of the sewage is going untreated at present and volume of discharge from the STP will increase in the subsequent years as more and more areas are covered by the sewerage system.
| PRIMARY SURVEYS |
|
Towards ascertaining the current status of the lake, the following surveys were carried out.
|
TESTING OF WATER QUALITY OF MANSAGAR LAKE: GROUNDWATER QUALITY |
|
Water samples from a tube well located at the southern edge of the project area and a well on the eastern corner of the lake (Table 2 lists various parameters) were tested. While ground water in the vicinity is not potable, it is noted to be of high BOD as well as high in nitrate content.
| LAKE WATER QUALITY |
|
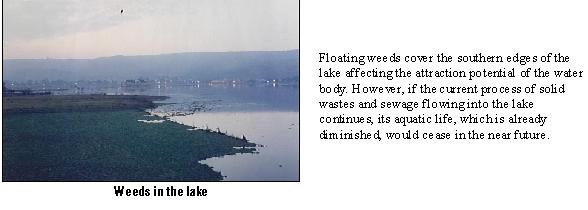
Owing to high level of pollutants in the various influent flows, the surface water quality of the lake is found to be very poor and the resultant high level of nutrients has led to the algal bloom (microphytes). This has resulted in eutrophication on southern shores. Land formation as a result of decayed plant settlement is evident near out falls of the major nalas.
The physicochemical and biological examination of water samples (location-wise) is given in Tables 3, 4 and 5 respectively. Water quality tests show high level of nutrients, resulting in the production of macrophytes and microphytes and rooted weeds on the edge. High levels of BOD and COD lead to low DO level, which combined with high chloride levels leads to absence of aquatic life.
| CONCLUSION FROM WATER QUALITY TESTS |
|
| HYDROGEOLOGY |
|
The localised ground water table is high and exploratory bores show that it is merged with the surface water. The topography around the lake is sloping towards it except downstream of the dam. Slopes have marginal topsoil and scanty vegetation due to the elevated and exposed nature of the bedrock. In view of the sandy nature of the sub-soil, the permeability factor is quite high except that in practise this is countered by the saturation of the sub-strata up to impermeable bedrock consisting of hard quartzite. The withdrawal of ground water in the vicinity would have to be regulated to check percolation losses through the lakebed.
| SOIL STRATA INVESTIGATION & CHARACTERISTICS |
|
The soil samples were taken from five locations in the lakebed itself for chemical test and analysis. The test results are shown in Table 6. The results of chemical analysis suggest that the nitrate and phosphate contents in the sediments are high. This adversely affects the growth of rooted plants. Further, as the sediments are polluted these interfere with growth and survival of benthic organisms. Lack of dissolved oxygen and pollution near the lakebed results in low survival of bottom feeding fish.
Two distinct layers of silt can be observed. One is about 150-200 mm thick and light coloured that comes by erosion from the surrounding catchment area in the monsoon season, and the other is 25-50 mm thick and dark coloured, which shows that the lake acts as a sedimentation bed throughout the year.
| THE LAKEBED CHARACTERISTICS |
|
The lakebed has increasingly become the depository of eroded silt materials and settled pollutant material from the influent nalas. Boring on the bed of the lake at three locations, gives the information about the strata, shown in Table 7. The deposits in the lakebed consist of alternate layers of eroded silt and settled pollutants. The former is buff coloured like the hill soil whereas the latter is dark coloured. Eroded silt deposition has taken place as a result of rainfall on steep and poorly vegetated slopes and these deposits have accumulated in the northern part of the lake. The substantial level of silting has in fact decreased the water holding capacity of the lake while increasing the spread, which in turn has lead to increased percolation and evaporation losses. This silt also includes pollutants that have settled on the lakebed and water percolating to the underlying aquifer leaches through these deposits. It is estimated that the volume of these eroded deposits would be in the region of 2.5 MCM, whose removal would be a mammoth task having tremendous financial and logistical implications. The nutrient content of the silt will be released into the lake tending to create eutrophic conditions in the lake for years to come.
| STEPS TOWARDS RESTORATION OF MANSAGAR LAKE: |
|
Since Mansagar lake is one of the central components for tourism and recreational development in the area, a comprehensive scheme is envisaged to deal with the catchment to improve water quality of the lake and arrive at sustainability of the lake round the year through a suitable hydrological model. The upgrading of water quality of the lake to restore its ecological balance, as well as maintenance of the appropriate standards of water quality in the lake has been addressed, together with a perennially sustainable volume/spread form of the lake as well as the requirements of the downstream irrigation.
The quantitative management of the lake is connected to three main components: catchment area treated effluent inflows and storm water outflows (including downstream irrigation requirements), loss components and lake water relationship with Jal Mahal. The water quality management hinges upon diversion of sewage inflows, arresting soil erosion in the catchment, water treatment methods employed and the biological manipulation.
| ASSESSMENT OF LAKE SUSTAINABILITY |
|
With modifications in the actual spread of the 98-m contour level, the water volume and spread of the lake are found sustainable. Maintaining this level provides sufficiently a large area on the lake edge for development of tourism related activities. Furthermore, this level frees the lower storey of Jal Mahal for reuse and would be less damaging to the structure. The maintenance of a suitable depth of 2 m at least in a major portion (say about 90% of the surface) of the lake and a corresponding spread is an essential objective.
Towards sustainability of the lake through the year, an analysis of a hydrological model on a monthly basis shows that a good monsoon's rainwater cannot be retained in the lake owing to limited capacity leading to flooding of the project area. Similarly, untreated sewage inflow from the nalas round the year also cannot be accepted. The matrix clearly brings out the only workable solution is to treat the available effluent to tertiary parameters and replenish the daily losses with the same.
| HYDROLOGICAL MODELING |
|
A significant issue is the level at which the lake has to be maintained to ensure the desired water level throughout the year. The volume of water in the lake declines from a maximum of 3.13 million cubic metres (MCM) to a minimum of 0.36 MCM from October to June of the following year. Similarly, the surface spread over the same period declines from 139 ha to 49 ha. Correspondingly, the depth declines from a maximum of 4.5 m to a minimum of 1.5 m at the deepest location.
This drastic variation has to be addressed in order to maintain the lake's dimensional parameters at an appropriate level so as to enable the lake to play its essential role in the project. In this regard, while natural losses like evaporation and percolation cannot be controlled, the deliberate letting out of the water for irrigation purposes is a factor, which can be controlled in a balanced way so as to maintain the requisite quantity of water in the lake.
A hydrological model has been generated whose primary objective is to examine whether the water spread and volumetric content of the design contour level is sustainable. The formula used for this model is as follows and a part, representing the average monsoon has been shown in Table 8.
Initial water balance in lake + Direct rainfall + Rainwater runoff from the catchment + Regular inflow of treated and untreated sewage - Evaporation losses - Percolation losses - Outflow for irrigation - Spill over = Resultant Water Balance (Designed
|
PROPOSALS FOR LAKE SUSTAINABILITY: DESILTATION |
|
The heavy silt deposits are to be removed from dry portions of the lake. The desiltation has to be carried out mechanically in the dry areas of the lakebed from March to June, but may require more than one season. The silt is mainly sandy soil although rich in nutrients and the volume to be removed is 700,000 cu.m. and will be used in land formation along the Amber-Jaipur road, in surface spreading in the southern project areas, in the Forest Valley, in island formation etc. The desiltation will be above the 96 m contour level and up to the 98.0 m RL. This will result in a new spread and volume of the lake as follows:
Spread: 1.11 sq. km. (111 ha)
Volume: 2.42 MCM
The revised geometrical characteristics of the lakebed will be flat in the de-silted portions with certain channels to enable boating even in the late summer of a dry year when the general depth will be quite shallow. The newly formed shoreline to have an edge slope of 1:3. This will result in a lesser decline in surface spread with loss in volume as compared to earlier. Further, it will make available a depth of 1.5 m or more in 90% of the lake area making it suitable for various kinds of boating and sailing activities.
| CATCHMENT AFFORESTATION |
|
To decelerate the erosion in the catchment and thereby arrest or slow the siltation of the lake, afforestation in the hill catchment is recommended. This would not only increase the visual attraction but also result in moderation of the microclimate and greater retention of soil moisture resulting in a possible increase in subsurface flow towards the lake.
| DIVERSION OF NALA (CHANNEL) AND ALTERNATIVE TREATMENT PLANT |
|
It is proposed to make Brahmapuri nala a lined channel and connect it to the Nagtalai nala, which would be diverted downstream of Mansagar dam so as to prevent the inflow of raw sewage and low-grade effluents into the lake. A 13.6 MLD extended aeration STP (new) would be commissioned outside the project area with an estimated area of 0.75 ha. The plants would intake effluent from the Brahmapuri nala and after treatment, discharge the upgraded secondary quality effluent to the proposed artificial wetlands for further upgrading before being discharged into the lake.
| ARTIFICIAL WETLANDS |
|
The artificial wetlands based upon the aquatic root zone system are a well-known and highly economical process for upgrading wastewater. An area of 2.5 ha is required for this activity.
| TREATMENT OF SMALL WASTEWATER INFLOWS FROM WESTERN EDGE OF THE LAKE |
|
Wastewater inflows amounting to 250 cu.m./d. come in from across Amber road is proposed to be treated by commissioning a small settling tank of 50 cu.m. capacity. The tank would be equipped with chemical dosers for adding coagulants. (Alternatively, a bioreactor plant of 0.25 MLD capacity can be installed which would produce an effluent of secondary parameters). After the settling tank, a duckweed lagoon would be created to further improve the water quality. An alternate proposal is to connect this wastewater flow to Brahmapuri nala.
| MEETING DOWNSTREAM IRRIGATION REQUIREMENTS |
|
The annual statutory quantitative requirement of 2.41 MCM for downstream irrigation will be met.
| AUGMENTATION OF AVIAN POPULATION |
|
Several direct and indirect measures to this effect are proposed as follows:
|
RESTORATIVE MEASURES FOR ECOLOGICAL BALANCE MEASURES OUTSIDE THE LAKE |
|
Two alternatives of conventional wastewater treatment are recommended: Aquatic Plant System and Constructed Wetlands. These have been employed as a tertiary treatment system. The water is impacted to be of weak strength i.e. BOD-20 mg/L and Total nitrogen-20 mg/L.
| ARTIFICIAL WETLANDS |
|
Secondary treated effluents from the STP with an average BOD of 25 mg/L, total nitrogen 20 mg/L, and total phosphorous 25 mg/ L are received in an artificial wetland through a perforated PVC pipe running along the length of the artificial wetland. The perforated pipe is to have close perforations, which are to be surrounded by stones for diffused dispersion in the wetland. Due to high nutrient and water inputs, wetlands are able to store, transform and cycle nutrients. Wetlands are able to filter and hold 60-90% of suspended solids and sediments from wastewaters. The main types of aquatic plants used in constructed wetlands are the common reeds Eichhornia Crassipes (Phragmitis Australisis) and Cattails (Typha latifolia). These plants have a root system of rhizomes that are capable of releasing oxygen in the root zone or sub surface zone, developing an aerobic zone around the rhizomes and base of stems. Consequently wastewater passing through the wetland encounters alternate aerobic and anaerobic zones. The root zones support aerobic and anaerobic populations and the rest supports anaerobic microbial populations.
The unique shift from aerobic to anaerobic sub surface conditions gives these systems ability to process PO4, NO3, SO4 and C to release gases (N2O, H2S, CH4, CO2, etc.). Aerobic process supports intensive materialization with aerobic digestion. Both processes, give products that are harmless and inoffensive (CO2, CH4, Cells, H2O). Any pathogenic organisms are removed because they are used as additional organic material for mineralisation. Additionally, most strictly anaerobic pathogens are killed in the presence of oxygen and sunlight.
In the deeper regions of the constructed wetlands anaerobic conditions are present. Here, anaerobic digestion of organic waste by anaerobic bacteria and saprobic protozoans occurs. The breakdown of complex organic matter occurs as bacteria utilize these for their own metabolism. Volatile reaction products like CH4, C2S and NH3 occur along with breakdown products of fatty acids and proteins. In the aerobic conditions, bacteria, saprobic protozoans (SP) and hologenic protozoans that feed upon bacteria and certain fungi are present. The microorganisms feed upon the suspended organic matter and utilize oxygen released by wetland plants in the root zone during metabolism releasing CO2. Thus, digesting oxygen demanding waste and reducing the BOD.
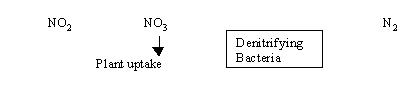
In addition, nitrifying and denitrifying bacteria also occur. These are part of natural nitrogen cycle. During passage through sewerage system, almost all the urea is converted to ammonia and carbon dioxide (NH3 & CO2). The inorganic nitrogen is removed by bacterial or algal transformation. The ammonia in water is first nitrified to nitrite and nitrate then de-nitrified to molecular nitrogen in absence of O2. Aerobic bacteria carry out nitrification in 2 stages:
1) O2 + NH4 + Nitrosomonas NO2 + H + H2O
SP
2) NO2 + O2 Nitrogen NO3
SP
These nitrates and nitrites are either denitrified by bacteria Pseudomonas, Achromobacter and Bacillus or absorbed by plants for meeting their nutrient requirement.
Denitrification occurs in anaerobic zone and nitrification occurs in aerobic zone. Table below shows removal of various pollutants from secondary effluents in a wetland.
|
Pollutants from secondary effluent |
% removal |
|
BOD |
70-90 |
|
SS |
60-90 |
|
Nitrogen |
40-90 |
|
P |
Seasonal |
In the system under consideration, as the climatic conditions remain conducive throughout the year, it can be safely concluded based on the data available that 90% BOD, 90% N and a variable % of P is removed from the water by the wetland of surface area 2 ha and 2 m depth (i.e. having a capacity of 40000 cu.m.) giving a retention time of 3 days. The water, after treatment in the wetland, contains up to 3 mg/L BOD, 2 mg/L of Nitrates and 10-12 mg/L of P.
The wetland is to be planted with Tpyha, Phragmitis and Scripus and is to have floating duckweed plants. It will have an area of 2 ha having a slope of 1% to ensure a very gentle flow. Post wetland, the waters are allowed into the Bramhapuri nala (left channel), which is to function as a hyacinth channel. At the interface with the lake, a zone of comparatively high productivity is expected.
For polishing of residual amounts of BOD, N and P, it is recommended that duckweed plants be also introduced in the wetland. Duckweed, like water hyacinth, grows rapidly and therefore their regular harvesting ensures quick nutrient removal. 50-90% BOD removal from low strength wastewater has been reported. Duckweed doubles in biomass every two days and the area is covered every four days. This prolific growth is because of quick absorption of nutrients from effluents. As duckweeds are very small plants with roots of 10 mm length, these are less effective in BOD removal and much more effective in nutrient removal. With the use of duckweeds it is expected that the nitrogen content would reduce to 0.2 mg/L from 1 mg/L. It would also reduce the phosphorus to about 6 mg/L. At 27oC these plants double in area every four days. Their dry weight is 252 kg/ha. The table given below is the composition of duckweed grown in wastewater:
TABLE: COMPOSITION OF DUCKWEEDS GROWN IN WASTEWATER
|
Constituent |
Average (% dry weight) |
|
Crude protein |
38.7 |
|
Fats |
4.9 |
|
Fiber |
9.4 |
|
Ash |
15 |
|
Carbohydrate |
35.5 |
|
TKN |
5.91 |
|
Phosphorous, as P |
0.6 |
Phosphorous removal in many wetlands is not very effective because of the limited contact opportunities between the wastewater and the soil. Some phosphorous removal does occur in the hyacinth channel. In the wetland, if the soil has significant clay content, the presence of iron and aluminium will enhance the potential for phosphorus removal. Removal of heavy metals like Cu, Zn and Cd has been reported at the rate of 99 % for a residence time of 5.5 days. Phosphorous removal and metal removal will be finite due to exhaustion of exchange sites.
The treated effluent from artificial wetland is to be transferred into left channel of Bramhapuri and Nagtalai nalas through a conduit. The left channel is to function as a hyacinth channel sized for 24-hour retention capacity for 12000 cum. This left channel is to be planted with hyacinth plants. The water hyacinth is to be harvested weekly. Here floating aquatic plant system (planted with water hyacinth) has been suggested as this plant has a very high growth rate. For Indian climate, growth of water hyacinth has been reported to be up to 220 kg/ha/day. The plant derives carbon dioxide from the atmosphere directly and mineral nutrition from the water. Hyacinth is to be harvested in a manner that complete harvesting takes place every second week. It is suggested that alternate 1m channel stretches of the plant be harvested every week.
Water hyacinth has been used because of its high biological productivity, and ability to remove BOD and nutrients from wastewater. Regular harvesting ensures removal of nutrients from the system. Harvesting of plants is of particular importance for nutrient removal. Water hyacinth flourishes in tropical areas, grows rapidly and doubles in about six days. The evapo-transpiration rate for hyacinth is three to five times greater than that for open water. The removal rates for different substances through hyacinth is given below:
After the hyacinth channel the waters would contain 0.25-1.0 mg/L BOD {< 3 mg/L) and 0.12 -0.2 mg/L of Nitrates {<0.3 mg/L) and a variable amount of P, ranging from 5- 6 mg/L. Therefore, in conclusion, the water quality based on available data shows that water quality Class D {CPCB (Central Pollution Control Board) classification} is suitable for wildlife and fisheries can be allowed.
| HARVESTING OF VEGETATION |
|
Generally, harvesting of wetland vegetation is not necessary. But for nutrient removal, several harvests per season may be useful. Harvesting is also done to avoid buildup of hillocks of grasses, which encourage canalization. The harvesting is to be done manually.
|
MEASURES INSIDE THE LAKE: DE-WEEDING |
|
As there is prolific growth of weed, it has to be harvested so as to remove this biomass from the lake system. The weeds should be harvested on a monthly basis, when about 3/4th of the total mass is harvested. The harvested weeds are to be either composted or burned and the residual ash should be disposed away and outside the lake's watershed. The remaining is allowed to grow till the next harvest. This activity tends to reduce the nutrient level in the lake waters and accordingly, the growth of weeds is expected to slow down with the passage of time.
| INCREASING FRESH WATER INTAKE AS A MEASURE FOR DILUTION |
|
No fresh water inflow can be arranged except for rainwater runoff. With the monsoon runoff, the lake receives large quantities of fresh water. Occasional showers during the course of the year cause direct precipitation on the lake surface. This helps in diluting the concentration of nutrients and stabilising the lake ecosystem.
| BIOLOGICAL MANIPULATION |
|
At this stage, extensive water analysis is to be done to assess the water quality. In case high BOD and low DO levels prevail, top feeder fishes like grass carp (Ctenopharyngodon idella), catla (Catla catla), mirror carp (Cyprinus carpio), silver carp (Hypothalmichthys molithrix), kalbans (Labeo kalbans), rohu (Labeo rohita) and malli (Wallage alta - a predator) are to be introduced. These fishes would feed upon the lower life forms and help in completing the food cycle. Breeding of fishes, especially herbivorous ones will help in the removal of locked up nutrient through their consumption of phytoplankton and macro-phytes.
After one season, the bottom feeders are also introduced. An example of a bottom feeder is the mrigal (Cirrhinus mrigala). Mrigal feeds on the detritus and is an important link in completing the food cycle and therefore the biogeochemical cycle as well. Mosquito larvae breed in stagnant waters, and to control the mosquito population, a fish Gambusia affinis can be introduced in the lake. This fish commonly known as 'guppi' selectively feeds on mosquito larvae and thus effectively controls the mosquito population.
Once the water quality is improved, certain freshwater fishes that are sensitive to environmental quality should be introduced. These are chanda (Chanda nama), mourala (Amblypharyngodon mola), and punti (Puntius sophore and P. conconius). The survival and growth of these species are positive indicators of improvement in water quality. This activity is to be taken up only after completing the previous measures.
Indirectly, the increase in bird life would also contribute to the removal of aquatic organisms, aquatic vegetation and fishes from the lake water thus facilitating the removal of nutrients from the lake to some extent.
The focus of efforts in curbing a tendency towards eutrophication is the monitoring of Nitrogen (N) Phosphorous (P) ratio. N and P are taken up by phytoplankton at a mass ratio of 7.2:1. Limitation of biomass production results if there is significant variation in this ratio. The critical N: P is about 10:1 (However, water hyacinth is able to flourish in ratios of 2.3-5:1).
Therefore, some P removal occurs in the hyacinth channel as mentioned previously, although quantification of the same is not possible here. In the lake, N is likely to become the limiting factor. When N > 7 and <12, both nutrients are non-limiting, promoting production and therefore eutrophication. In the present situation, the N: P ratio likely to be achieved would be limiting the tendency towards eutrophication with N being the limiting factor. The dilution of lake water achieved annually during monsoons and by other occasional rains would reduce the concentration of nutrients. This is especially so, as the reservoir level is allowed to decline in summer, so as to retain as much rainwater in the monsoons as possible.
The removal of P is higher within the reservoir as it is adsorbed into the sediments and subsequently mineralization occurs slowly. The efficiency of reservoir to remove P has been reported to be 50 % in contrast to N removal, which is significantly high in the wetland due to nitrifying - denitrifying mechanism. The uptake by plants is considerable. Harvesting of plants is, thus, a critical factor in removal of nutrients.
| MONITORING OF WATER: |
|
Regular monitoring of the water quality at the post-treatment stage, post-wetland stage and of the lake water is an essential tool for lake management. The following should be considered:
| WATER QUANTITY MONITORING |
|
This is the first stage in monitoring. Close monitoring of water level in the lake is necessary as it has a direct bearing on the water quality.
| WATER QUALITY MONITORING |
|
For this, regular chemical analysis of water samples collected from specified locations in the lake is necessary. Regular chemical analysis of effluent from the 'artificial wetlands' for BOD, DO, nitrates, phosphates, turbidity and TSS is also necessary. This would help in ascertaining the amount of nutrients that flow in the lake and need to be done after every stage i.e., after physical manipulation (revival of lake water), mechanical harvesting of water weeds and manipulation of biological equilibrium. This would ascertain the 'trophic' state of the lake. The next step would depend on the amount of nutrients present in the lake after previous stage. These parameters have a direct effect on survival of organisms in the lake and are summarised in Table 9.
It is proposed to achieve at least Class D quality criteria of surface waters as outlined by Central Pollution Control Board in the table below:
|
Classification |
Parameters |
Quality Criteria |
|
D. Propagation of wildlife and fisheries |
Coliform MPN B.O.D. D.O. Toxicants Temperature |
<5000/100 ml. <6 mg/L >4 mg/L No acute toxicity Range 5o - 25o |
| BIOLOGICAL MONITORING |
|
Biological monitoring can provide information on the overall status of the aquatic ecosystem since aquatic organisms can integrate the various factors affecting their surrounding environment. For biological monitoring, the phytoplankton population and survival of fishes have to be watched at all times. High level of nutrients accelerates plant growth. If the growth of water plants increases and they proliferate, they should be harvested. Similarly, if the population of fishes increases, they have to be harvested. Finally, the water quality is to be assessed for DO, BOD, TDS, TSS & free ammonia every quarter after the introduction of fishes in the lake till at least quality class D parameters, enumerated above, are achieved.
| TOURISM INFRASTRUCTURE IN AND AROUND THE LAKE: |
|
Currently, the lake has a varying spread of 162 - 81 hectare with a depth of 2-6 feet. It is envisaged that the lake will be restored at 111 hectare spread with a depth of about 5.0 feet after diversion of sewage flows and de-silting. This will leave an area of approximately 66 hectares of land for development of eco-friendly tourism infrastructure facilities on a commercial basis. These facilities will be integrated with the existing surroundings and will become the basis for making the whole project financially viable.
The area around the lake is being developed as a social infrastructure project with open spaces in the form of parks, pedestrian nature trails and nesting islands, which will be open to public without any entry charges. However, in view of the initial physical development cost as well as the provision of low and non priced activities of the project, it is imperative to develop high revenue generating activities which shall cross-subsidise the developmental cost.
|
S.No. |
Project Component |
Cost (Rs. in Million) |
|
1. |
Restoration of Jal Mahal |
16.6 |
|
2. |
Diversion of nalas |
22.5 |
|
3. |
Sewage Treatment Plant |
20.0 |
|
4. |
De-silting of the Lake |
70.0 |
|
5. |
Development of Park |
9.0 |
|
6. |
Pedestrian Nature Trails |
2.5 |
|
7. |
Nesting Island for Migratory Birds |
1.5 |
|
8. |
Utility Services/ Infrastructure facilities |
35.0 |
|
Total Development Cost |
177.1 |
|
The above development costs need to be incurred up front by the developer.
The site structuring exercise primarily focussed on issues such as disposition of open spaces, accessibility to the site, the movement network and related activities such as parking within the site, zoning of the activities to ensure a harmonious distribution of activities.
Site structuring is critical in order to achieve an environmentally sensitive development and harmonious environment that respects the lake, Jal Mahal and other historical monuments in the area.
The following revenue generating options have been arrived based on the demand assessment of domestic and foreign tourists as well as local residents and environment and cultural significance of the commercial facilities in and around the lake.
|
S.No. |
Facility |
|
1. |
Roof top café cum lounge at Jal Mahal - Visitors to Jal Mahal will be provided with a cup of tea/coffee/cold drinks. No meals will be served. - No permanent structure will be made |
|
2. |
Museum in Jal Mahal Monument Traditional Rajasthani artifacts will be displayed Display area will be limited to ground and first floor only. |
|
3. |
Boating in the lake No. Of Jetties = 3 No motorised boats will be permitted. Maximum boats allowed at one time = 50 |
|
4. |
Ethnic restaurant /Lake front restaurant Regular meals with a mix of traditional and contemporary cuisine will be served |
|
5. |
Traditional Technology Park in the surroundings. It will include craft fairs with changing themes of traditional craft, practices and technologies. Total Area = 4 hectare, No. of Shops = 150 |
|
6. |
Sports and Sailing Club with water sports Facilities: Sailing, Indoor Sports, Tennis etc Total Area = 4 hectare, No. of Jetties = 1 |
|
7. |
Heritage Resort Category = 3 – Star, Total Area = 4 hectare Maximum Ground Coverage=10%. |
|
8. |
Amusement Park A state-of-the-art thematic park for children. Total Area = 5 hectare, Maximum Ground Coverage=10% |
|
9. |
Sound & Light Show The cultural resources and history of Rajasthan or Making of Jaipur will be shown Location: Mansagar Dam Seating Capacity: 200 |
|
10. |
Heritage Village Providing tourist accommodation in traditional environment (Authentic Rajasthani settlement) Total Area = 5 hectare, Maximum Ground Coverage=20% |
| CONCLUSION: |
|
Realising the importance of an urban wetland today together with involvement of multiple agencies of the Government to be involved in administrative issues related to these bodies and rehabilitation of such facilities, is no easy task. The land issues involved compound the task since the wetland is within the prime urban area. However, this is an attempt to comprehensively address all the issues involved and create a framework to be able to implement the project and restore Mansagar lake to its past glory where there is ecological balance and environmental sustainability.
An effort is made here to address this project in a replicable format, so that the issues and the lessons can be utilised elsewhere for a similar project, to rescue another wetland from eutrophication and extinction.
| TABLE 1: WATER VOLUME TO SURFACE SPREAD RELATIONSHIP |
|
|
S.No |
Contour (m) |
Area Sq. m |
Volume (MCM) |
|
1. |
95 |
189652.61 |
47409.3 |
|
2 |
96 |
492591.84 |
369443.25 |
|
3 |
97 |
848427.12 |
1060533.75 |
|
4 |
98 |
1136805.37 |
1814408.75 |
|
5 |
99 |
1394031.46 |
3136569.75 |
|
6 |
100 |
1618840.38 |
4249455.57 |
| TABLE 2: RESULTS OF THE GROUND WATER QUALITY TESTS |
|
|
Particulars |
Well on eastern side of lake |
Tube well at south edge of the lake |
|
PH |
7.3 |
7.4 |
|
B.O.D. |
10 |
12 |
|
C.O.D |
60 |
60 |
|
Chloride (Cl2) |
380 |
840 |
|
Sulphate (SO4) |
193 |
365 |
|
Phosphate (PO4) |
0.5 |
TRACE |
|
Nitrite (NO2) |
32 |
34 |
|
Nitrate (NO3) |
60 |
40 |
|
Total Dissolved Solids |
1840 |
2660 |
|
Coliform Organism MPN/100 ml. |
3900 |
488800 |
|
E.Coli MPN/100 ml. |
23 |
11000 |
| TABLE 3: RESULTS OF THE PHYSICO-CHEMICAL EXAMINATION OF THE SAMPLES COLLECTED ON THE MORNING OF 1/5/2000 |
|
|
Particulars |
Brahma-puri |
Nagtalai |
Nala (Amber) |
Lake (south of JM) |
Lake (centre of water body) |
Standard |
Remarks |
|
PH |
8 |
8 |
8 |
8.3 |
8 |
6.5-8.5 |
|
|
Initial D.O. |
- |
- |
- |
- |
- |
||
|
B.O.D. |
130 |
85 |
40 |
35 |
60 |
<3 |
High |
|
C.O.D |
462.88 |
252.48 |
126.24 |
126.24 |
231.44 |
0.5 |
High |
|
Chloride (Cl) |
340 |
380 |
460 |
540 |
390 |
High |
|
|
Sulphate (SO4-2) |
28 |
38 |
130 |
60 |
35 |
||
|
Phosphate (PO4) |
21.5 |
10.75 |
7 |
14 |
5.25 |
0.03 |
High |
|
Nitrite (NO2) |
44 |
24 |
30 |
23 |
36 |
||
|
Nitrate (NO3) |
- |
- |
- |
- |
- |
0.3 |
|
|
Kjeldahl Nitrogen |
- |
- |
- |
- |
- |
||
|
Total Solids |
- |
- |
- |
- |
- |
||
|
Total Dissolved Solids |
1160 |
1760 |
1920 |
2000 |
1840 |
400 |
High |
|
Total suspended solids |
120 |
60 |
30 |
30 |
260 |
High-acceptable |
|
|
Oil and grease |
Nil |
Nil |
Nil |
Nil |
Nil |
| TABLE 4: RESULTS OF THE PHYSICO-CHEMICAL EXAMINATION OF THE SAMPLES COLLECTED IN THE EVENING OF 14/5/2000 |
|
|
Particulars |
Brahma-puri |
Nagtalai |
Lake (centre) |
Standard |
Remarks |
|
PH |
7.6 |
7.7 |
8.2 |
6.5-8.5 |
|
|
Initial D.O. |
|||||
|
B.O.D. |
230 |
140 |
46 |
<3 |
High |
|
C.O.D |
707.2 |
457.6 |
130 |
0.5 |
High |
|
Chloride (Cl) |
280 |
330 |
500 |
High |
|
|
Sulphate (SO4-2) |
5 |
38 |
55 |
||
|
Phosphate (PO4) |
13.45 |
10 |
1.75 |
0.03 |
High |
|
Nitrite (NO2) |
37 |
33 |
19 |
High |
|
|
Nitrate (NO3) |
560 |
490 |
180 |
0.3 |
High |
|
Kjeldahl Nitrogen |
- |
- |
- |
||
|
Total Solids |
- |
- |
- |
||
|
Total Dissolved Solids |
1840 |
1840 |
1830 |
400 |
High |
|
Total suspended solids |
80 |
34 |
14 |
High |
|
|
Oil and grease |
Nil |
Nil |
Nil |
| TABLE 5: RESULTS OF THE BIOLOGICAL EXAMINATION |
|
Date & time of Collection |
Residual Chlorine mg/L |
Particulars of samples |
Coliform Organism MPN/100 ml |
E. Coli MPN/100 ml. |
|
1.5.00 (morning) |
Nil |
Brahmapuri nala |
2400000 |
2400000 |
|
(morning) |
Nagtalai nala just before out fall in lake |
2400000 |
2400000 |
|
|
(morning) |
Nala from Amber side just before out fall into lake |
2400000 |
2400000 |
|
|
(morning) |
Mansagar lake from southern edge |
2400000 |
2400000 |
|
|
(morning) |
Mansagar lake from centre of water bridges |
2400000 |
2400000 |
|
|
14.5.00 (evening) |
Brahmapuri nala |
2400000 |
43 |
|
|
(evening) |
Nagtalai nala |
2400000 |
23 |
|
|
(evening) |
Nil |
Sample from eastern edge of the lake |
3900 |
23 |
|
(evening) |
Tube well near southern side |
488800 |
11000 |
|
|
(evening) |
Mansagar lake, southern edge |
4600 |
| TABLE 6: CHEMICAL ANALYSIS OF SOIL/SILT FROM THE LAKE (ppm) |
|
|
Sl. No |
Cu |
Pb |
Zn |
Cd |
Fe% |
Cr |
MA |
pH |
P |
K |
NO3 |
B |
|
1 |
15 |
<20 |
40 |
ND |
1.13 |
25 |
325 |
7.93 |
<50 |
45 |
50 |
<20 |
|
2 |
15 |
<20 |
40 |
ND |
1.53 |
30 |
400 |
7.80 |
<50 |
73 |
70 |
<20 |
|
3 |
20 |
<20 |
40 |
ND |
2.31 |
65 |
500 |
8.25 |
<50 |
40 |
50 |
<20 |
|
4 |
05 |
<20 |
25 |
ND |
1.11 |
20 |
275 |
7.47 |
<50 |
45 |
50 |
<20 |
|
5 |
30 |
20 |
70 |
ND |
1.04 |
40 |
300 |
7.21 |
<50 |
40 |
60 |
<20 |
| TABLE 7: TEST BORE RESULTS (DEPTH IN METRES BELOW SURFACE) |
|
|
Item |
Location 1 |
Location 2 |
Location 3 |
|
Eroded silt and settled matter |
0-3.66 |
0-2.4 |
0-3.0 |
|
Black fine sand |
3.66-5.0 |
2.4-10.36 |
3.0-7.0 m |
|
Kankar |
5.0 |
10.36 |
7.0 |
| TABLE 8: HYDROLOGICAL MODEL PERFORMANCE FOR AVERAGE MONSOON YEAR (1998/RAINFALL-631.5 MM) (RESOURCE AVAILABILITY 1.0 MCM/MONTHLY IN 2003) |
|
|
Results in subsequent year pre monsoon period |
|||||||||||||
|
Month |
July |
Aug. |
Sept. |
Oct. |
Nov. |
Dec. |
Jan. |
Feb. |
Mar. |
Apr. |
May |
June |
Total |
|
No. of Days |
31 |
31 |
30 |
31 |
30 |
31 |
31 |
29 |
31 |
30 |
31 |
30 |
|
|
Monthly Rainfall (mm) Based on 1984 data |
278.7 |
68.5 |
150.5 |
32.1 |
14.2 |
0 |
2.2 |
2.3 |
9.1 |
0.5 |
0 |
73.4 |
631.5 |
|
Surface Area (sq. km) |
1.11 |
1.11 |
1.11 |
1.11 |
1.11 |
1.11 |
1.11 |
1.11 |
1.11 |
1.11 |
1.11 |
1.11 |
|
|
Initial Balance start of month (MCM) |
1.14 |
1.88 |
2.04 |
2.42 |
2.42 |
2.42 |
2.42 |
2.40 |
2.36 |
2.22 |
2.03 |
1.80 |
|
|
Evapo-ration Rate (MCM/Day) |
0.007 |
0.006 |
0.005 |
0.005 |
0.004 |
0.003 |
0.003 |
0.004 |
0.007 |
0.011 |
0.012 |
0.01 |
|
|
Evaporation Loss (MCM) |
0.24 |
0.21 |
0.17 |
0.17 |
0.13 |
0.10 |
0.10 |
0.13 |
0.24 |
0.37 |
0.41 |
0.33 |
2.61 |
|
Percolation Rate (MCM/ Day) |
0.0036 |
0.0036 |
0.0036 |
0.0036 |
0.0036 |
0.0036 |
0.0036 |
0.0036 |
0.0036 |
0.0036 |
0.0036 |
0.0036 |
|
|
Percolation Loss (MCM) |
0.12 |
0.12 |
0.12 |
0.12 |
0.12 |
0.12 |
0.12 |
0.12 |
0.12 |
0.12 |
0.12 |
0.12 |
1.46 |
|
Non Urban Catch-ment Area (Sq.m) |
4731000 |
4731000 |
4731000 |
4731000 |
4731000 |
4731000 |
4731000 |
4731000 |
4731000 |
4731000 |
4731000 |
4731000 |
|
|
Urban Catchment Area (Sq.m) |
9390700 |
9390700 |
9390700 |
9390700 |
9390700 |
9390700 |
9390700 |
9390700 |
9390700 |
9390700 |
9390700 |
9390700 |
|
|
Runoff% |
25 |
25 |
25 |
20 |
20 |
20 |
20 |
20 |
20 |
20 |
20 |
20 |
|
|
Runoff (Non Urban Catchment)+(25% runoff from Urban Catchment) (MCM) |
0.49 |
0.12 |
0.27 |
0.05 |
0.02 |
0.00 |
0.00 |
0.00 |
0.01 |
0.00 |
0.00 |
0.10 |
1.07 |
|
Direct Rain Inflow (MCM) |
0.31 |
0.08 |
0.17 |
0.04 |
0.02 |
0.00 |
0.00 |
0.00 |
0.01 |
0.00 |
0.00 |
0.08 |
0.70 |
|
Spill-over (MCM) |
0.00 |
0.00 |
0.00 |
0.00 |
0.00 |
0.00 |
0.00 |
0.00 |
0.00 |
0.00 |
0.00 |
0.00 |
|
|
Balance (MCM) |
1.58 |
1.74 |
2.19 |
2.21 |
2.20 |
2.19 |
2.20 |
2.16 |
2.02 |
1.73 |
1.50 |
1.53 |
|
|
Monthly Intake of Treated Effluent (MCM) |
0.30 |
0.30 |
0.23 |
0.30 |
0.20 |
0.20 |
0.20 |
0.20 |
0.20 |
0.30 |
0.30 |
0.30 |
3.03 |
|
Net Balance after Replenishment (MCM) |
1.88 |
2.04 |
2.42 |
2.42 |
2.42 |
2.42 |
2.40 |
2.36 |
2.22 |
2.03 |
1.80 |
1.83 |
|
|
Average Depth of Lake (m) |
1.69 |
1.84 |
2.18 |
2.18 |
2.18 |
2.18 |
2.16 |
2.13 |
2.00 |
1.83 |
1.62 |
1.65 |
|
| TABLE 9: WATER QUALITY PARAMETERS |
|
|
Parameter |
Significance |
Level |
|
Dissolved Oxygen (DO) |
General indicator of water quality; source of O2 for respiration |
Minimum acceptable level, 2.5 mg/L; 10-15mg/L for reproduction of desirable fish |
|
Total Suspended Solids (TSS) |
Clog fish grills, bury eggs, reduce light penetration, increases heat absorption |
Dependent on location |
|
Total Dissolved Solids (TDS) |
Represents total mineral content which may or may not be toxic |
A maximum of 400 mg/L for diverse fish population |
|
BOD |
Amount of dissolved oxygen removed during decomposition of organic matter in a given time; a general indicator of contamination due to biodegradable organic matter |
BOD Water Status 1 mg/L - Very clean 2 mg/L – Clean 3 mg/L - Fairly clean 5 mg/L – Doubtful 10 mg/L – Contaminated |
|
COD |
Indicates the concentration of materials oxidisable by chemical reaction |
0.5 mg/L indicates very clean streams |
|
Ph |
Indicates the addition of acids or bases |
pH depends on actual system |
|
Nitrate |
A major plant nutrient; in high-concentrations, it can promote excessive plant growth; major sources and fertilisers, sludge and sewage. |
A maximum of 0.3 mg/L to prevent excessive fertilisation of streams |
|
Phosphate |
A major plant nutrient; major sources are detergents, fertiliser, sewage |
A maximum of 0.03 mg/L total inorganic phosphate is a common criterion |
| Address: |
|

|
|
|