
|

|

|

MODELLING OF A COASTAL WETLAND FOR RESTORATION PLANNING - T. Krámer1 , J. Józsa1 and J. Sarkkula2


|

|

|


 ABSTRACT
 INTRODUCTION
 WATER LEVEL MEASUREMENTS
 SURVEYING AND DIGITAL TERRAIN MODEL
 HYDRODYNAMIC MODEL
 LONG-TERM WATER BALANCE MODEL
 MODEL CALIBRATION:-CALIBRATION OF THE HYDRODYNAMIC MODEL
 CALIBRATION OF THE WATER BALANCE MODEL
 RESTORATION ALTERNATIVES
 EVALUATION OF THE DYNAMIC BEHAVIOUR
 EVALUATION OF THE LONG-TERM BEHAVIOUR
 CONCLUSION
 REFERENCES
| ABSTRACT: |


|
The paper deals with a 100 ha wetland in an estuary of the capital area of Finland. The area has gone through major changes in the last decades due to land based and river borne nutrient loads, resulting in unfavourable living conditions for aquatic birds. In order to restore the overgrown areas, opening inner ponds and brook channels by dredging is planned, in combination with dam construction. In order to reach the desired ecological objectives a survey of geological, hydrological and hydrodynamic conditions in the wetland has been made, to provide the basis for the planned measures. Numerical models were used to assess the impacts of the dredging work on water exchange and level in the wetland. The hydrodynamic model calculates the wetting and drying as well as water exchange due to the sea level variations. A simplified water balance model estimates the long-term impacts of rainfall-runoff, evapotranspiration and infiltration. The paper presents results of the planning scenarios, where alternative pond and brook channels have been designed and controlled by dams with various crest heights.
| INTRODUCTION: |


|
Vegetation covered coastal areas offer excellent conditions for aquatic birds and, consequently, their protection and restoration has become an important environmental issue. The Bay of Viikki-Vanhankaupunginlahti (Figure 1) is a most valuable bird habitat of that kind in Helsinki (Józsa, et al 2000). Its wetland ecosystem has gone through big changes in the last decades, due to land rise and eutrophication process caused by land and river borne nutrient loads. Water protection measures made in the last years have improved the water quality of the Bay and the state of its bottom (Mikkola-Roos & Oesch, 1998). The improvement of the water quality has not, however, restored the area to a condition optimal for a bird habitat. In fact, the overgrowing of the open water ponds and brook channels has significantly disrupted the living conditions of aquatic birds.
One of the most effective measures to restore the overgrown areas is the removal of vegetation by dredging. It is also important to change the hydrodynamic conditions in order to be able to control and sustain the desired water levels, water exchange and ecological conditions. However, prior to the planning and implementation of restoration measures it is necessary to explore the main hydrodynamic features by hydrodynamic measurements and mathematical models. The plans consist of various schemes of opening the ponds and channels by dredging, in combination with dam construction. The calibrated mathematical models can be used to evaluate the hydrodynamic and hydrological conditions for the various schemes to find favourable restoration measures.
| WATER LEVEL MEASUREMENTS: |


|
Three high-resolution water level recorders (Telog) were deployed in the open water ponds (Pond 1, 2, 3, as indicated in Figure 2) for more than three months, between Jul. 7 - Oct. 15, 1999. The sea level data was furnished by the Finnish Institute of Marine Research (FIMR) from the permanent gauging station in Helsinki. This 100-day period was characterised by small storms in July and August, low waters and dry weather in September and a rainy October accompanied by high waters having one peak at 30 cm and later two peaks at 50 cm. The water level time series in the ponds show a clear daily periodicity of 1-2 cm. It may be due partly to the strong daytime evapotranspiration of such a coastal wetland, which was then recharged by the subsurface waters nighttime (Baird & Wilby, 1999).
| SURVEYING AND DIGITAL TERRAIN MODEL: |


|
Surveying was carried out in November 1998 and additional measurements were made on the ice-covered ponds (Toivonen, T, 1999). Altogether, 134 points were measured in 9 cross sections at an average distance
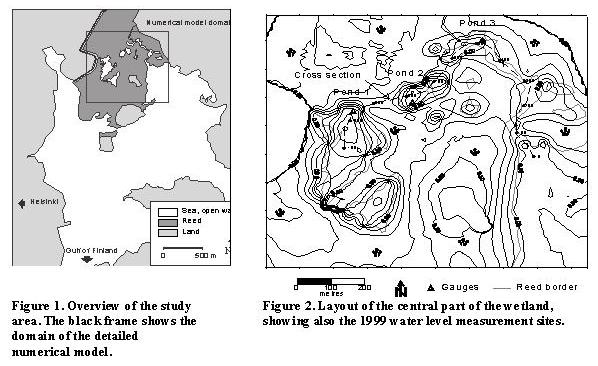
of 50 m. Core samples were taken at all points in order to map the soil structure in the upper 1 m layer. Digital terrain models with 10 m as finest grid resolution were produced using the survey data. As can be seen in Figure 2, the reed covered zones lie 10-50 cm above the 0 sea level. The open water ponds are in the depressions with bottom level of -10 to -45 cm.
The cross section in Figure 3 follows the lowest path from the bay to the innermost parts. The height of the natural crests between the ponds is also displayed.
| HYDRODYNAMIC MODEL |


|
Due to the shallowness, a general-purpose two-dimensional unsteady flow model is used (Krámer & Józsa, 1999, 2000). It describes the flow by the horizontal, depth-integrated velocities:


where z0 is the bottom elevation, h is the depth, u and v are the horizontal velocity components in a Cartesian system.
The governing shallow water equations describing the conservation of volume and momentum consist of the continuity equation:

and two momentum equations. Neglecting advective acceleration and wind drag, this yields the following equation in the x and y direction:

where g is the gravitational acceleration, ne is the eddy viscosity, r is the density of the water. The bottom friction is approximated by the following conventional quadratic formulae:

where k is the Manning-Strickler bottom smoothness.
The governing equations are approximated using the method of finite differences, for which the flow variables and the topography are discretised on a two dimensional, horizontal Cartesian grid. Time marching is handled with explicit Euler time integration.
Since cells being flooded or dried during the calculation tend to introduce numerical instabilities in the solution, the model is equipped with a robust flooding and drying technique which explicitly modifies water exchange between cells in very shallow regions. The implemented scheme gives a good estimation of the flood wave propagation and water storage and ensures overall mass conservation. The key of the technique is that numerically a cell is considered dry if the depth there is below a prescribed critical value (2 cm).
Using the shallow water equations to determine the flow above the planned dam would yield unrealistic discharges, especially by free overtopping, since it uses the surface gradient between the upstream and downstream nodes. Instead, a special internal boundary condition is applied. In case of free overflow, the discharge is determined using an appropriate weir formula. If the dam is submerged the model gradually switches from the weir formula to the shallow water equations.
Different constant bottom smoothness was assigned to reed (kreed) and to open waters (kwater). Canals narrower than the grid resolution were indirectly represented in the model. To obtain realistic conveyance and water level, an equivalent hydraulic resistance could be found based on numerical experiments
| LONG-TERM WATER BALANCE MODEL |


|
A different model was used for assessing the long-term water balance of the Viikki wetland.
As opposed to the hydrodynamic model, the long-term model contains a simplified method to describe the flooding and drying. The sea level is prescribed at the open boundaries and water intrudes all the cells that lie below the sea level and are hydraulically connected to these boundaries. The resulting water surface is always horizontal. Though much faster to calculate, this approach does not account for the propagation speed of the flood wave.
Precipitation is distributed in the modelled area of the wetland using the topography; in such a way that overland flow follows the steepest path until it reaches the closest flooded area. The water level of the recipient rises according to the volume of runoff. Reducing the precipitation by a runoff coefficient represents the loss by interception and infiltration.
The catchment area of the Viikki wetland is 2.4 km2; half of which covers a built-up area. The only effluent enters on the northern side of the wetland. The discharge is calculated using the precipitation intensity, with a delay of approximately 12 hours.
Evaporation in the open waters and evapotranspiration in the reed contributes to the drying of the wetland. The loss of water is most important in the summer while it is greatly reduced late autumn. Representative figures could be estimated using the average monthly evaporation of similar wetlands in the proximity of the study area. The evaporation from lakes in these drainage basins is 615 mm/year, the possible maximum being 10 mm/day. The present study did not attempt to model the groundwater flow and the exchange with the surface waters through seepage. Instead, loss by evaporation, evapotranspiration and infiltration are treated collectively.
|
MODEL CALIBRATION: CALIBRATION OF THE HYDRODYNAMIC MODEL |


|
The hydrodynamic model was calibrated by tuning the topography as well as the reed smoothness coefficient. A two-day long period was chosen from the 1999 measurements. This period was suitable for calibration because the sea exceeded only for a short time and by little amount the level at which it overtops the saddle point between the adjacent the inner depressions. In fact, with higher sea, all the wetland is flooded and behaves practically as a single water body, giving no room for parameter calibration.
The elevation of the saddles separating the ponds greatly affects the water exchange, especially during periods when the sea level falls into the same range. By tracking the water levels at which flooding and drying of the ponds occurs, the elevation of the crests separating the ponds could be estimated and the terrain model was improved accordingly. The selected storm surge is fortunately not accompanied by rainfall, as is usually the case during the rest of the measurement campaign. Indeed, during other storm surges, it is generally problematic to separate rainfall and inundation as the source of the water level rise. Based on experience in earlier simulations, bottom smoothness in open waters was taken as kwater = 40 m1/3/s. The reed smoothness was obtained by calibration, with the aim to reproduce the right phase, amplitude and damping. The overall best fitting (Figure 4) was obtained with kreed = 6 m1/3/s, which is close to the value found by laboratory flume experiments. At the beginning of the simulation, Ponds 1, 2, 3 were filled to -10, -5, 10 cm respectively.
| CALIBRATION OF THE WATER BALANCE MODEL |


|
The long-term model was calibrated using the period of the field measurements with low sea levels (Jul-Sep 1999). The time step was 12 hours. The initial water levels in the three ponds were set to the observed ones. Unfortunately, water went below two out of the three gauges for most of the time, they missed therefore all the relevant low-water episodes. Because of this lack of information, calibration was essentially based on the measurements of the only valid gauge (Pond 1). Figure 5 compares the measured and calculated water levels at this gauge and also shows the time series of the sea level and precipitation.
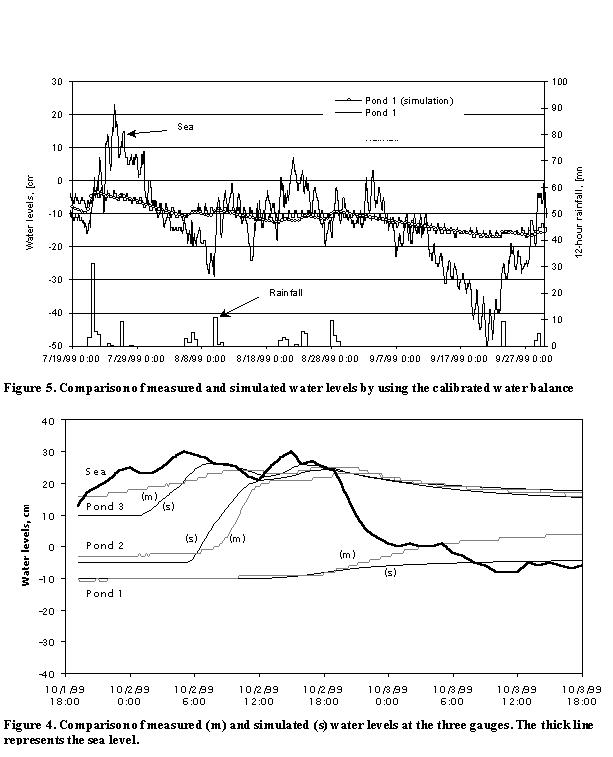
The rate of evaporation is estimated by the gradient of the water level during intervals with no rainfall. The runoff coefficient was obtained in a similar way, the value of a = 0.2 gives results in good agreement with the observations.
The catchment runoff can be estimated from the water levels in the pond closest to the inflow (Pond 3). The magnitude of the discharge cannot be deduced, because all the flood waves are trimmed at the level at which excess water overtops the barrier and leaves to the sea. This pond exhibited rapid decrease in water level following the peaks, which could be fairly well reproduced with an infiltration proportional to the water level difference between Pond 3 and the sea.
During high-sea periods, the sea inundates most of the wetland. In the water balance model the filling up of the area is described by adopting horizontal water surface for simplicity and fast calculation.
| RESTORATION ALTERNATIVES: |


|
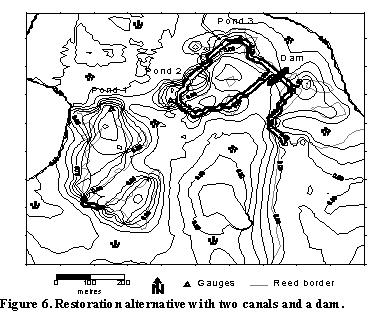
The relevant restoration alternatives included in the modelling approach were fixed together with the experts responsible for the restoration planning. In order to retain water in the wetland, a fixed dam was proposed in a narrow place close to the sea. In addition to the dam, one 5 m wide, 50 cm deep canal would be dredged, connecting Pond 3, the dam and the sea. The construction of a 10 m wide canal (instead of 5 m) was also investigated. As a different alternative, a 50 cm deep U-shaped canal would be also dredged, improving the water conveyance between Pond 2, Pond 3 and the dam (Figure 6). The two canals would effectively enclose a reed "island", thus create a favourable environment for birds.
| EVALUATION OF THE DYNAMIC BEHAVIOUR |


|
The effect of the interventions on the dynamic behaviour of the system was investigated with the hydrodynamic model. Simulations were run for the same storm surge as was used during the calibration (Oct. 1 - Oct. 3). The flooding and drying of the wetland was assessed using the maps of flood arrival time and highest inundation level. These aspects are vital for the ecosystem; they also help to investigate the spatial and temporal behaviour of the flood. The maps are presented for the original state and the restoration alternative with two canals and the dam crest at 17 cm.
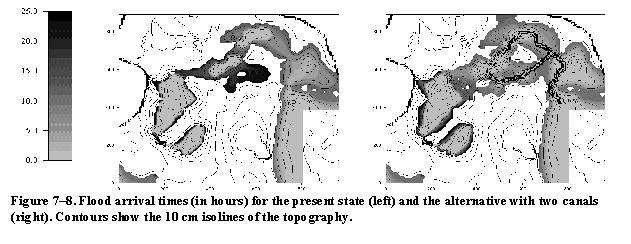
With the help of the flood arrival time map, the penetration of the sea surge can be tracked and the zones that are inundated last are easily identified (Figure 7-8). Arrival time for the initially wet cells is obviously zero. The propagation is substantially enhanced. The role of the canal between the sea and the dam is in conveying the seawater more rapidly to the dam section, especially in case of small surges. The horizontal extent of the flooded regions has increased, too.
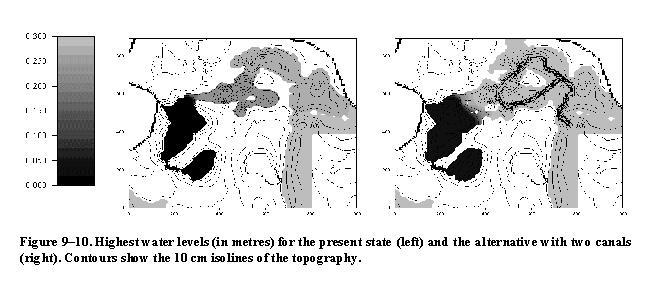
In Figure 9-10, the highest water levels during the simulation are shown. Due to the dynamic behaviour of the sea level, the ponds could not be filled up to a uniform level. The construction of connecting canals increases the filling-up of the hydraulically "farther" ponds and the highest inundation level increased considerably within the system. The flood wave is much less attenuated when propagating along the canals. In both cases, the highest levels fall suddenly where the hydraulic resistance of the reed imposes a high gradient.
The volume of water retained behind the dam at the end of the storm surge is a good measure for the effectiveness of the various crest level-canal layout combinations (Figure 11). In order to have a reasonable comparison, the volume of the dredged canals was subtracted. Even without this volume, the alternative with two canals retains more water from the investigated sea storm surge, because it makes the middle ponds accessible also for lower water levels by cutting through the natural ridge. On the whole, increasing the dam crest height is beneficial. However, a higher dam not only retains more water but may also block
the way to smaller scale floods.

| EVALUATION OF THE LONG-TERM BEHAVIOUR |


|
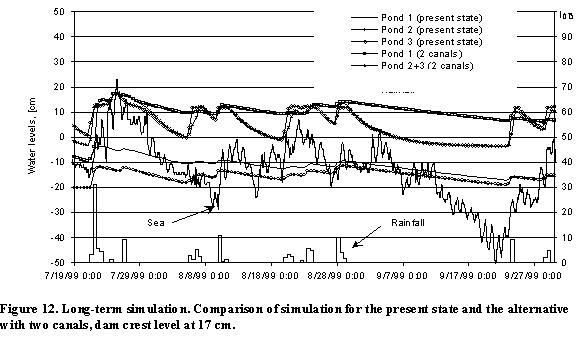
Again, the long-term behaviour is compared here between the present state and the variant with two canals and the dam crest at 17 cm. For this low-sea period, the water level measurements in the ponds were incomplete. For that reason, the present state is represented with the calibrated model results rather than with the measurements (Figure 12). The dam does not let the water from the influent leave to the sea without inundating the inner areas. The inflow from the catchment is not sufficient to fill the wetland up to the crest level. The ponds connected via the dredged canal behave identically. The drawback of this increased connection is that the high infiltration near the dam drains more water from these ponds, whereas the remote parts loose water solely at the "global" rate of evaporation-evapotranspiration-infiltration. Another disadvantage is that the volume to be filled increases by dredging the second canal, hindering the rise of the water levels.
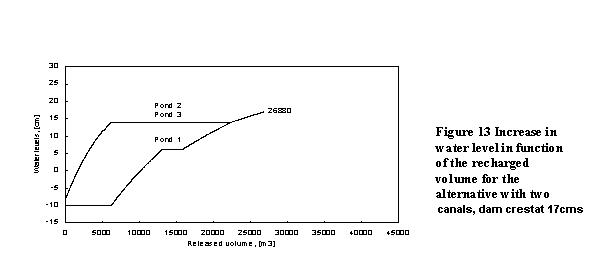
To investigate the effect of an artificial freshwater recharge to the wetland, it is important to determine the volume of water necessary to reach a desired water level in the ponds. Here a recharge to Pond 3 is examined. Initially, water levels are set to -10 cm in all ponds. Then water is supplied to the wetland and the evolution of water levels in the three ponds is followed for the variant with two canals (Figure 13). This analysis shows that the minimal volume of water that needs to be recharged to reach the crest level of the dam is 27000 m3. Further recharging would then overtop and leave to the sea.
| CONCLUSION: |


|
| REFERENCES |


|
| Address: |


|
1. Budapest University of Technology and Economics,
Müegyetem rkp 3.,
Kmf. 8.,
H-1111 Budapest,
Hungary
2. Finnish Environment Institute,
Käsekatu 6,
FIN-00260 Helsinki,
Finland

|

|