1 Centre for Sustainable Technologies,
2 Centre for infrastructure, Sustainable Transportation and Urban Planning, 3 Centre for Contemporary Studies,
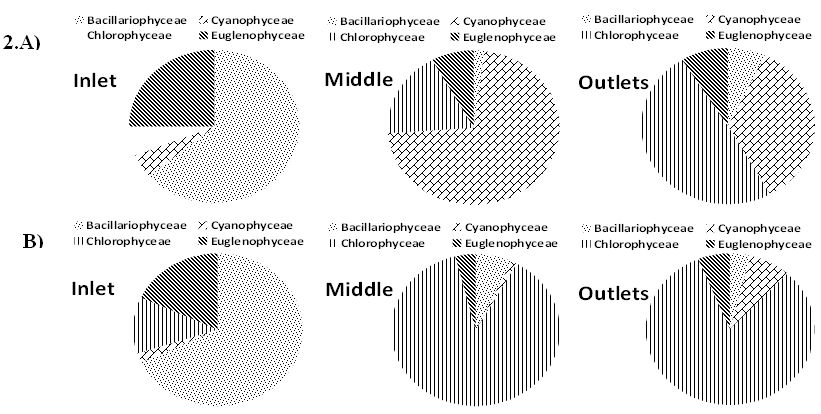
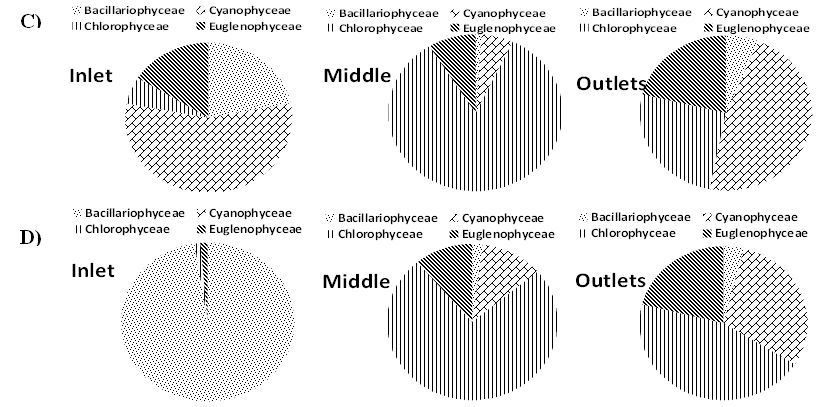
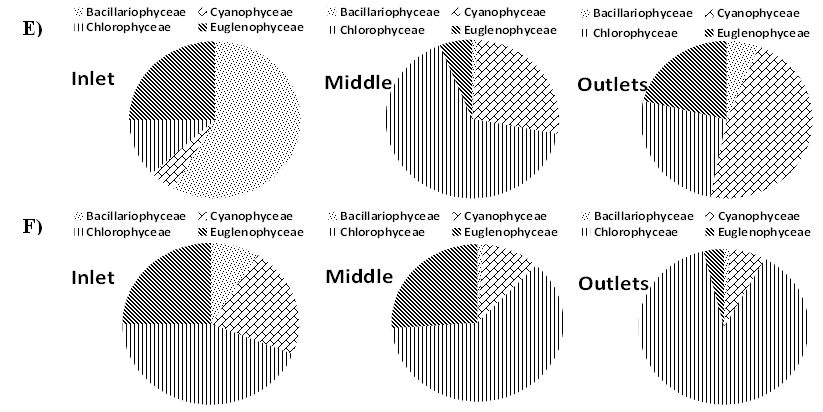
4 Energy and Wetlands Research Group, Centre for Ecological Sciences, Indian Institute of Science, Bangalore 560 012, India E-mail: durgamadhab@ces.iisc.ac.in, chanakya@cst.iisc.ac.in, cestvr@ces.iisc.ac.in Results and Discussions Phytoplankton abundance, species composition and turn over Algal abundance and distribution Algae play a vital role in oxygenating the system that helps lower BOD and oxidizes many substrates. In Bellandur lake during the pre-monsoon period the regions around the inlets were dominated by the members of bacillariophyceae (70 %; Gomphonema parvalum). These species are tolerant to organic pollution which can reside in strictly anaerobic conditions. In the middle reaches the cyanophycean members like Microcystis sp. dominated (71 %) and the outlets were dominated by the members of chlorophyceae such as Chlorella sp. and Chlorogonium sp. During the monsoon, the chlorophycean members dominated, however, the post monsoon period saw abundance in the cyanophycean members. The algae in the biofilms collected from the rock surface, plant surface and sediment layers showed greater proportion of filamentous algae (Oedogonium sp.) and diatom sp. (Gomphonema sp.and Navicula sp.). The distribution of the different members of phytoplankton at various sampling locations and seasons are depicted in Figure 3.1. In case of Varthur Lake during summer Scenedesmus sp., Anabaena sp. and Anaycstis sp. were dominant while enormous Chlorella sp. (<10 μm) were observed during the monsoon season (80 %). Micro-algal sampling studies also revealed a greater dominance of diatoms especially Gomphonema sp. (10-18 μm) near the inlet reaches during the monsoon taken over by the euglenophycean members like Euglena sp. and Trichellomonas sp. (>20 μm) in the pre monsoon period. The predominance of euglenoides are indicators of excess accumulation of organic matter. In the post monsoon period the algal bloom of the Bellandur, that is situated at the upper reaches of the Varthur lake, brings in a higher quantity of chlorophycean members which act as inoculant for Varthur lake. Filamentous alga like Oedogonium sp. and Oscillatoria sp. (>30μm) dominated in the monsoon and were observed to a large extent near the outlets of the Varthur lake. Comparative analysis of algal populations in the biofilms showed a marked difference in the community structures at various zones of the lake. The rock biofilm consisted of colonies of Stigeoclonium sp. Diatom species such as Gomphonema sp. and Nitszchia sp. were at the inlet and chlorophytes and euglenoides were observed at the outlets. This distribution shed light on our existing understanding of the dependence of the algal assemblage on the environmental variables. Further field investigations revealed that depending upon the wind direction and the extent of growth and movement of the macrophytes together with the nutrient influx, there is periodic transition from an anaerobic-aerobic (in monsoon) to anaerobic (in summer) and aerobic-anaerobic system (winter/pre monsoon). The algal communities identified upto the genus levels (four families) are depicted in Table 2. Table 2. Algae communities (identified up to genus level) in the lakes.
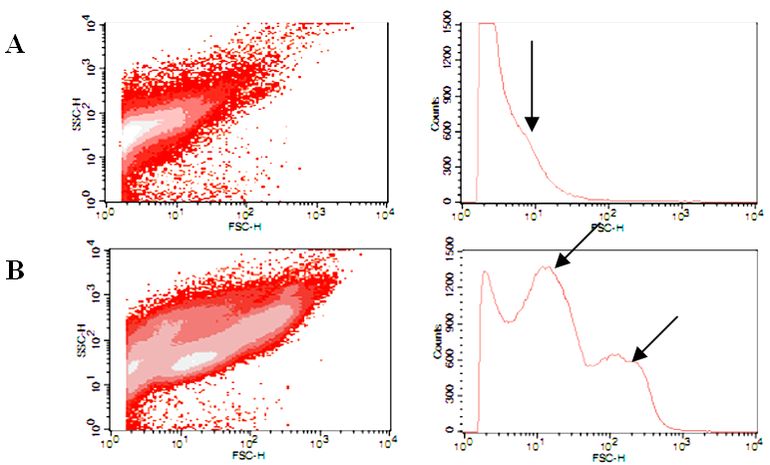
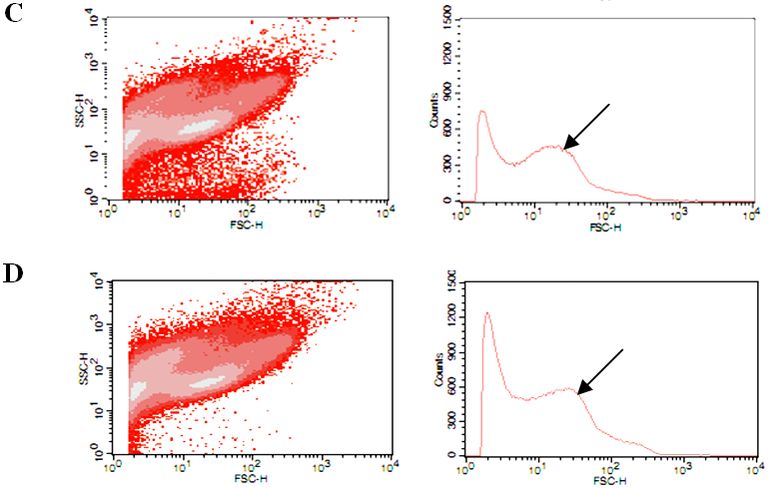
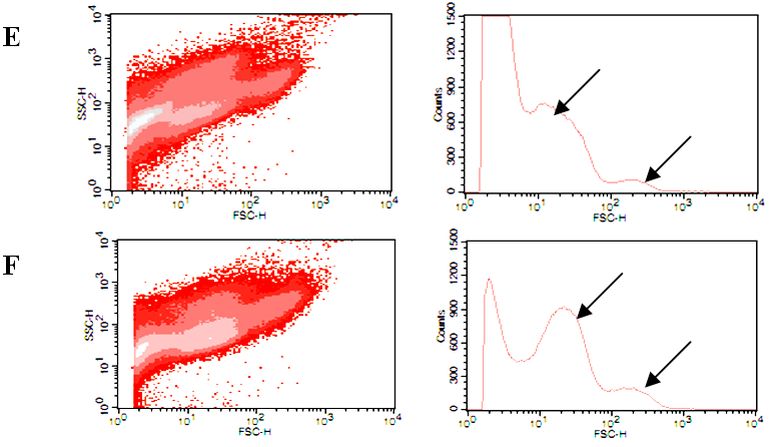
In case of algal cells, the inlet regions of Bellandur were consistently showing very low count of the order of 102 cells/ml. However, the average cell count in case of middle portion of the lake was 106 cells/ml. At the outlets the cell counts decreased to the order of 105 cells/ml. In Varthur lake the number of algal cells were less during the monsoon 103 cells/ml but during the other periods, the cell count was of the order of 105 cells/ml. At the middle reaches and the outlets the algal cell count was of the order of 106 cells/ml. Bactrioplankton abundance and distribution Three different types of bacteria identified under the microscope were coccoid, rod-shaped, and curved bacteria (Figure 4). In flow cytometric analysis, through normal laser encounter, these three clusters of bacteria were distinguished (Figure 3). In case of Bellandur lake samples, the samples from the inlet regions (Figure 3 A) had less cell density (108 cells/ml). However for the middle zone, three different peaks were observed (Figure 3 B). This is an indicator of the filamentous bacteria being a resident near of the facultative zone. In case of the outlet samples one particular type of bacteria i.e. bacillus (Figure 3 C) were observed.
Varthur lake showed a higher bacterial abundance towards the inlets mostly comprised of cocci forms (shown as singe peak Figure 3 D; Table 3; Figure 4. A). The middle regions comprised of two different groups of bacteria’s the coccus and the spirillum (Figure 3 E; Table 3; Figure 4. B) evident from the two peaks indicated by the arrows (Figure 3 E). The outlets essentially comprised of rod shaped bacteria shown by one prominent peak given in Figure 3 F and Figure 4. C.
Table 3. The bacterial cell count-Flow cytometer
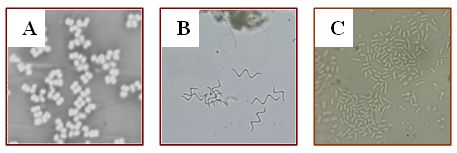
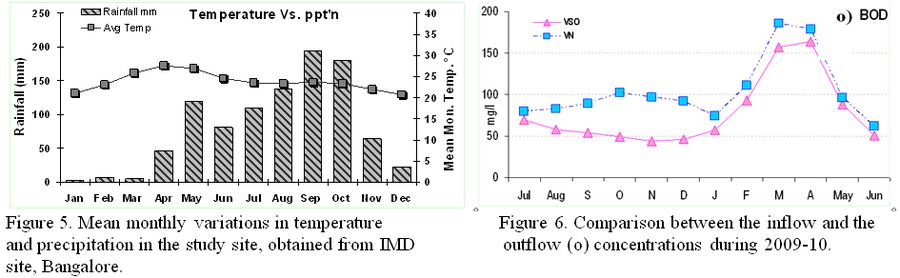
Climatic and physico-chemical variables in water quality Climatic conditions are important and very specific to places. The average annual rainfall of the study area is 859 mm and temperatures vary from 14°C (December to January) to 33°C (Maximum during March to May) as shown in figure 5. There are two rainy periods, from June to September (South-West Monsoon) and November to December (North-East Monsoon). During the rainy periods, fresh water also enters the lake as runoff. Temperature, pH, and DO profiles (Table 4) suggest that both the lakes are incompletely mixed with variable stagnation zones during the year. Water transparency oscillated in very small amplitude (8 cm–30 cm) during the steady period.
The physico-chemical analysis of the lake water shows that higher treatment occurred in Bellandur lake during the monsoon and the post monsoon season, with COD and BOD removal efficiencies of about 70% (filterable) and >50% total COD as illustrated in Table 4. However in case of Varthur lake the COD and BOD removal >50 (filterable) and BOD 38-43 % during the monsoon and post-monsoon period (Table 4 and Figure 6.). This suggests that the two lakes have different dynamics. The ORP values (-245 to -140 mV) indicate anoxic-oxic conditions (Table 4). Where there were higher ORP values, the COD and BOD values were considerably higher indicating higher organic matter decomposition. Table 4. Physico-chemical characteristics of Bellandur and Varthur lake at inflow and outflow in different seasons
Nutrient status in the lake In Bellandur and Varthur lakes it was observed that the predominant form of inorganic N present in the dissolved form is ammonia at inlets 37 ppm and 34 ppm respectively. N was found to be the limiting nutrient for the algal bloom. Nitrate and Nitrite concentration constituted an insignificant portion of the dissolved nitrogen pool (2.0%). The nitrate values were near about 1.5 mg/l with very low variations (Table 4). The higher ammonia values were well correlated with the ORP (-250 mV) values which shows the redox status of the lake and thus the prevailing anaerobic conditions. In Varthur lake the ammonia concentrations showed a clear cut gradation from the inflows to the outfalls. The ammonia concentrations were ~35 mg/l near the inlets, 23 mg/l at middle and were ~15 mg/l near the outfalls attributed to progressive N uptake by the microflora with an AmmN removal efficiency of 57 %. Total N content at inlets and outlets were observed to be 55 mg/l and 28 mg/l respectively showing a TN removal efficiency of 50%. Total N influx into Varthur was measured to be 32 tN/day. A significant portion (45%) of it is lost to the environment by denitrification and volatilization processes. However in case of Bellandur the ammonia values were high at inlets as well as outlets. Similar findings were made earlier with NH3N=31 mg/l (Chanakya et al. 2006; Chanakya and Sharatchandra, 2008). The Total phosphates values ranged from 7.86 to 9.87 mg/l. The orthophosphates concentrations in Bellandur varied from 1.7 mg/l to 3.84 mg/l from inlets to outlets. However in case of Varthur the orthophosphates concentration varies from 1.2 mg/l to 4.3 mg/l from inlets to outlets. The phosphates values at the outlets are higher then the inlet and may be attributable to additional in-flux of sewage from non-point and non-inlet sources. Nutrient content in biomass In case of wastewater bacteria, the average bio-volume was calculated to be 0.52 μm3. The average N value for the bacterial cells was found to be 0.5×10⁻¹¹ mg N/cell. Similar concentrations were found in earlier studies (Munch and Pollard, 1997). This accounts to a total bacterial N accumulation of 0.074 tN on a daily basis. On a dry wt, basis 420-480 mg of algae was recovered for a litre of lake water. The N content in the algae varied from 3.7-6.2 g/100 g dry wt (CHN Analysis). The average N content in algae was found to be 4.95 % which gives algal biomass concentration of 22.27 mgN/l. The alga in the lake accumulates 3.302 tN on a daily basis. Among the macrophytes water hyacinth uptake bulk of these nutrients. The N content per unit area of the dry biomass for macrophytes accounts to 0.54 kg/m2. On a daily basis N accumulation by the macrophytes accounts to 2.44 t/d. The detailed study has been discussed by Mahapatra et al, 2010a. Among all these biotic components the algae plays the major role for nutrient accumulation. The macrophyte cover of the lake surface reduces sunlight for phytoplankton during the post monsoon period. The phytoplankton count greatly reduces along with reduced water purification. It has been concluded that without the macrophyte cover the COD/BOD reduction reaches above 50% (Mahapatra et al. 2010b). Citation: Durga Madhab Mahapatra, Chanakya H. N and T. V. Ramachandra, 2011, Water treatment potential in relation to phytoplankton dynamics in tropical sewage-fed urban water bodies. Proceedings of the Conference on Microbes in Wastewater and Waste Treatment, Bioremediation and Energy Production, January 24-27, 2011, Goa, India.
|
||||||||||||||||||||||||||||||||||||||||||||||||||||||||||||||||||||||||||||||||||||||||||||||||||||||||||||||||||||||||||||||||||||||||||||||||||||||||||||||||||||||||||||||||||||||||||||||||||||||||||||||||||||||||||||||||||||||||||||||||||||||||||||||||||||||||||||||||||||||||||||||||||||||||||||||||||||||||||||||||||||||||||||||||||||||||||||||||||||||||||||||||||||||||||||||||||||||||||||||||||||||||||||||||||||||||||||||||||||||||||||||||||||||||||||||||||||||||||||||||||||||||||||||||||||||||||||||||||||||||||||||||||||||||||||||||||||||||||||||||||||||||||||||||