 |
URBAN FOOTPRINT DYNAMICS IN INDIAN METROPOLIS |
 |
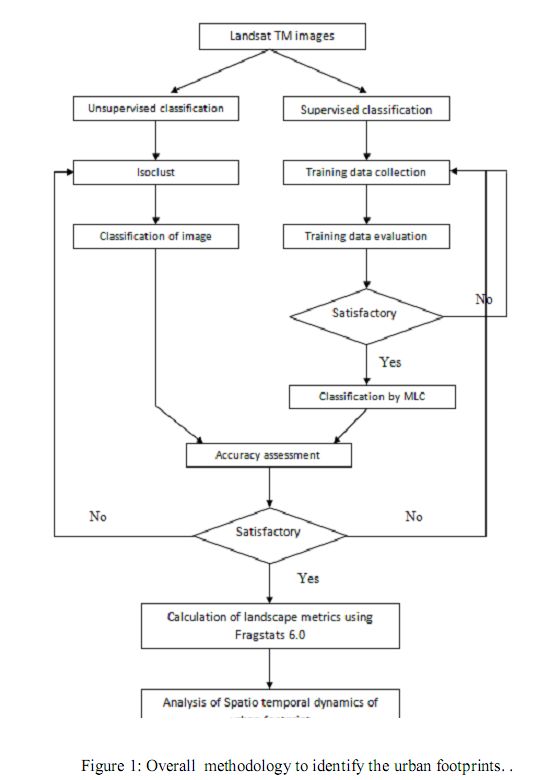
Method
Method adopted for analysis of urban dynamics is given in figure 1. The analyses involved:
- Image registration and geo-correction of the RS data of varying spatial and temporal
resolutions.
- Generation of false colour composite (FCC) using band 2 (Green), 3 (Red) and 4 (NIR) to
identify heterogeneous patches.
- Collection of training data from FCC and Google Earth images
(http://www.earth.google.com).
- Unsupervised classification of the RS data was done with the help of the number of distinct peaks
in the histogram.
- Land use supervised classification into 4 classes – built-up, water bodies, agriculture and
vegetation, and others (including all other categories) using Maximum Likelihood classifier using
IDRISI Andes (Eastman, 2006; http://www.clarklabs.org). Further, the classified images were recoded
to identify the expansion of built-up from 1990s to 2010.
- Accuracy assessment of the classified images using test data and Google Earth images.
- Computation of spatial metrices - A wide variety of indices developed to characterize landscapes
has often been applied to study spatial landscape patterns in the field of landscape ecology; they can be
categorized into: area/density/edge, shape, core area, isolation/proximity, contrast, contagion,
connectivity, and diversity metrics (McGarigal and Marks, 1994). But, only recently has landscape
metrics been used in the study of urban morphology (Seto and Fragkias, 2005). The proliferation of
landscape metrics, together with the use of remote sensing technology, provides a potential means for
analyzing the spatial patterns of urban evolution (Yu and Ng, 2007). Different metrics have been used
depending upon the land use and on considering the type of land use planning . Fragmentation analysis
is done as it portrays the breaking up of a cohesive habitat into smaller and more isolated parcels
(Forman, 1995). Various metrics computed are:
- Shannon's Diversity Index {Entropy} (SHDI) - Shannon’s diversity index is a popular
measure of diversity in community ecology, applied here to patches in the landscape. SHDI = 0
when the landscape contains only 1 patch (i.e., no diversity). SHDI increases as the number of
different patch types (i.e. patch richness) increases and/or the proportional distribution of area
among patch types becomes more equitable. Moreover, it is demonstrated that heterogeneity
(pattern) and entropy can be considered as equivalent terms. In the present study, entropy is used
as a measure of the fragmentation process, i.e. a measure of dispersion of built-up patches. Lower
the index indicates compactness of the patches, while higher the index (not greater than log (n))
indicates more dispersion of the patches.
- Patch Density :-This represents the number of patches corresponding to each class type for the
total landscape area. The patch density increases during the period of urban sprawling where urban
patches are dispersed and spread across, while the patch density decreases when the urban patch
reaches a stage of dense urban growth, and forms into one single urban patch.
- Perimeter area fractal dimension (PAFRAC) - This reflects shape complexity across a range
of spatial scales. PAFRAC approaches 1 for shapes with very simple perimeters such as squares,
and approaches 2 for shapes with highly convoluted, plane-filling perimeters.
- Clumpiness index (CLUMPY): This is computed such that it ranges from -1 when the patch type
is maximally disaggregated to 1 when the patch type is maximally clumped. It returns a value of
zero for a random distribution, regardless of Pi. Values less than zero indicate greater dispersion
(or disaggregation) than expected under a spatially random distribution, and values greater than
zero indicate greater contagion. Hence, this index provides a measure of class-specific contagion
that effectively isolates the configuration component from the area component and, as such,
provides an effective index of fragmentation of the focal class that is not confounded by changes
in class area.
The remote sensing data was obtained from the Global Land Cover Facility (GLCF –
http://www.landcover.org/), and from the U.S. Geological Survey (USGS) and NASA’s Landsat mission
website. Beginning October 2008, the archived data of the Landsat missions are made available freely by
USGS. Accordingly, the cloud free data corresponding to the years 1990s and 2010 were downloaded and
processed. The remote sensing data are processed to quantify the land cover of respective cities broadly into 4
classes – built-up, water bodies, agriculture and vegetation, and others (including all other categories). The
multi-spectral data of Landsat TM with a spatial resolution of 30 m each were analyzed using IDRISI Andes
(Eastman, 2006; http://www.clarklabs.org). The image analyses included image registration, rectification and
enhancement, false colour composite (FCC) generation, and classification. The False color composite of the
image are obtained by combining different band types depending upon the requirement, here bands 2, 3 and 4.
Subsequently, the classification of the multi-spectral remote sensing data is carried through a multi-stage
classification process: Unsupervised method and supervised method. In the supervised classification method the
signatures were derived from the training data obtained from Google earth. The signatures generated for each of
the land cover were verified with the composite image. Based on these signatures, corresponding to various land
features, supervised image classification was carried out using Gaussian Maximum Likelihood Classifier.
Citation : Priyadarshini J. Shetty, Shashikala. V and T. V. Ramachandra, 2010, Urban footprint dynamics in Indian metropolis. Proceedings of the Conference on Infrastructure, Sustainable Transportation and Urban Planning CiSTUP@CiSTUP 2010. 18th - 20th October 2010, CiSTUP, IISc, Bangalore.
|