|
Results and Discussion
Sacred groves of Western Ghats, in the past were in continuity with secondary forests in different stages of vegetation succession, often the results of regeneration on past shifting cultivation fallows (Gadgil and Chandran 1992). There has been, in recent past, rising awareness on the history and importance of sacred groves. As a positive outcome of the rising conservation ethos, a 1.8 ha grove were protected with fence involving local people in the Mattigar village of Siddapur amidst diverse landscape elements i.e. agricultural field, plantation and human habitations.
Comparative analysis of the two time scale data has shown that protection promoted the species richness, family richness, increment in basal area and overall percentage of endemics (Table 1) probably due to restriction in cattle grazing, resource extraction and entry by humans. Tree species richness is recorded to increase from 7.42 to 9.48. Of these, 81 percent are evergreen and 19 percent are deciduous. Among the new members the presence of endemics, Actinodaphne hookeri, Beilschmieda fagifolia, Diospyros assimilis, Garcinia indica and Drypetes confertiflorus are noteworthy. Girth class distribution at the two time scale do not show much difference except for the presence of high number of individuals in lower girth class category in 2009, showing greater recruitment of trees when protection was provided (Fig. 1). Basal area increased from 53.5 m2/ha to 63.7 m2/ha, mostly contributed by low girth class members (18.8 percent in 2009 in comparison to 10.3 percent in 1991) whereas middle and high girth class members remain stable. There is almost two time increment in stem density from 208.3/ha to 424.4/ha contributed by young individuals.
Table 1. Comparison of the vegetation profile (for tree species only) of Devaravattikan sacred grove in 1991 and 2009.
| Attributes |
1991 |
2009 |
Species richness
Shannon-Wiener Diversity Index
Simpson’s Dominance Index
Total individuals
Stem density (no. / ha)
Basal area (m2 / ha)
Average canopy height (mt)
Endemism (%)
Carbon value (tC / ha) |
7.42
3.18
0.0625
375
208.3
29.79
14.13
37.04
125.48 |
9.48
3.41
0.0484
774
424.4
35.23
13.39
45.21
148.73 |
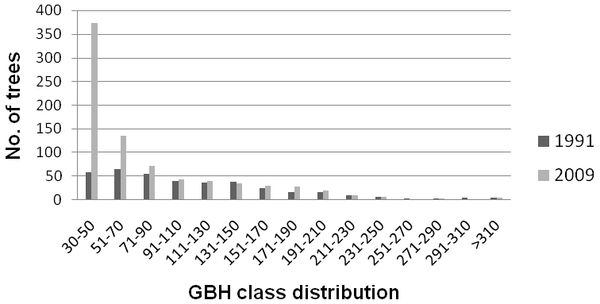
Fig.1. GBH class distribution in Devaravattikan in two time period (1991 and 2009)
Increment of endemism (37→ 45 percent) could be attributed to two possible factors. Perhaps seeds and seedlings of endemic members were present at earlier study period which in course of time grew uninterruptedly and became prominent elements at the time of present study. It is also possible that the seeds of these endemic species could have been brought in by birds and bats from the adjacent evergreen forest belt . Similarly, regeneration study shows better potential, especially for tree species. A good number of tree members are present in seedling and sapling forms among which Western Ghats endemics are prominent (~ 66 percent). The good canopy cover, availability of soil moisture and less disturbance may be the contributing factors for endemics survival. In the ground vegetation layer, forest species dominate over the open area species.
Percent contributions of evergreen and deciduous members and canopy height on an average remain same in study period. This could be due to the isolation of the grove and more of exposed edges and gaps. Fragmented nature also inhibits gain of the maximum potential height for many tree species as taller trees turn vulnerable to wind falls, thus, average canopy height could not improve in this time period; the “wind damage hypothesis” (D’Angelo et al.2004). The presence of secondary elements like Holigarna arnottiana, Aporusa lindlyana, Olea Dioica and Terminalia paniculata reflects the disturbances and exposure to relatively long rainless period of about six months. Family importance value index shows dominance of Myrtaceae, Anacardiaceae and Clusiaceae members (Table 2) and the 18 years time period also witnessed the entry of two families, viz., Lauraceae and Oleaceae into the first ten dominant families of the grove.
Table 2. Top ten families based on the Family Important Value (FIV) index in two time period
| 1991 Family (FIV) |
2009 Family (FIV) |
Myrtaceae (47.9)
Anacardiaceae (36)
Dipterocarpaceae (28.8)
Clusiaceae (27.5)
Sapotaceae (20.1)
Verbanaceae (13.6)
Euphorbiaceae (12)
Combretaceae (11.14)
Ebenaceae (11.1)
Melastomataceae (10) |
Myrtaceae (37.1)
Anacardiaceae (35)
Clusiaceae (25.8)
Lauraceae (23.4)
Dipterocarpaceae (19.1)
Euphorbiaceae (18.2)
Sapotaceae (15.3)
Oleaceae (12.1)
Verbanaceae (11.9)
Combretaceae (10.6) |
Carbon sequestration study showed promising results. Present carbon stock (148.73 tC/ha) and carbon sequestration rate (1.29 tC/ha/yr) are comparable to other reported studies in tropical forest areas (Bhat et al. 2003; Terakunpisut et al. 2007). Species wise carbon estimation revealed the dominance of top twenty species in total carbon storage at both time periods, i.e., 62 percent in 1991 and 58 percent in 2009. There is no relation between number of individuals of a species and its contribution to carbon storage. Species with more individuals, like Vateria indica and Holigarna arnottiana (1991) and Holigarna arnottiana, Aporusa lindlyana and Olea dioica (2009) contributed less compared to the species with fewer ones due to high number of lower girth class members (Fig. 2a). Presence of good number of young individuals ensures future carbon storage potential of the grove studied; on the other hand, middle and high girth class members bearing the signature of past carbon storage could continue if the grove remains relatively undisturbed. A detailed analysis of the tree species contribution to carbon sequestration showed that, 15 out of 20 topmost contributor species are common to both the time periods. These top 20 species either by their number or biomass contributed 62 percent and 58 percent carbon in 1991 and 2009, respectively. Moreover, girth class distribution of top 5 species at two time periods showed contrasting features. The middle to higher girth class members contribute much in earlier time period (1991), whereas, lower girth class members dominate the present time period (2009). The comparatively faster growth and large number of young members at current time scale, thus, surpasses older members in term of carbon storage. Contribution of such a small fragment in carbon sequestration is quite remarkable especially in agriculture and plantation dominated landscape.
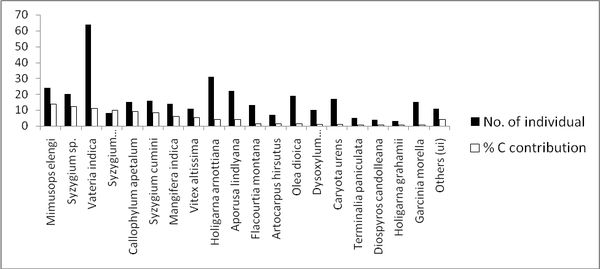
1991
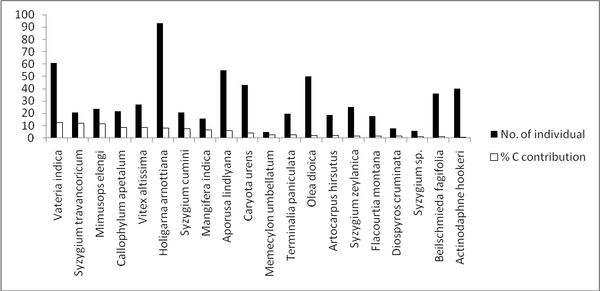
2009
Fig.2a. Carbon contribution of top 20 species in Devarabhattikan ( 1991 and 2009)
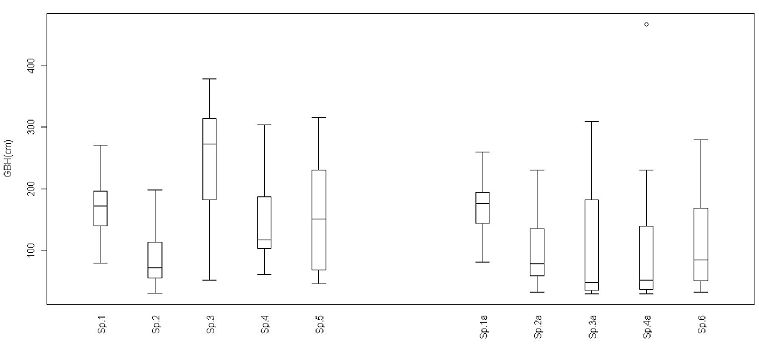
Fig.2b. Distribution of GBH values of top 5 carbon contributors in two time period.
Sp.1-5 indicates top 5 species in 1991, Sp.1a-6, same in 2009.
|
